
Process Dynamics a Refers to unsteadystate or transient
- Slides: 23
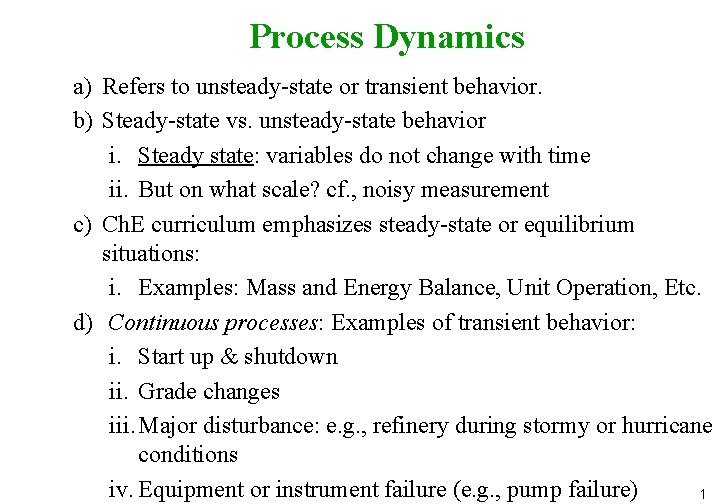
Process Dynamics a) Refers to unsteady-state or transient behavior. b) Steady-state vs. unsteady-state behavior i. Steady state: variables do not change with time ii. But on what scale? cf. , noisy measurement c) Ch. E curriculum emphasizes steady-state or equilibrium situations: i. Examples: Mass and Energy Balance, Unit Operation, Etc. d) Continuous processes: Examples of transient behavior: i. Start up & shutdown ii. Grade changes iii. Major disturbance: e. g. , refinery during stormy or hurricane conditions iv. Equipment or instrument failure (e. g. , pump failure) 1
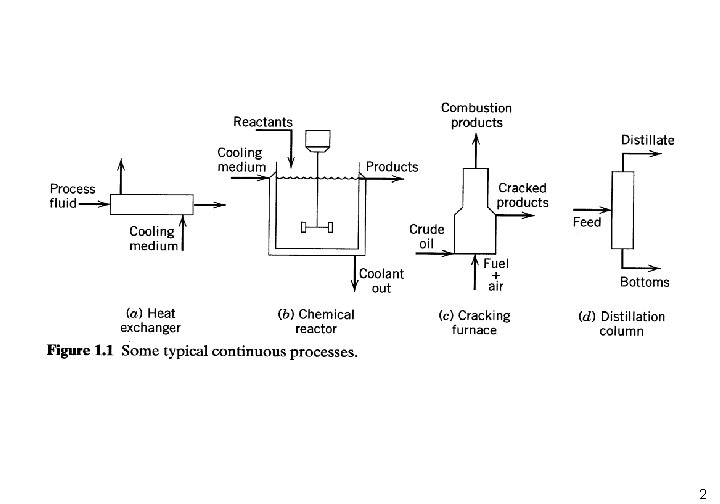
2
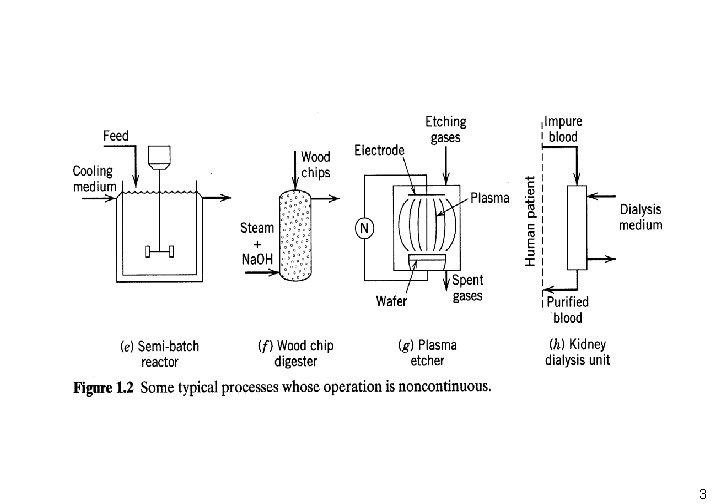
3 Chapter 1
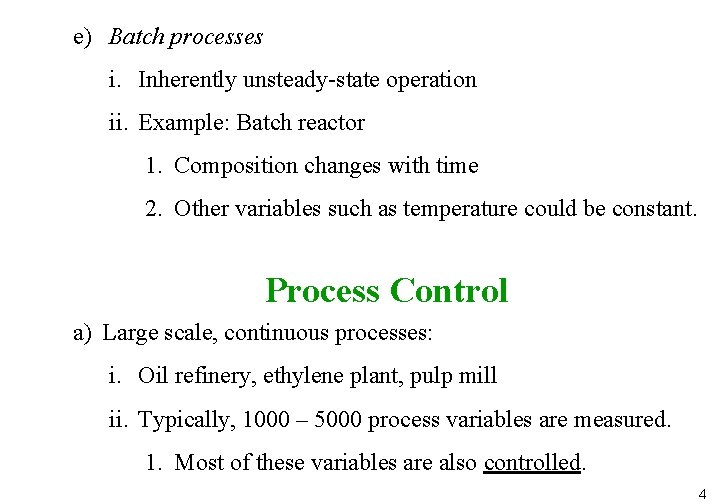
e) Batch processes i. Inherently unsteady-state operation ii. Example: Batch reactor 1. Composition changes with time 2. Other variables such as temperature could be constant. Process Control a) Large scale, continuous processes: i. Oil refinery, ethylene plant, pulp mill ii. Typically, 1000 – 5000 process variables are measured. 1. Most of these variables are also controlled. 4
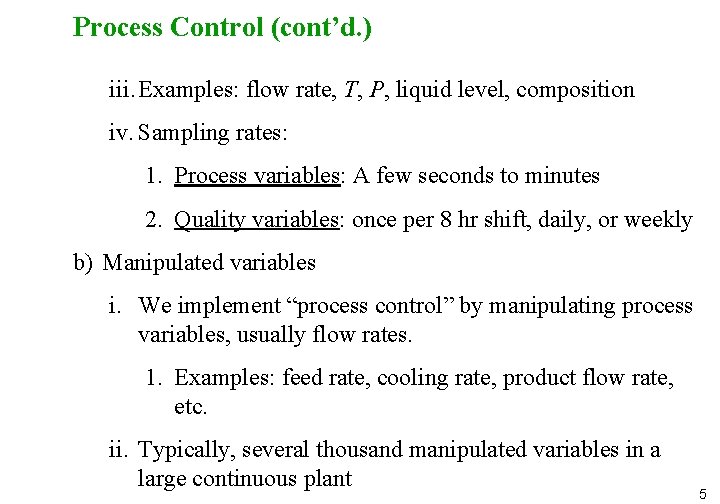
Process Control (cont’d. ) iii. Examples: flow rate, T, P, liquid level, composition iv. Sampling rates: 1. Process variables: A few seconds to minutes 2. Quality variables: once per 8 hr shift, daily, or weekly b) Manipulated variables i. We implement “process control” by manipulating process variables, usually flow rates. 1. Examples: feed rate, cooling rate, product flow rate, etc. ii. Typically, several thousand manipulated variables in a large continuous plant 5
Process Control (cont’d. ) c) Batch plants: i. Smaller plants in most industries 1. Exception: microelectronics (200 – 300 processing steps). ii. But still large numbers of measured variables. d) Question: How do we control processes? i. We will consider an illustrative example. 6
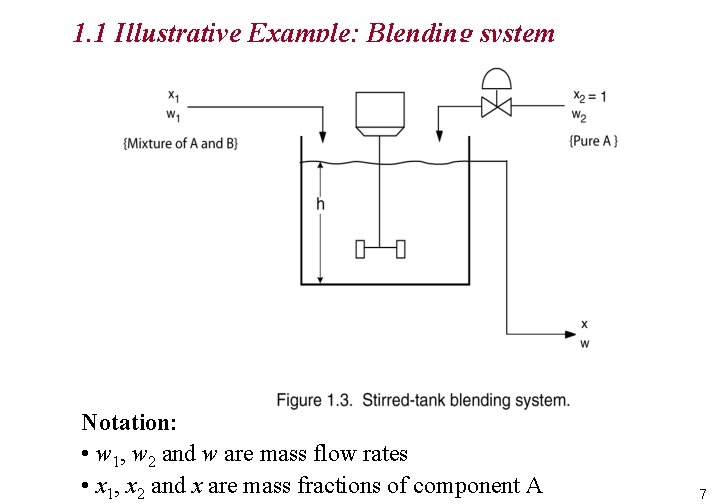
1. 1 Illustrative Example: Blending system Notation: • w 1, w 2 and w are mass flow rates • x 1, x 2 and x are mass fractions of component A 7
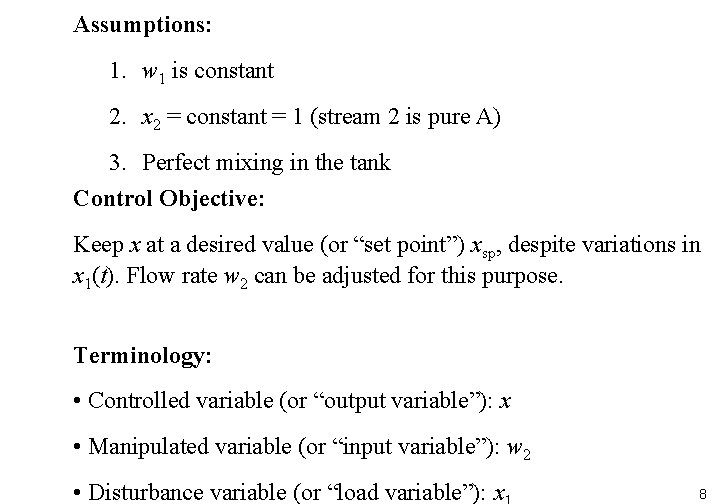
Assumptions: 1. w 1 is constant 2. x 2 = constant = 1 (stream 2 is pure A) 3. Perfect mixing in the tank Control Objective: Keep x at a desired value (or “set point”) xsp, despite variations in x 1(t). Flow rate w 2 can be adjusted for this purpose. Terminology: • Controlled variable (or “output variable”): x • Manipulated variable (or “input variable”): w 2 • Disturbance variable (or “load variable”): x 8
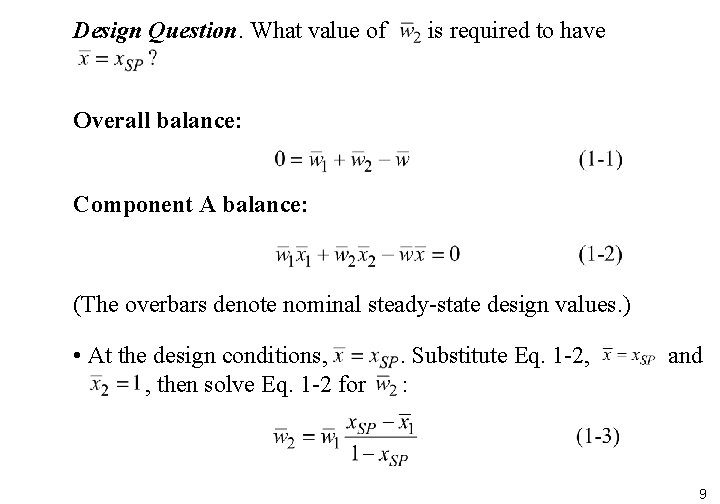
Design Question. What value of is required to have Overall balance: Component A balance: (The overbars denote nominal steady-state design values. ) • At the design conditions, , then solve Eq. 1 -2 for . Substitute Eq. 1 -2, : and 9
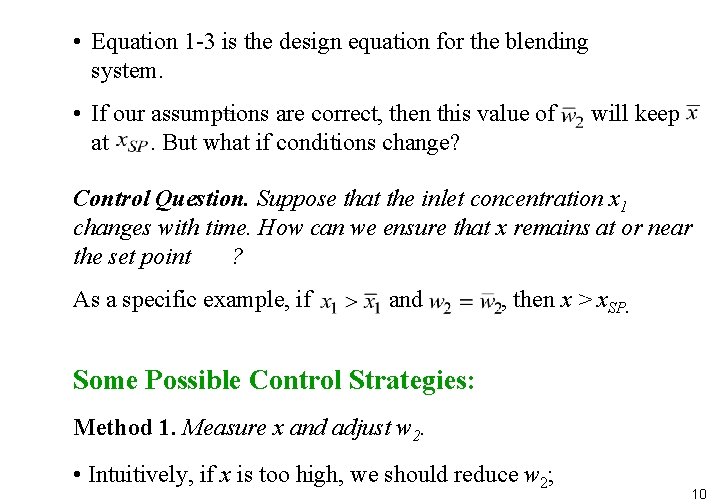
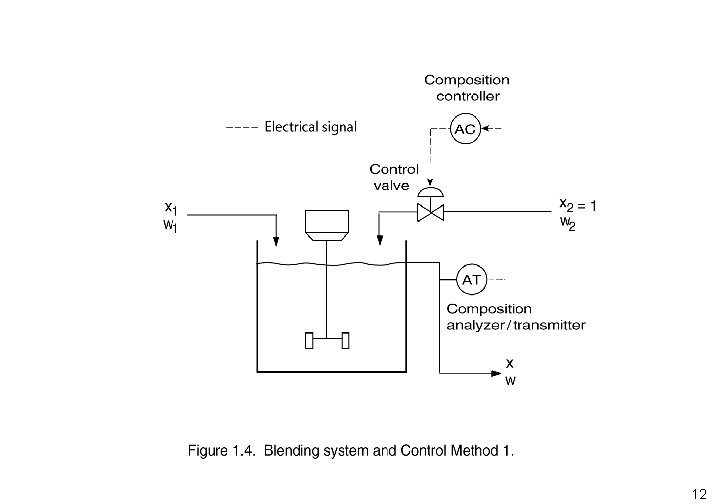
• Equation 1 -3 is the design equation for the blending system. • If our assumptions are correct, then this value of at. But what if conditions change? will keep Control Question. Suppose that the inlet concentration x 1 changes with time. How can we ensure that x remains at or near the set point ? As a specific example, if and , then x > x. SP. Some Possible Control Strategies: Method 1. Measure x and adjust w 2. • Intuitively, if x is too high, we should reduce w 2; 10
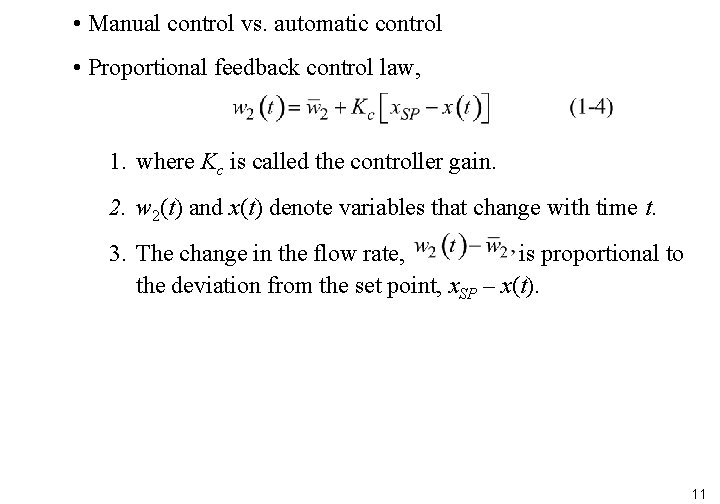
• Manual control vs. automatic control • Proportional feedback control law, 1. where Kc is called the controller gain. 2. w 2(t) and x(t) denote variables that change with time t. 3. The change in the flow rate, is proportional to the deviation from the set point, x. SP – x(t). 11
12
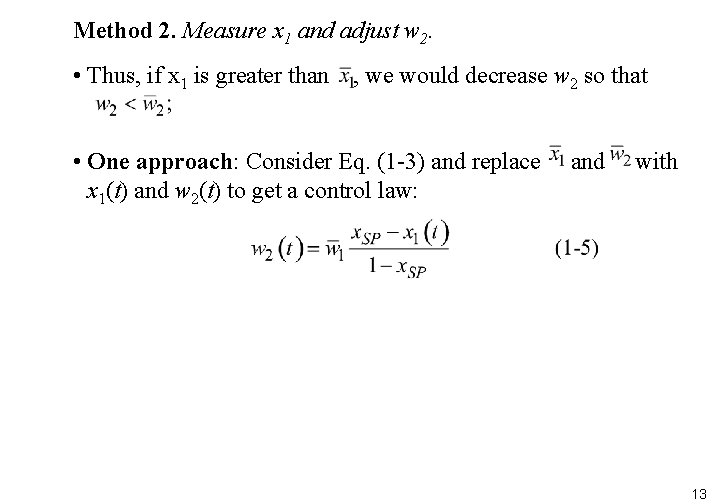
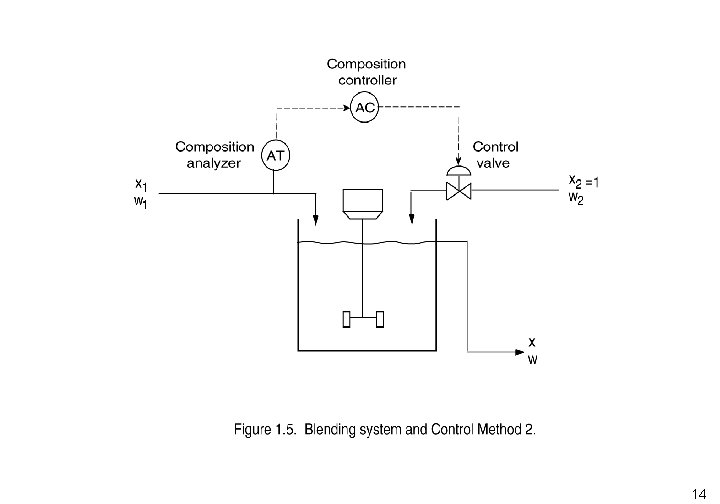
Method 2. Measure x 1 and adjust w 2. • Thus, if x 1 is greater than , we would decrease w 2 so that • One approach: Consider Eq. (1 -3) and replace x 1(t) and w 2(t) to get a control law: and with 13
14
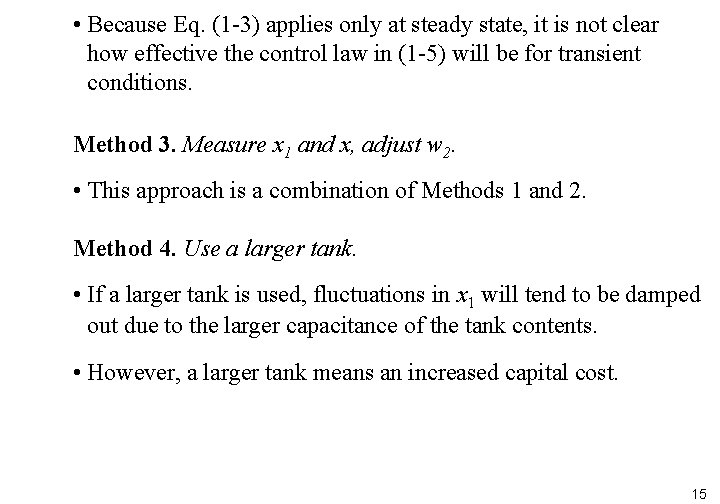
• Because Eq. (1 -3) applies only at steady state, it is not clear how effective the control law in (1 -5) will be for transient conditions. Method 3. Measure x 1 and x, adjust w 2. • This approach is a combination of Methods 1 and 2. Method 4. Use a larger tank. • If a larger tank is used, fluctuations in x 1 will tend to be damped out due to the larger capacitance of the tank contents. • However, a larger tank means an increased capital cost. 15
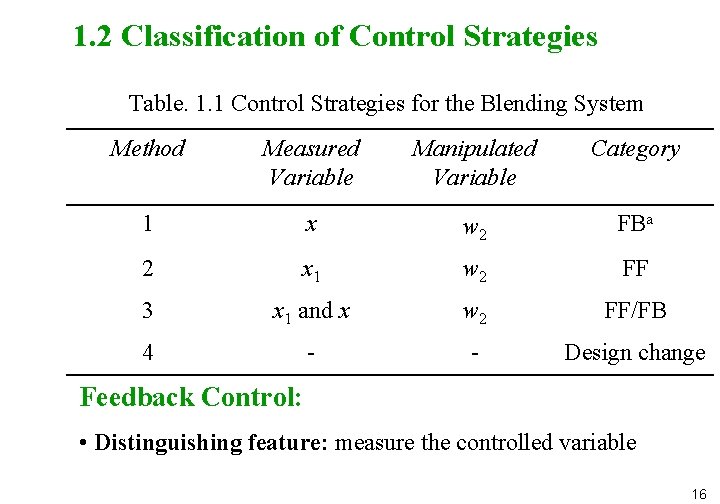
1. 2 Classification of Control Strategies Table. 1. 1 Control Strategies for the Blending System Method Measured Variable Manipulated Variable Category 1 x w 2 FBa 2 x 1 w 2 FF 3 x 1 and x w 2 FF/FB 4 - - Design change Feedback Control: • Distinguishing feature: measure the controlled variable 16
• It is important to make a distinction between negative feedback and positive feedback. Ø Engineering Usage vs. Social Sciences • Advantages: Ø Corrective action is taken regardless of the source of the disturbance. Ø Reduces sensitivity of the controlled variable to disturbances and changes in the process (shown later). • Disadvantages: Ø No corrective action occurs until after the disturbance has upset the process, that is, until after x differs from xsp. Ø Very oscillatory responses, or even instability… 17
Feedforward Control: Ø Distinguishing feature: measure a disturbance variable • Advantage: Ø Correct for disturbance before it upsets the process. • Disadvantage: Ø Must be able to measure the disturbance. Ø No corrective action for unmeasured disturbances. 18
Justification of Process Control Specific Objectives of Control • • • Increased product throughput Increased yield of higher valued products Decreased energy consumption Decreased pollution Decreased off-spec product Increased Safety Extended life of equipment Improved Operability Decreased production labor 19
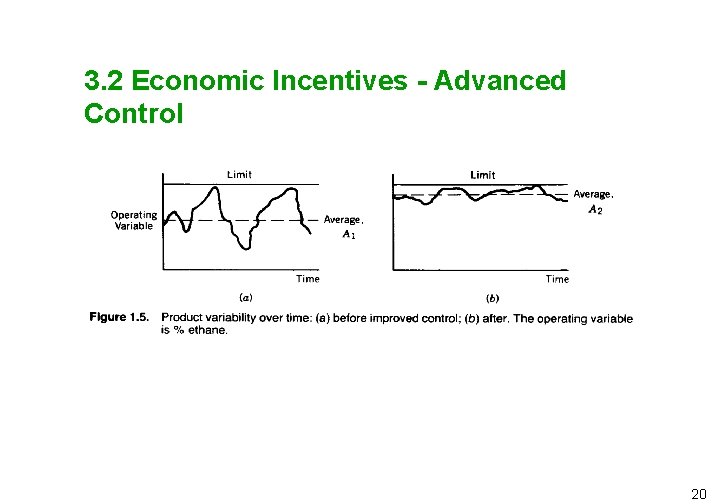
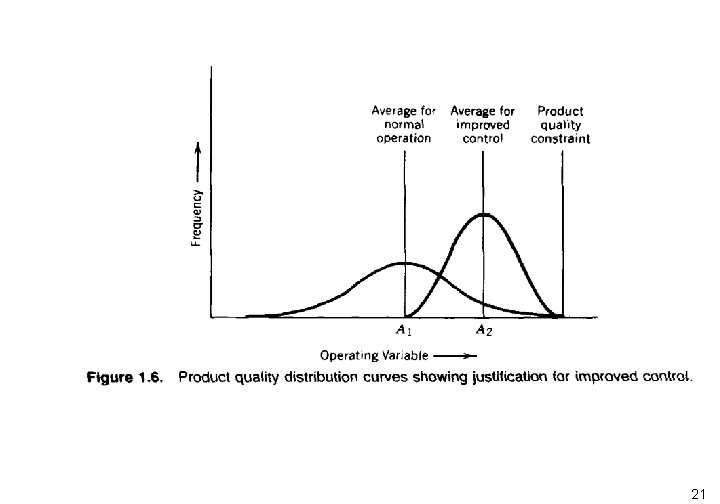
3. 2 Economic Incentives - Advanced Control 20
21
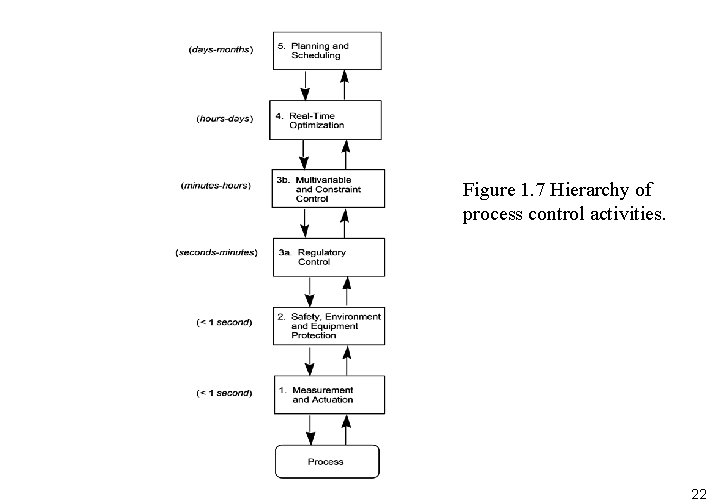
Figure 1. 7 Hierarchy of process control activities. 22
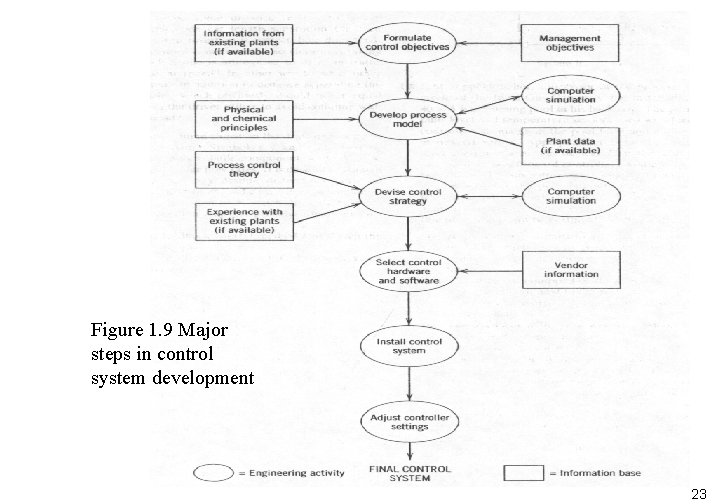
Figure 1. 9 Major steps in control system development 23