
PROCESS DESIGN CAPACITY PLANNING Roy D Shapiro Core


- Slides: 73
PROCESS DESIGN & CAPACITY PLANNING Roy D. Shapiro, Core Reading: Process Analysis, HBP No. 8007 (Boston: Harvard Business School Publishing, 2013).
OUTLINE Roy D. Shapiro, Core Reading: Process Analysis, HBP No. 8007 (Boston: Harvard Business School Publishing, 2013).
Product vs. Process Design Which decision comes first? – Design of process or – Design of product?
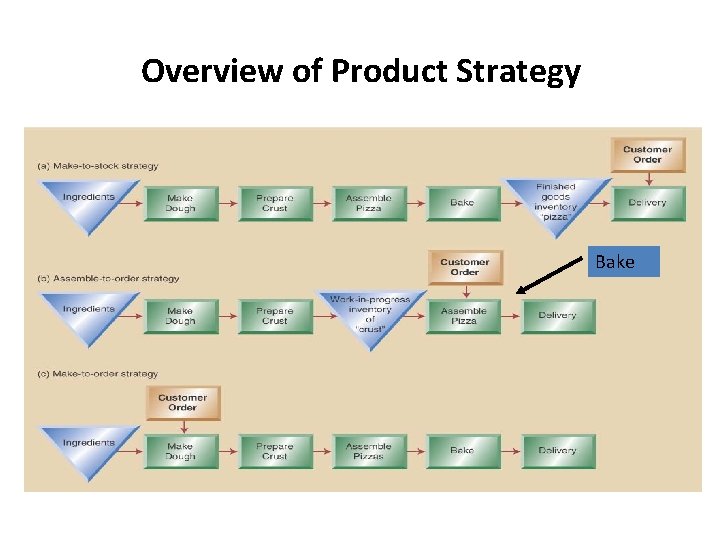
Product Strategy • Once a company decides to produce a given product or offer a particular service, company should decide if product or service is to be – Made-to-order – Assemble-to-order (or Built-to-Order) – Made-to-stock
Make-to-order • Products/services that are made to customer’s specs but only after an order is received. n Examples n n n Custom built home or office building Tailor made suit Commercial airplane Wedding cake Hair styling
Assemble-to-order (built-to-order) • Standard components are produced in anticipation of demand. • Once an order is received, components can be combined in different ways to accommodate different customer specs. n Examples n n n Computers (Dell) Cars built to customer’s specs Omelet
Make-to-stock • Products produced for immediate sale or delivery in anticipation of demand. • Product is standardized. • Produced in large volumes. n Examples n n n Cars TV sets Toothpaste
Overview of Product Strategy Bake
Product Strategy Options to Gain a Competitive Advantage Differentiation ► Low cost ► Rapid response ►
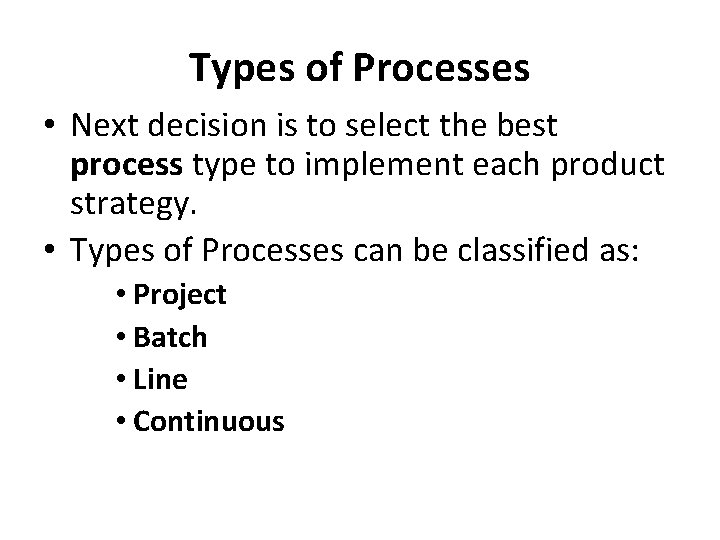
Types of Processes • Next decision is to select the best process type to implement each product strategy. • Types of Processes can be classified as: • Project • Batch • Line • Continuous
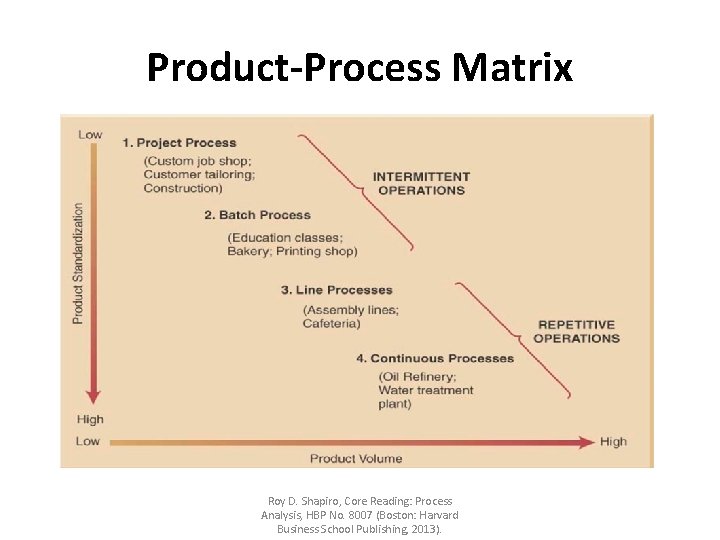
Product-Process Matrix Roy D. Shapiro, Core Reading: Process Analysis, HBP No. 8007 (Boston: Harvard Business School Publishing, 2013).
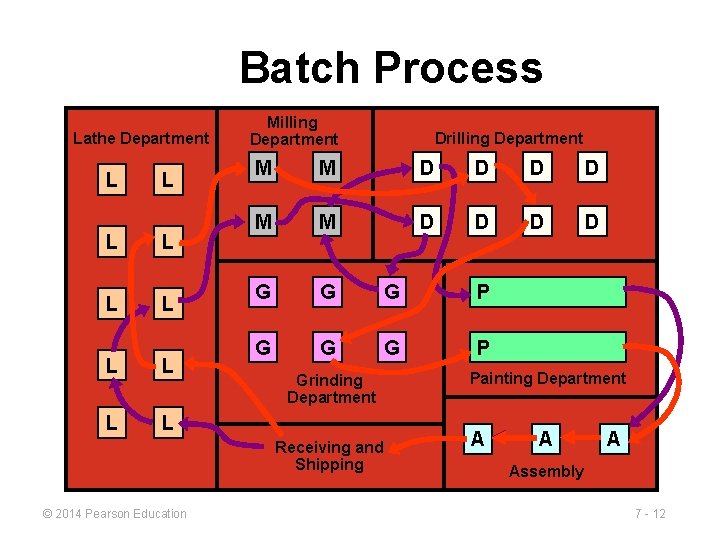
Batch Process Lathe Department L L L L L Milling Department M M D D D D G G G P Grinding Department Receiving and Shipping © 2014 Pearson Education Drilling Department Painting Department A Assembly 7 - 12
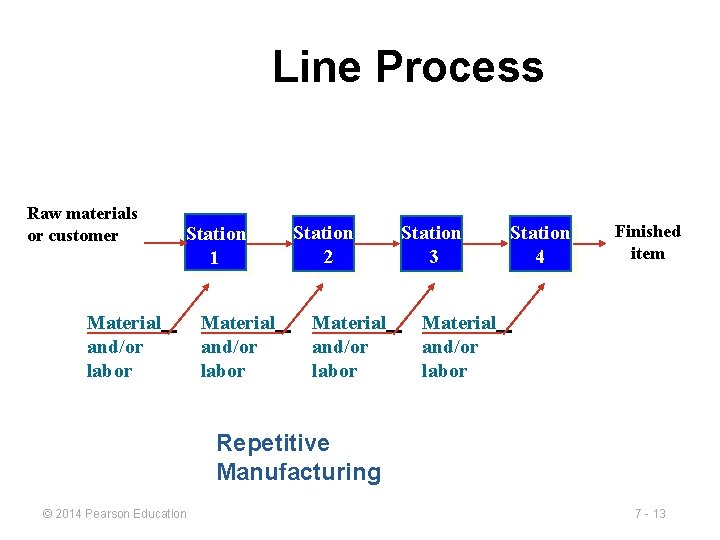
Line Process Raw materials or customer Station 1 Material and/or labor Station 2 Material and/or labor Station 3 Station 4 Finished item Material and/or labor Repetitive Manufacturing © 2014 Pearson Education 7 - 13
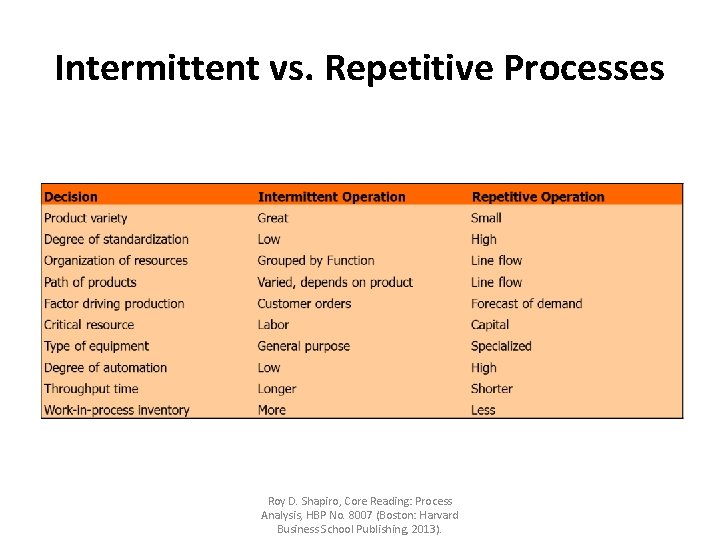
Intermittent vs. Repetitive Processes Roy D. Shapiro, Core Reading: Process Analysis, HBP No. 8007 (Boston: Harvard Business School Publishing, 2013).
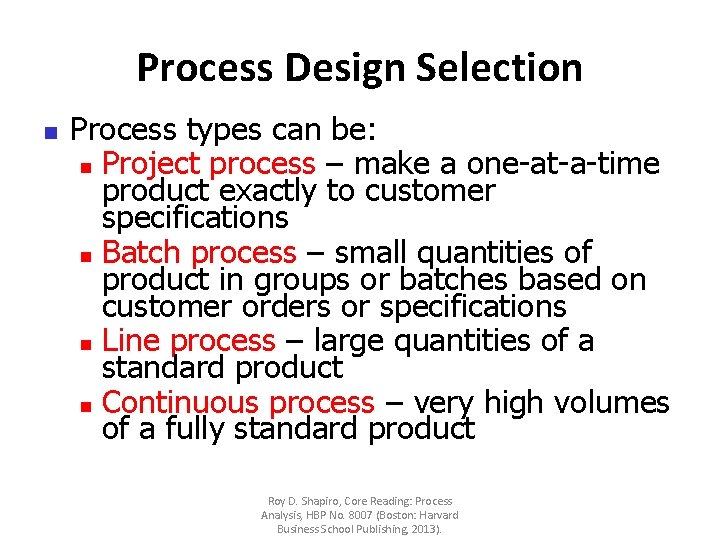
Process Design Selection n Process types can be: n Project process – make a one-at-a-time product exactly to customer specifications n Batch process – small quantities of product in groups or batches based on customer orders or specifications n Line process – large quantities of a standard product n Continuous process – very high volumes of a fully standard product Roy D. Shapiro, Core Reading: Process Analysis, HBP No. 8007 (Boston: Harvard Business School Publishing, 2013).
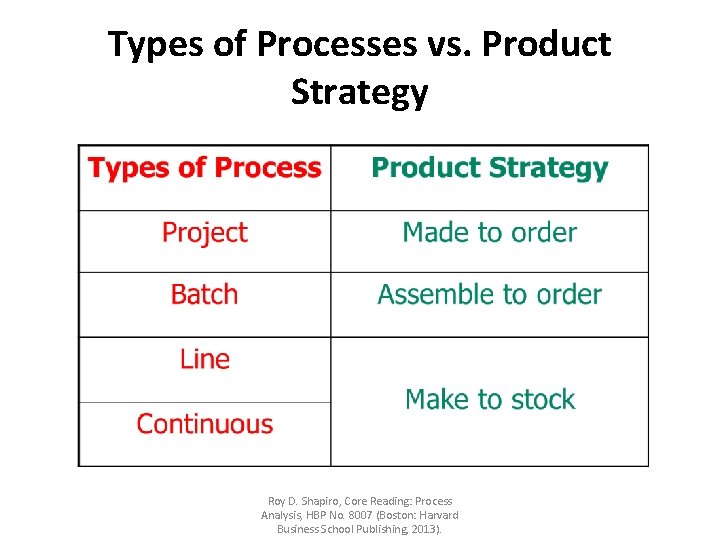
Types of Processes vs. Product Strategy Roy D. Shapiro, Core Reading: Process Analysis, HBP No. 8007 (Boston: Harvard Business School Publishing, 2013).
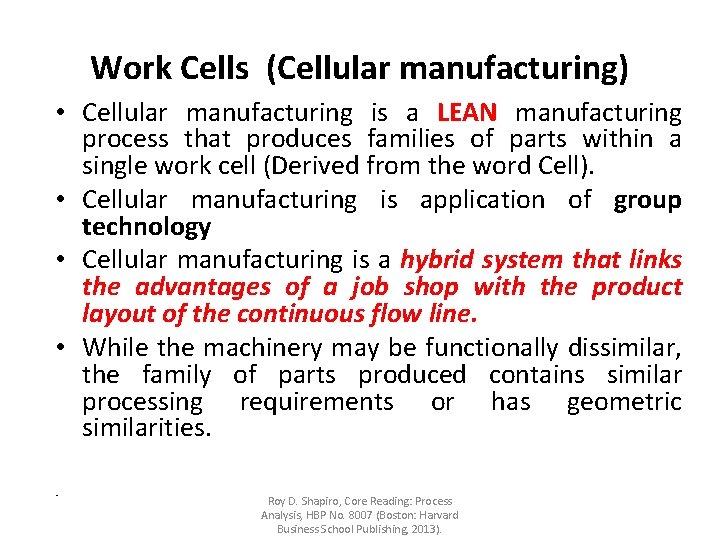
Work Cells (Cellular manufacturing) • Cellular manufacturing is a LEAN manufacturing process that produces families of parts within a single work cell (Derived from the word Cell). • Cellular manufacturing is application of group technology • Cellular manufacturing is a hybrid system that links the advantages of a job shop with the product layout of the continuous flow line. • While the machinery may be functionally dissimilar, the family of parts produced contains similar processing requirements or has geometric similarities. • Roy D. Shapiro, Core Reading: Process Analysis, HBP No. 8007 (Boston: Harvard Business School Publishing, 2013).
Work Cells (Cellular manufacturing) • Thus, all parts basically follow the same routing with some minor variations (e. g. , skipping an operation). • The cell design provides for quick and efficient flow, and the high productivity associated with assembly lines. • However, it also provides the flexibility of the job shop, allowing both similar and diverse products to be added to the line without slowing the process. Roy D. Shapiro, Core Reading: Process Analysis, HBP No. 8007 (Boston: Harvard Business School Publishing, 2013).
Part families with similarity in manufacturing process Part families with similarity in shape
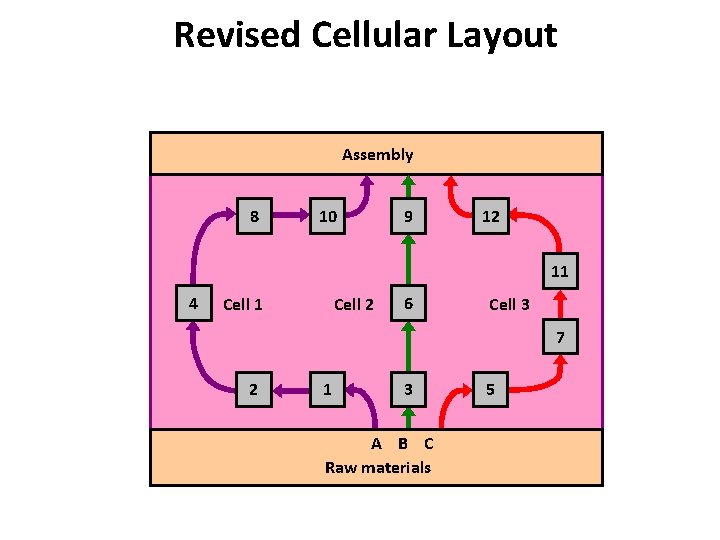
Original Process Layout Assembly 4 6 7 8 5 2 A B 12 10 3 1 9 C 11 Raw materials
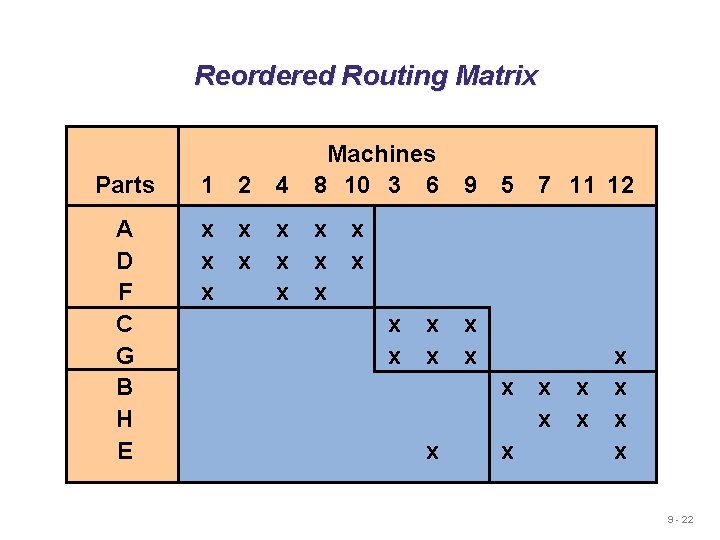
Part Routing Matrix Parts 1 2 A B C D E F G H x x Figure 5. 8 3 Machines 4 5 6 7 8 9 10 11 12 x x x x x x x 9 - 21
Reordered Routing Matrix Parts 1 2 4 Machines 8 10 3 6 A D F C G B H E x x x x x 9 5 x x 7 11 12 x x x x x 9 - 22
Revised Cellular Layout Assembly 8 10 9 12 11 4 Cell 1 Cell 2 6 Cell 3 7 2 1 3 A B C Raw materials 5
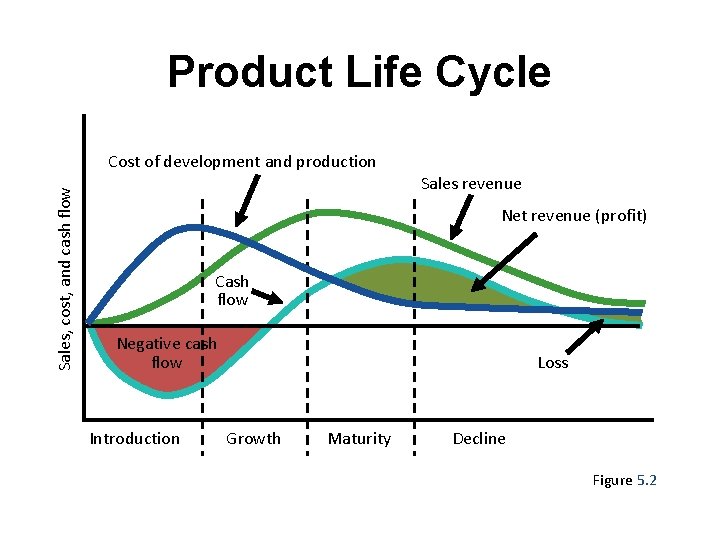
Product Life Cycle Sales, cost, and cash flow Cost of development and production Sales revenue Net revenue (profit) Cash flow Negative cash flow Introduction Loss Growth Maturity Decline Figure 5. 2
Discussion • Consider the life cycle of a product from introduction to maturity to decline. What kind of process strategy (job shop, batch process, or line flow) would be appropriate at each stage and why? (Note: Consider product-process matrix) • Under what circumstances the movement down the diagonal of the product-process matrix over the life cycle of the product may not occur? Roy D. Shapiro, Core Reading: Process Analysis, HBP No. 8007 (Boston: Harvard Business School Publishing, 2013).
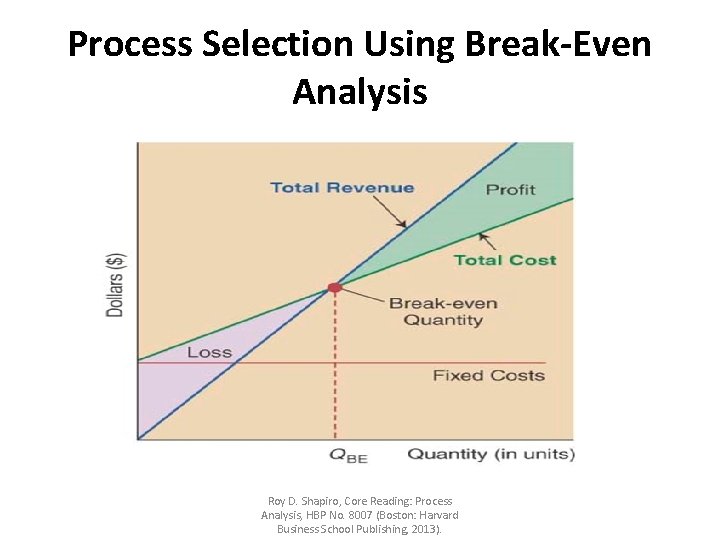
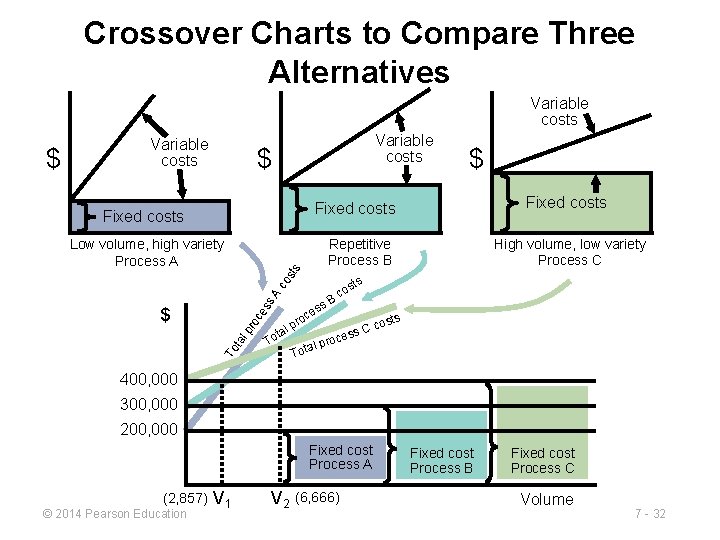
Process Selection & Break-Even Analysis • Breakeven analysis can be used to choose between two or more processes or between an internal process and buying those services or materials. • The solution finds the point at which the total costs of each of the two alternatives are equal. • The forecast volume is then applied to see which alternative has the lowest cost for that volume.
Process Selection Using Break-Even Analysis • Break-even point is the volume at which total revenues equal total costs. • Variable costs (c) are costs that vary directly with the volume of output. • Fixed costs (F) are those costs that remain constant with changes in output level.
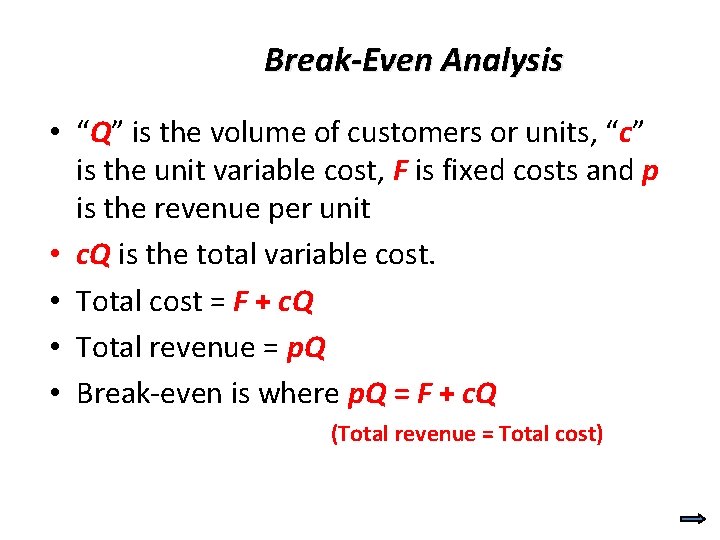
Break-Even Analysis • “Q” is the volume of customers or units, “c” is the unit variable cost, F is fixed costs and p is the revenue per unit • c. Q is the total variable cost. • Total cost = F + c. Q • Total revenue = p. Q • Break-even is where p. Q = F + c. Q (Total revenue = Total cost)
Break-Even Analysis can tell you… • If a forecast sales volume is sufficient to break even (no profit or no loss) • How low the variable cost per unit must be to break even given current prices and sales forecast. • How low the fixed cost need to be to break even. • How price levels affect the break-even volume.
Process Selection Using Break-Even Analysis Roy D. Shapiro, Core Reading: Process Analysis, HBP No. 8007 (Boston: Harvard Business School Publishing, 2013).
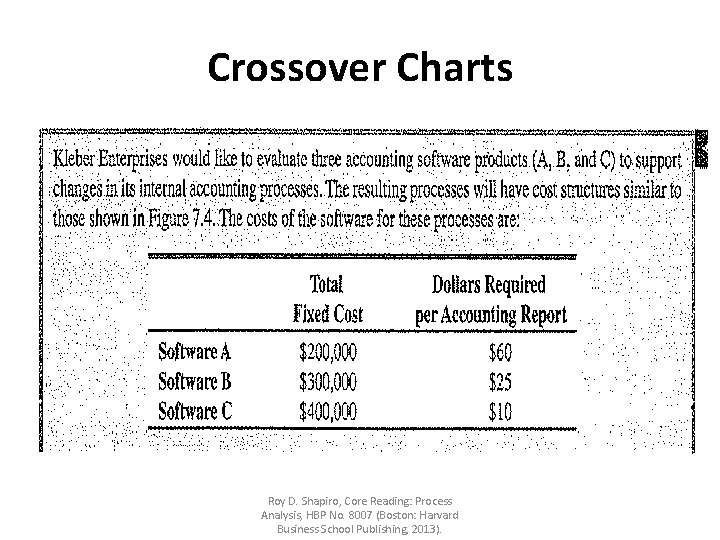
Crossover Charts Roy D. Shapiro, Core Reading: Process Analysis, HBP No. 8007 (Boston: Harvard Business School Publishing, 2013).
Crossover Charts to Compare Three Alternatives Variable costs $ $ Fixed costs Repetitive Process B ss A co sts Low volume, high variety Process A To ta lp ro ce $ s. B High volume, low variety Process C sts co s ce ts pro cos l C ta ss To roce p l Tota 400, 000 300, 000 200, 000 Fixed cost Process A (2, 857) © 2014 Pearson Education V 1 V 2 (6, 666) Fixed cost Process B Fixed cost Process C Volume 7 - 32
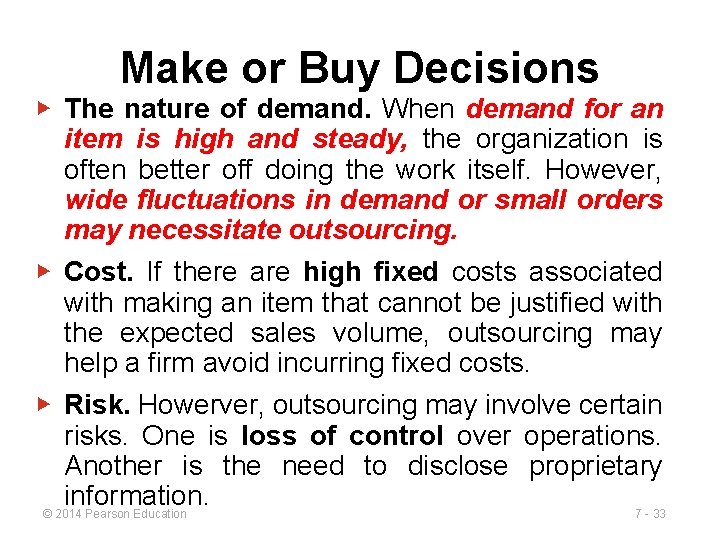
Make or Buy Decisions ▶ The nature of demand. When demand for an item is high and steady, the organization is often better off doing the work itself. However, wide fluctuations in demand or small orders may necessitate outsourcing. ▶ Cost. If there are high fixed costs associated with making an item that cannot be justified with the expected sales volume, outsourcing may help a firm avoid incurring fixed costs. ▶ Risk. Howerver, outsourcing may involve certain risks. One is loss of control over operations. Another is the need to disclose proprietary information. © 2014 Pearson Education 7 - 33
Example 1 ▶ A large international computer manufacturer is designing a new model of personal computer and must decide whether to produce the keyboards internally or to purchase them from an outside supplier. ▶ The supplier is willing to sell the keyboards for $50 each, but the manufacturer estimates that his firm can produce the keyboards for $35 each. ▶ Management estimates that expanding the current plant and purchasing the necessary equipment to make the keyboards would cost $8 million. Should they undertake the expansion? © 2014 Pearson Education 7 - 34
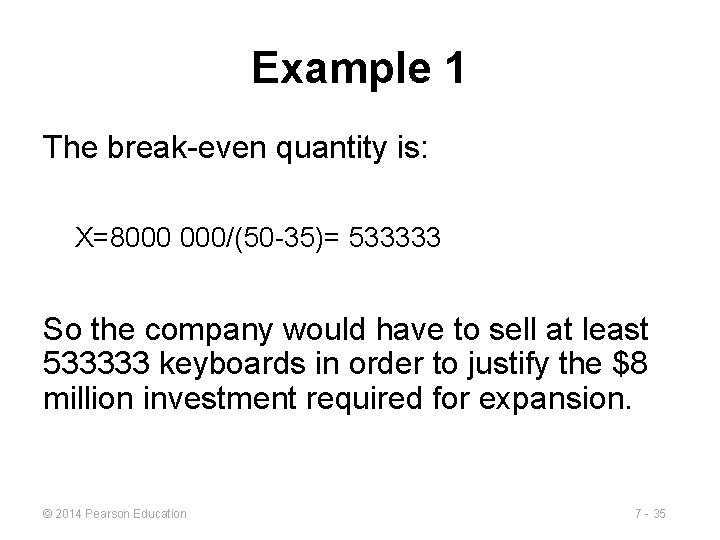
Example 1 The break-even quantity is: X=8000 000/(50 -35)= 533333 So the company would have to sell at least 533333 keyboards in order to justify the $8 million investment required for expansion. © 2014 Pearson Education 7 - 35
Example 2 ▶ The Giant Food Manufacturing Company has just completed its annual board meeting, and its directors all agreed that a new factory must be built to meet the growing demand for its products in the northeast United States. ▶ The company must decide between two production processing alternatives: conventional cooking and canning (CCC) and irradiation and poly-vac packaging (IVP). © 2014 Pearson Education 7 - 36
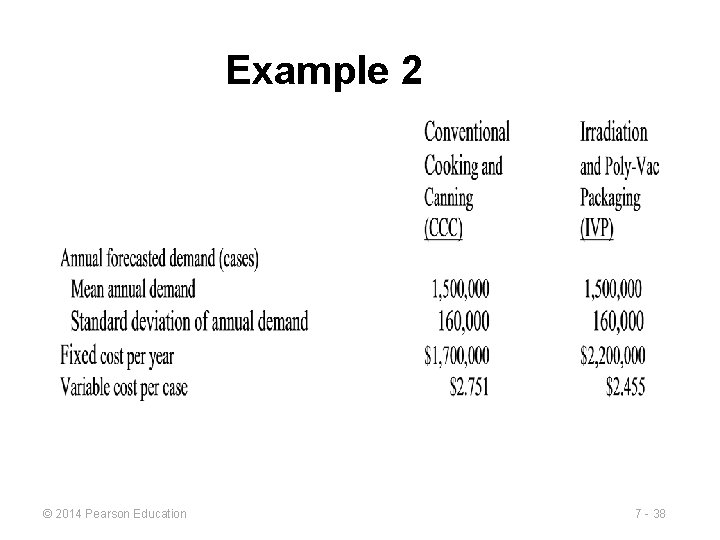
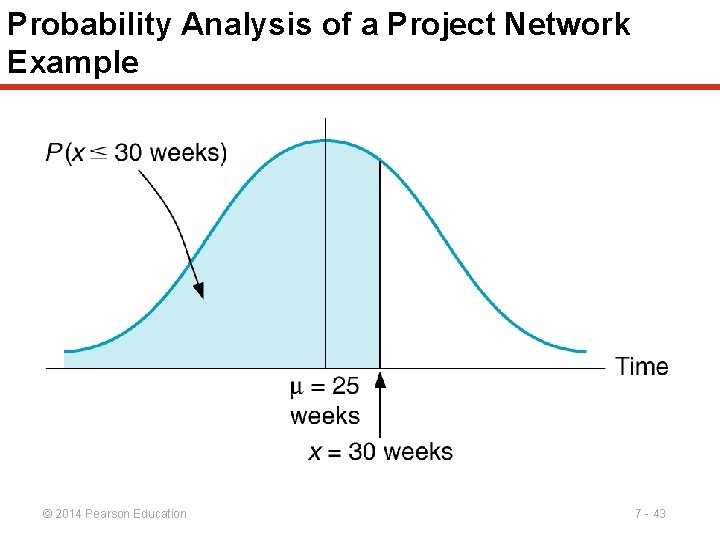
Example 2 ▶ Of particular concern is the uncertainty surrounding the level of demand for its food products. ▶ The company has developed sophisticated forecasting models that estimate levels of annual demand, and yet some uncertainty remains. ▶ The company has developed these demand cost estimates: © 2014 Pearson Education 7 - 37
Example 2 © 2014 Pearson Education 7 - 38
Questions ▶ 1. If the demand is assumed to be the mean demand, what is the production quantity at which the company would be indifferent between the two alternatives? ▶ 2. If the demand is assumed to be normally distributed, what is the probability that the IVP would be preferred? ▶ 3. What factors other than annual cost should be considered in this decision? © 2014 Pearson Education 7 - 39
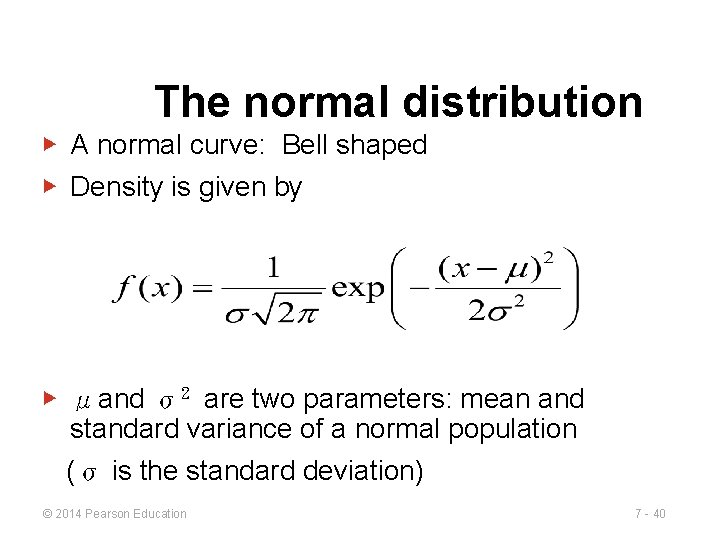
The normal distribution ▶ A normal curve: Bell shaped ▶ Density is given by ▶ μand σ2 are two parameters: mean and standard variance of a normal population (σ is the standard deviation) © 2014 Pearson Education 7 - 40
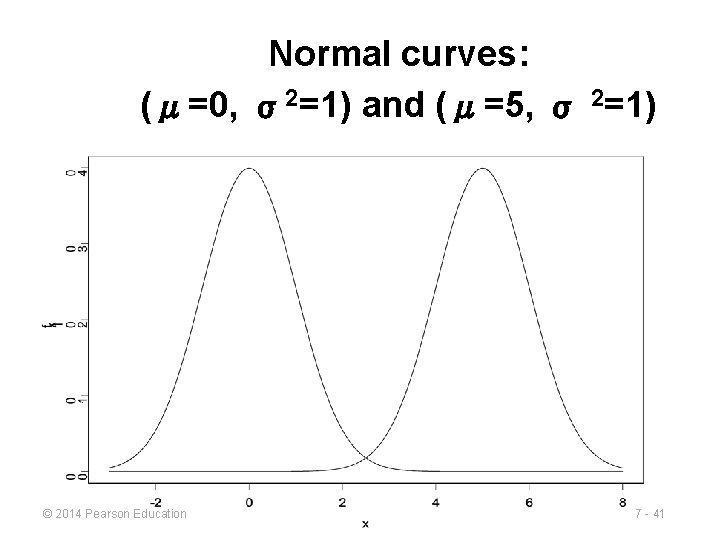
Normal curves: (μ=0, σ2=1) and (μ=5, σ 2=1) © 2014 Pearson Education 7 - 41
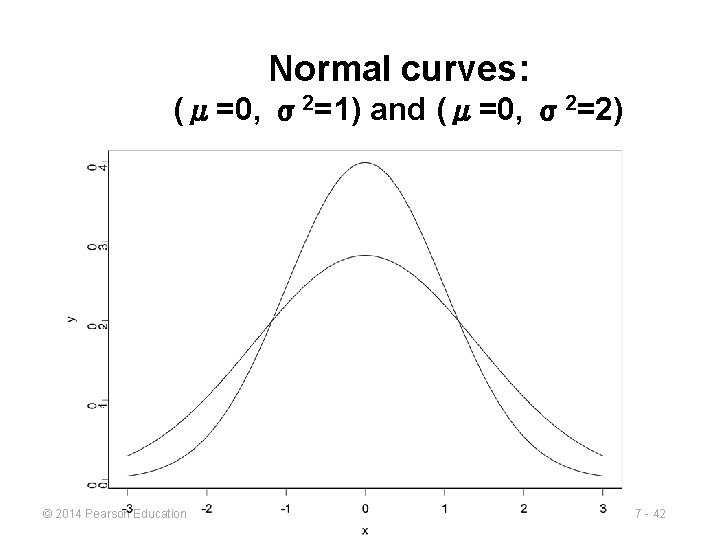
Normal curves: (μ=0, σ2=1) and (μ=0, σ2=2) © 2014 Pearson Education 7 - 42
Probability Analysis of a Project Network Example © 2014 Pearson Education 7 - 43
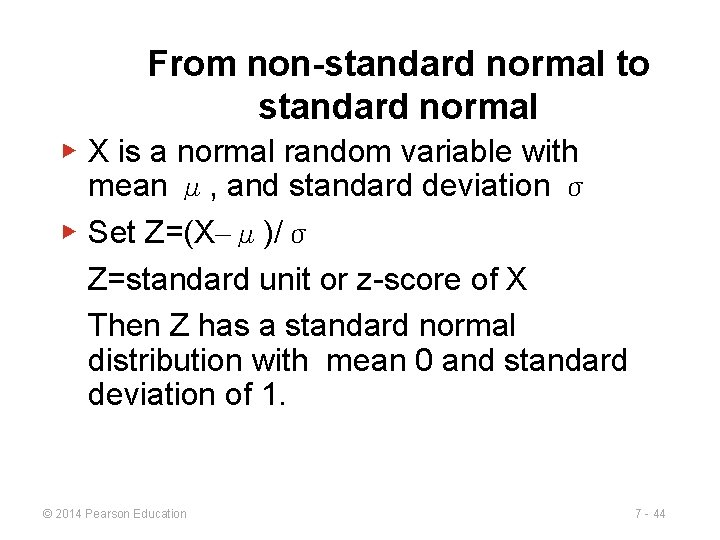
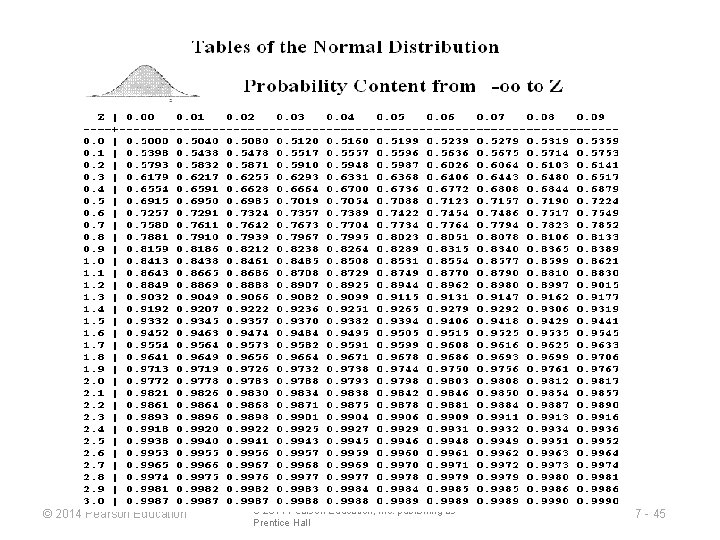
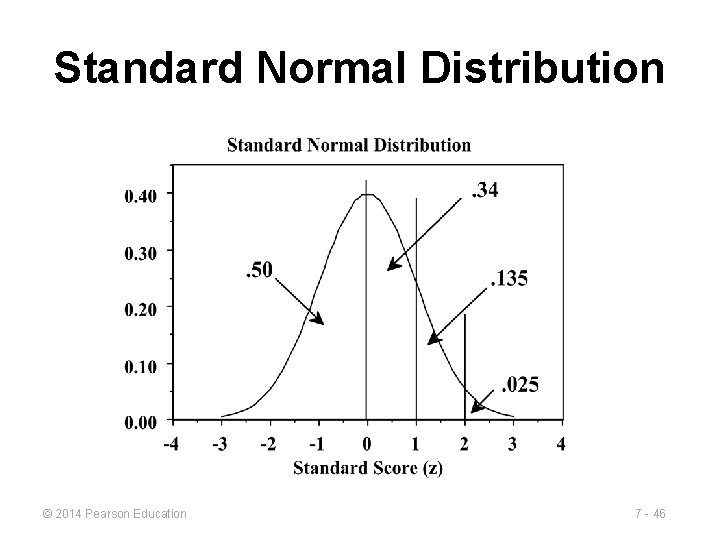
From non-standard normal to standard normal ▶ X is a normal random variable with mean μ, and standard deviation σ ▶ Set Z=(X–μ)/σ Z=standard unit or z-score of X Then Z has a standard normal distribution with mean 0 and standard deviation of 1. © 2014 Pearson Education 7 - 44
© 2014 Pearson Education © 2011 Pearson Education, Inc. publishing as Prentice Hall 7 - 45
Standard Normal Distribution © 2014 Pearson Education 7 - 46
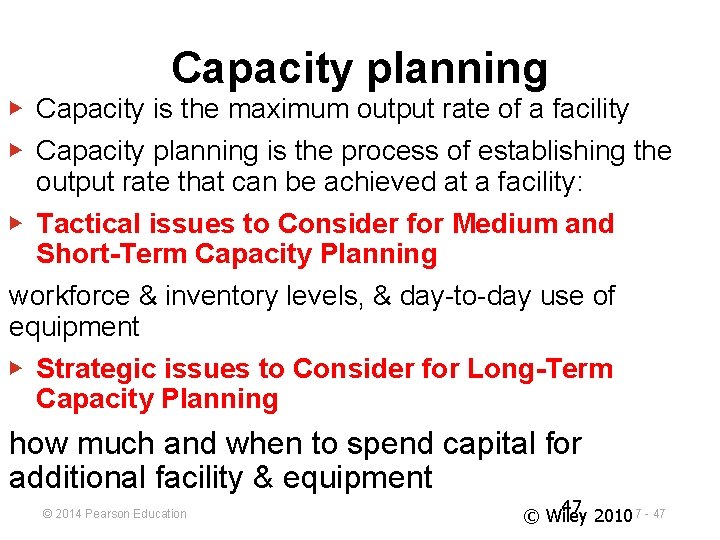
Capacity planning ▶ Capacity is the maximum output rate of a facility ▶ Capacity planning is the process of establishing the output rate that can be achieved at a facility: ▶ Tactical issues to Consider for Medium and Short-Term Capacity Planning workforce & inventory levels, & day-to-day use of equipment ▶ Strategic issues to Consider for Long-Term Capacity Planning how much and when to spend capital for additional facility & equipment © 2014 Pearson Education 47 2010 7 - 47 © Wiley
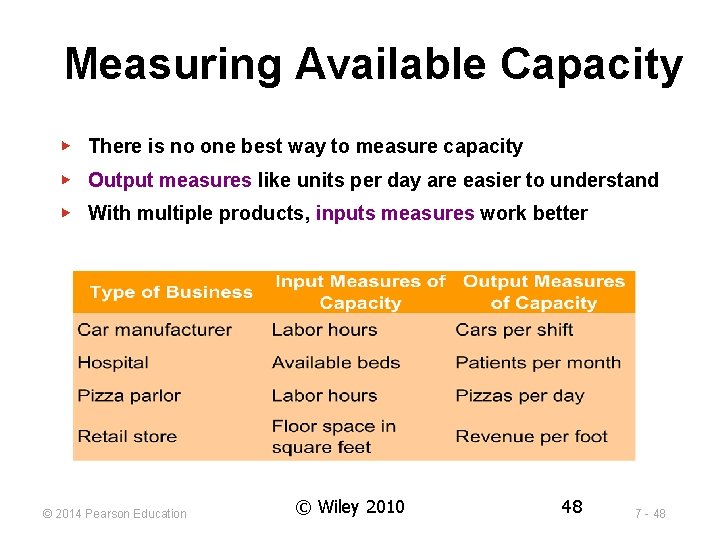
Measuring Available Capacity ▶ There is no one best way to measure capacity ▶ Output measures like units per day are easier to understand ▶ With multiple products, inputs measures work better © 2014 Pearson Education © Wiley 2010 48 7 - 48
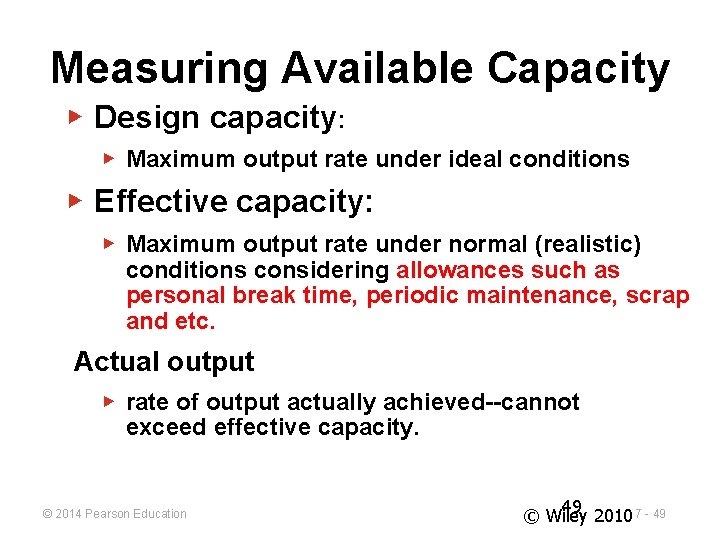
Measuring Available Capacity ▶ Design capacity: ▶ Maximum output rate under ideal conditions ▶ Effective capacity: ▶ Maximum output rate under normal (realistic) conditions considering allowances such as personal break time, periodic maintenance, scrap and etc. Actual output ▶ rate of output actually achieved--cannot exceed effective capacity. © 2014 Pearson Education 49 2010 7 - 49 © Wiley
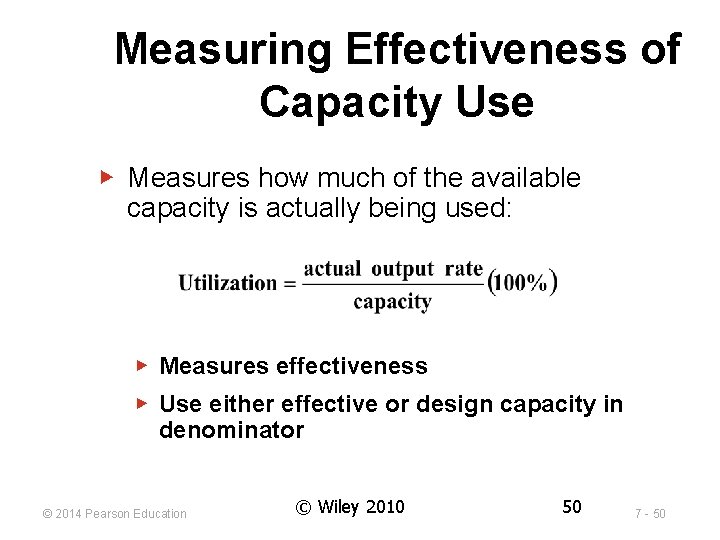
Measuring Effectiveness of Capacity Use ▶ Measures how much of the available capacity is actually being used: ▶ Measures effectiveness ▶ Use either effective or design capacity in denominator © 2014 Pearson Education © Wiley 2010 50 7 - 50
Example 1 Computing Capacity Utilization ▶ A bakery’s design capacity is 30 custom cakes per day. ▶ On the average this bakery can make 20 custom cakes per day (Effective Capacity) ▶ Currently the bakery is producing 28 cakes per day. ▶ What is the bakery’s capacity utilization relative to both design and effective capacity? © 2014 Pearson Education 7 - 51
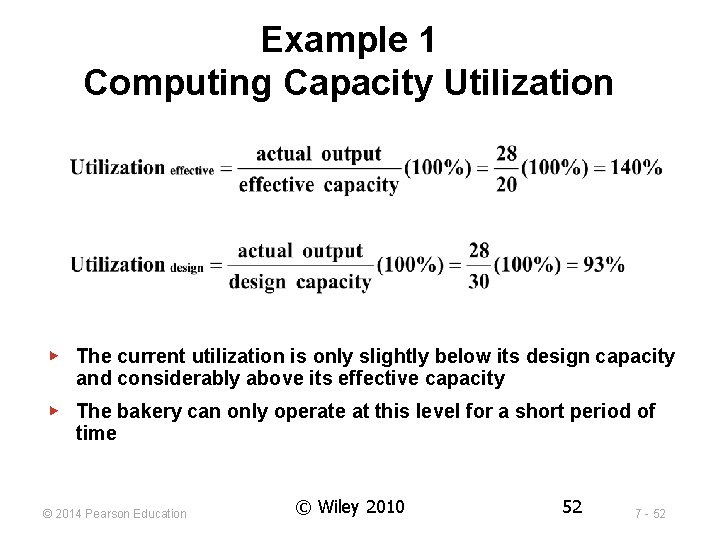
Example 1 Computing Capacity Utilization ▶ The current utilization is only slightly below its design capacity and considerably above its effective capacity ▶ The bakery can only operate at this level for a short period of time © 2014 Pearson Education © Wiley 2010 52 7 - 52
Example 2 Computing Capacity Utilization The Crystal Sparkle Co. produces glass tumblers. The plant is designed to produce 400 tumblers per hour, and there is 1 eight-hour shift per working day. However, the plant does not operate for the full 8 hours: the employees take two 15 -minute breaks in each shift, one in the first 4 hours and one in the second 4 hours, moreover, the first 30 minutes of the shift are spent raising the kilns to the required temperature for firing glass. The plant usually produces about 10, 000 tumblers per five -day workweek. Answer the following questions by adjusting the data to one eight-hour shift. © 2014 Pearson Education 7 - 53
Questions a. What is the design capacity in tumblers? b. What is the effective capacity in tumblers? As a percent? c. What is the actual output in tumblers? d. What is the efficiency ratio? e. What is the utilization ratio? © 2014 Pearson Education 7 - 54
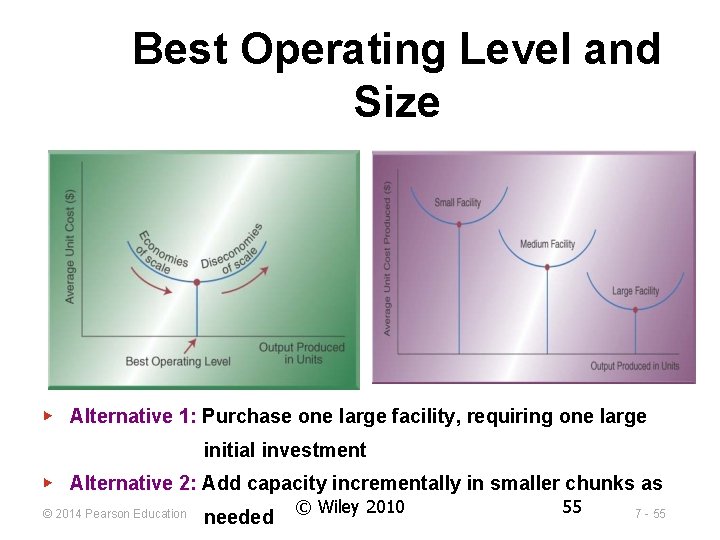
Best Operating Level and Size ▶ Alternative 1: Purchase one large facility, requiring one large initial investment ▶ Alternative 2: Add capacity incrementally in smaller chunks as © 2014 Pearson Education needed © Wiley 2010 55 7 - 55
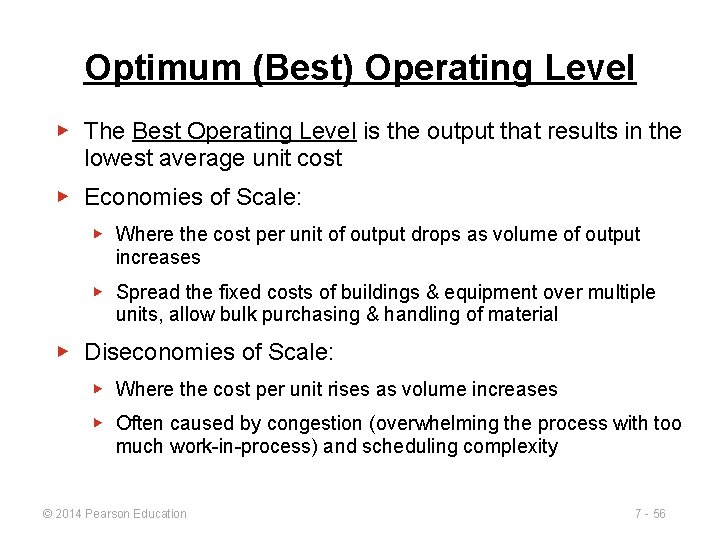
Optimum (Best) Operating Level ▶ The Best Operating Level is the output that results in the lowest average unit cost ▶ Economies of Scale: ▶ Where the cost per unit of output drops as volume of output increases ▶ Spread the fixed costs of buildings & equipment over multiple units, allow bulk purchasing & handling of material ▶ Diseconomies of Scale: ▶ Where the cost per unit rises as volume increases ▶ Often caused by congestion (overwhelming the process with too much work-in-process) and scheduling complexity © 2014 Pearson Education 7 - 56
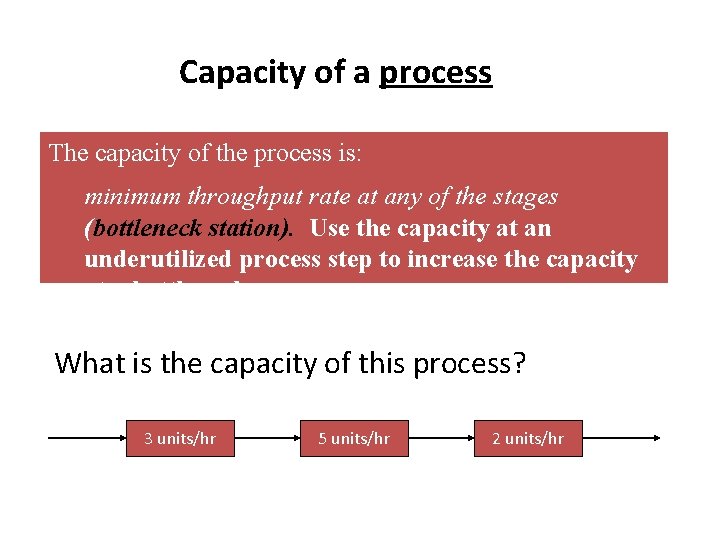
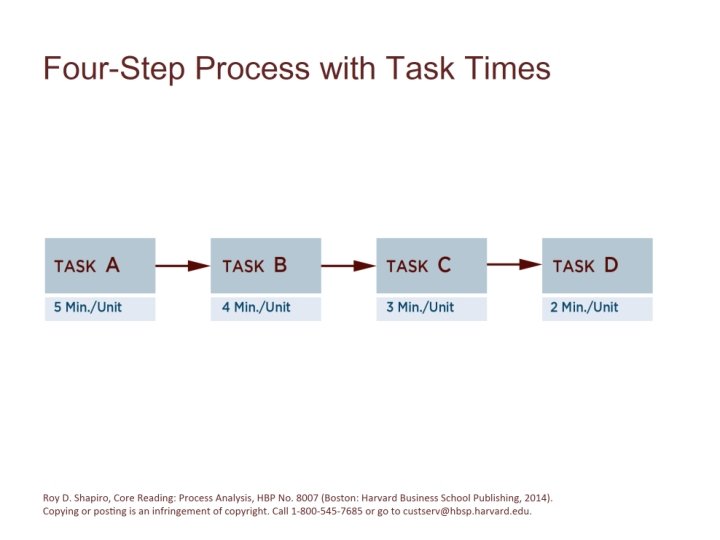
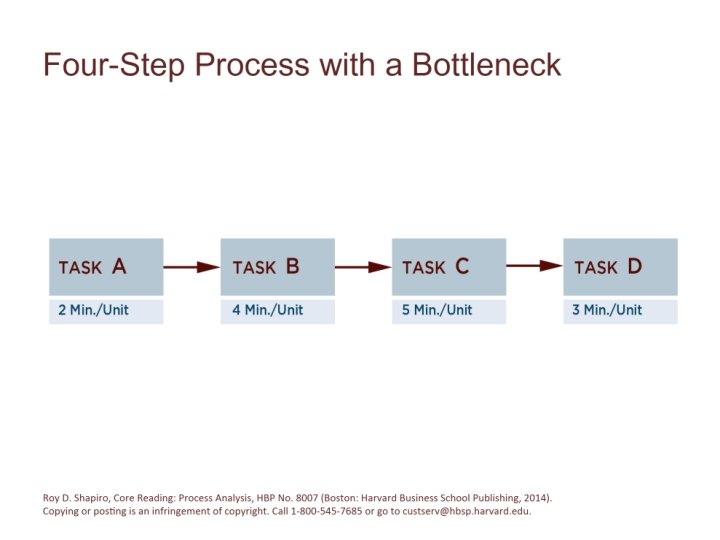
Capacity of a process The capacity of the process is: minimum throughput rate at any of the stages (bottleneck station). Use the capacity at an underutilized process step to increase the capacity at a bottleneck What is the capacity of this process? 3 units/hr 5 units/hr 2 units/hr
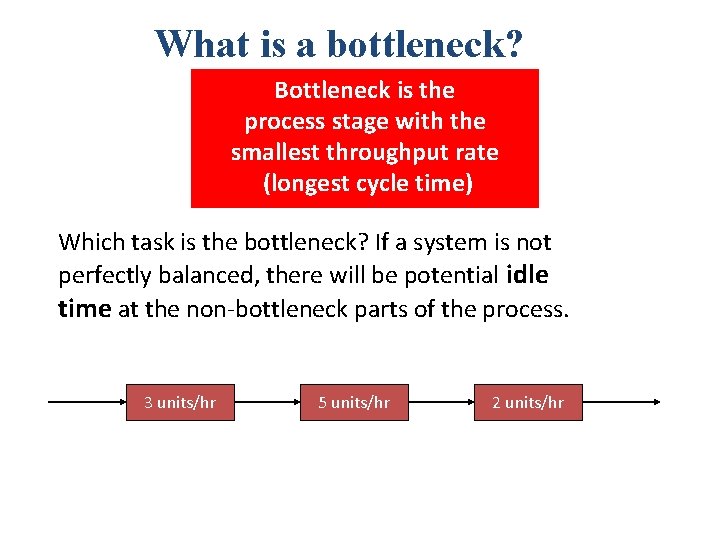
What is a bottleneck? Bottleneck is the process stage with the smallest throughput rate (longest cycle time) Which task is the bottleneck? If a system is not perfectly balanced, there will be potential idle time at the non-bottleneck parts of the process. 3 units/hr 5 units/hr 2 units/hr
Batch Size (Lot Size) and Setup Time When a process can be utilized to produce different product types, batch size and setup time become important issues • Batch Size: Number of units of a particular product type that will be produced before beginning production of another product type. • Setup Time: Time spent arranging and loading tools, setting machine speeds, etc. Before starting to process another type of product. Note that setup time is fixed and independent of the number of units to be produced. Run time is proportional to the batch size. To be efficient, often large batch sizes accompany to larfge setup time. Roy D. Shapiro, Core Reading: Process Analysis, HBP No. 8007 (Boston: Harvard Business School Publishing, 2013).
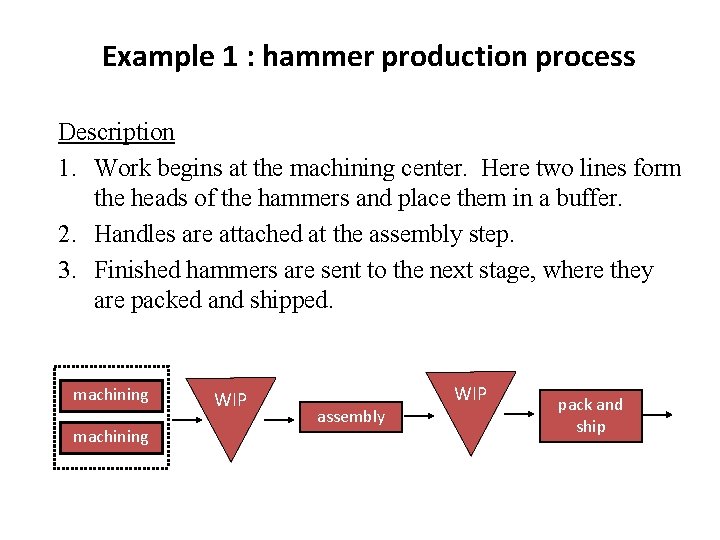
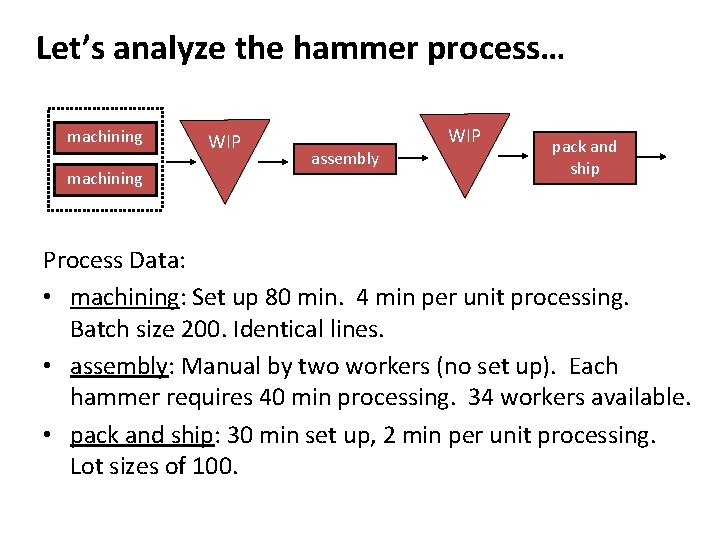
Example 1 : hammer production process Description 1. Work begins at the machining center. Here two lines form the heads of the hammers and place them in a buffer. 2. Handles are attached at the assembly step. 3. Finished hammers are sent to the next stage, where they are packed and shipped. machining WIP assembly pack and ship
Let’s analyze the hammer process… machining WIP assembly pack and ship Process Data: • machining: Set up 80 min. 4 min per unit processing. Batch size 200. Identical lines. • assembly: Manual by two workers (no set up). Each hammer requires 40 min processing. 34 workers available. • pack and ship: 30 min set up, 2 min per unit processing. Lot sizes of 100.
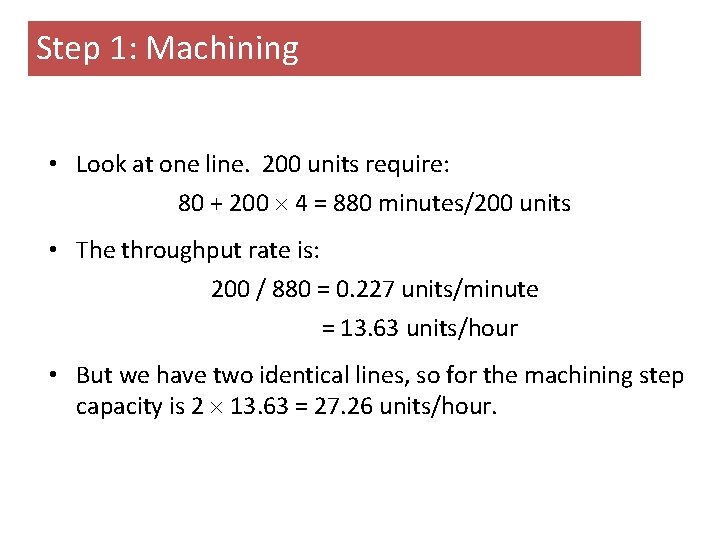
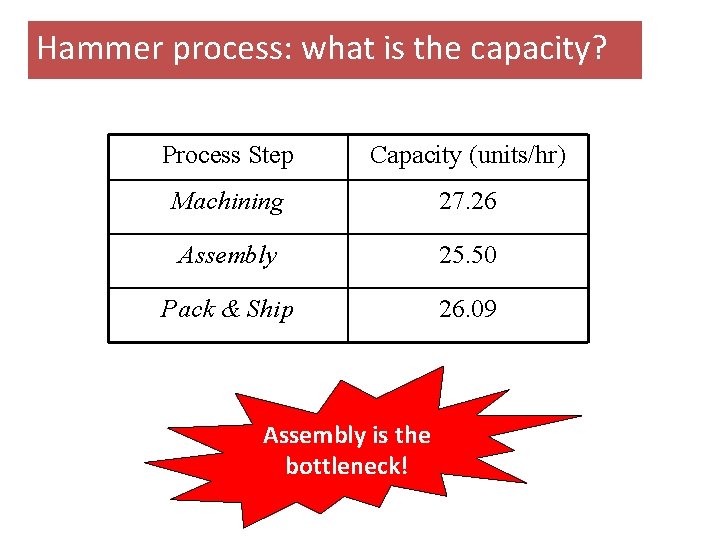
Step 1: Machining • Look at one line. 200 units require: 80 + 200 4 = 880 minutes/200 units • The throughput rate is: 200 / 880 = 0. 227 units/minute = 13. 63 units/hour • But we have two identical lines, so for the machining step capacity is 2 13. 63 = 27. 26 units/hour.
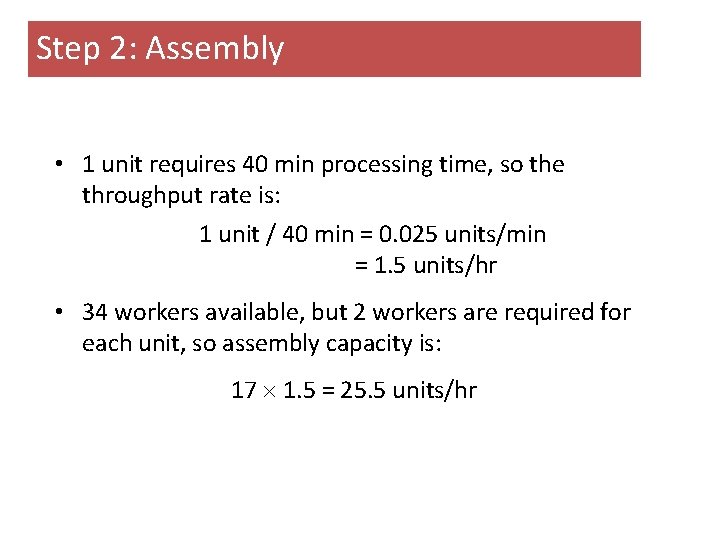
Step 2: Assembly • 1 unit requires 40 min processing time, so the throughput rate is: 1 unit / 40 min = 0. 025 units/min = 1. 5 units/hr • 34 workers available, but 2 workers are required for each unit, so assembly capacity is: 17 1. 5 = 25. 5 units/hr
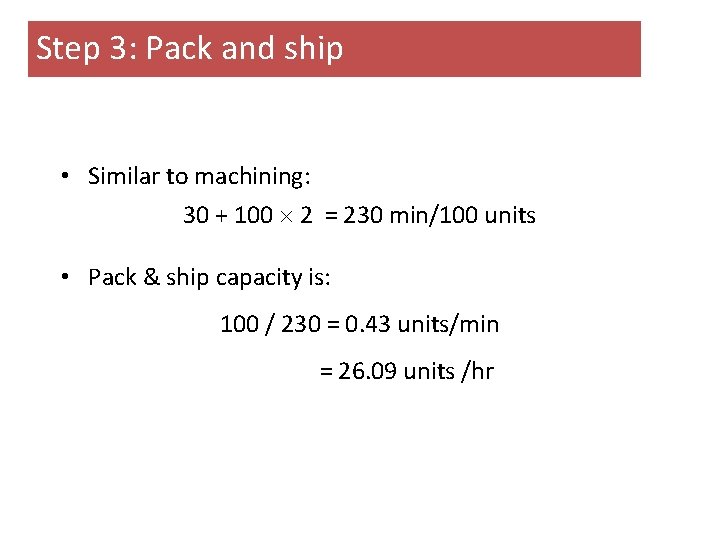
Step 3: Pack and ship • Similar to machining: 30 + 100 2 = 230 min/100 units • Pack & ship capacity is: 100 / 230 = 0. 43 units/min = 26. 09 units /hr
Hammer process: what is the capacity? Process Step Capacity (units/hr) Machining 27. 26 Assembly 25. 50 Pack & Ship 26. 09 Assembly is the bottleneck!
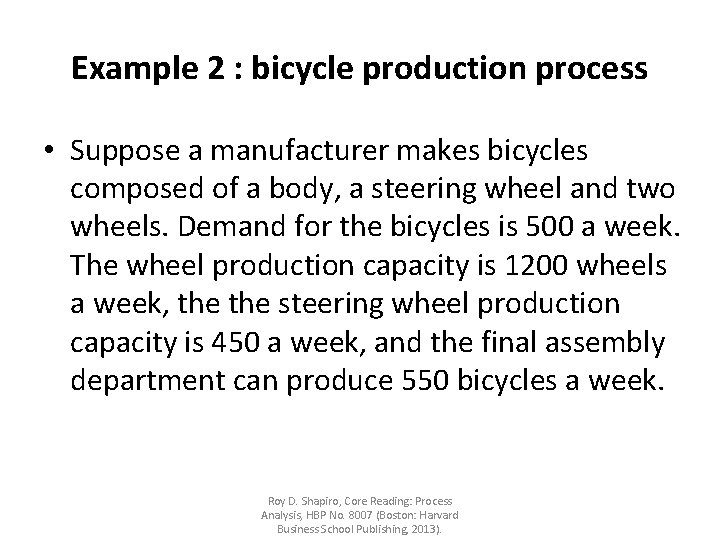
Example 2 : bicycle production process • Suppose a manufacturer makes bicycles composed of a body, a steering wheel and two wheels. Demand for the bicycles is 500 a week. The wheel production capacity is 1200 wheels a week, the steering wheel production capacity is 450 a week, and the final assembly department can produce 550 bicycles a week. Roy D. Shapiro, Core Reading: Process Analysis, HBP No. 8007 (Boston: Harvard Business School Publishing, 2013).
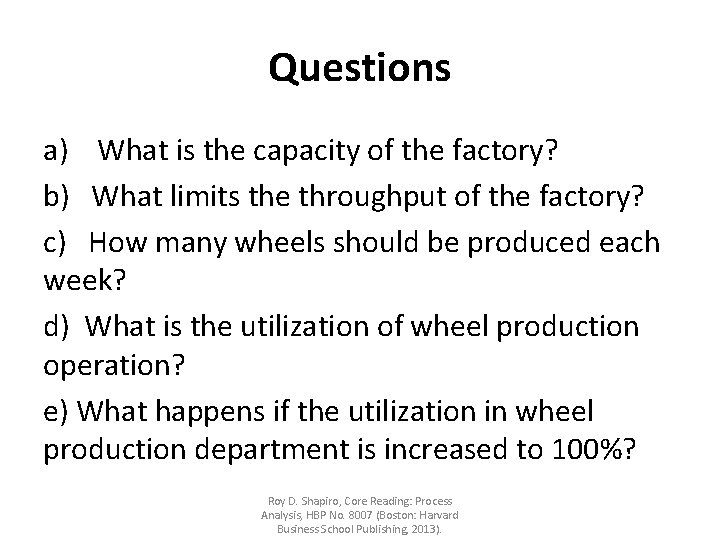
Questions a) What is the capacity of the factory? b) What limits the throughput of the factory? c) How many wheels should be produced each week? d) What is the utilization of wheel production operation? e) What happens if the utilization in wheel production department is increased to 100%? Roy D. Shapiro, Core Reading: Process Analysis, HBP No. 8007 (Boston: Harvard Business School Publishing, 2013).