Problem Tree Logical Frame work and indicators By

Problem Tree , Logical Frame work and indicators By Moses N Mwangi mwamoses@gmail. com +254722240741 1
 �M&E performance indicators �Setting-up")
�M&E and project management Project Frameworks (conceptual-, results-, and logical) �M&E performance indicators �Setting-up M&E systems

Area of coverage �Problem tree analysis �Objective tree �Log-frame �Indicators �M and E System

Problem Tree, • The Problem Tree method is a planning method based on needs • Problem Tree Analysis should be followed by actual project planning, e. g. with the Logical Framework approach • one should analyse the capacity and intentions of stakeholders and the wider institutional context, so that relevant and realistic choices can be made on who does what.

What does a problem tree do? • Address the real needs of the stakeholders • This process will result in an ‘image of reality', enabling the formulation of projects that comprise objectives that have been accepted and supported by all parties concerned. • Information collected through these methods can be used as input for a project planning workshop.

The problem tree helps Two words Focus Alignment 9/15/2021 6 6

The process of creating a problem tree • A properly planned project addressing the real needs of the stakeholders is necessarily based upon a correct and complete analysis of the existing situation. • The existing situation should be interpreted according to the views, needs, interests and activities of parties concerned. • The Problem Tree Analysis belongs to the family of participatory planning techniques, in which all parties involved identify and analyse the needs together. • Participatory methods aim to create ownership and commitment among the involved parties (e. g. stakeholders , implementing organisations, local governments).

Three stages in the analysis process in the Problem Analysis • Three stages in the analysis process in the Problem Analysis method will be discussed: – The analysis of problems related to the subject (the image of reality); – The analysis of objectives (the image of a future, improved situation); – The analysis of strategies (the comparison of different chains of objective).

The approach • There are several complementary methods to analyse a situation: – expert studies giving answers to questions as experts conceive them; – interviews with representatives of concerned groups and organisations providing perceptions as existing within that particular group or organisation; – a meeting, in which representatives of all parties concerned, including experts, discuss the same questions in a participatory way, often leading to an analysis, which is shared by all (e. g. Participatory Rural Appraisal).

The problem tree • After a common understanding of all problems is reached, the analysis is presented in the form of a diagram, or a problem tree. • A problem is never an isolated negative perceived situation, but relates to other problems. • In the problem tree the relations and hierarchy among all identified problems is expressed. • Each stated problem is preceded by the problem(s) which cause(s) it, and followed by the problem it causes itself.

What is a Problem Tree? A problem tree provides an overview of all the known causes and effects to an identified problem. Use of the 5 whys’

Problem tree • For example: lets draw a simple tree • the rice production in the low lands is decreasing due to the irrigation water not reaching the fields • Also due to the fact that there is an irregular supply of inputs for rice production. • The problem of a decreasing rice production itself contributes to the problem of food shortages.

The Process A problem tree is best completed with the Key stakeholders present. You may need anything from a couple of hours, to half a day or more depending on the complexity of your problem and the diversity of stakeholders present.

Steps to undertaking a problem tree 1. 2. 3. 4. Settle on the core problem Identify the causes and effects Develop a solution tree Select the preferred intervention

What does a Problem Tree look like?
")
The Core Problem A project should have a specific problem (students at passing exam) that it seeks to overcome if change is to occur. A vague or broad problem will have too many causes for an effective and meaningful project to be developed.

Example • The industry is complaining of poor quality graduates • Lets brain storm on the causes and effects

Objective Tree • After the problem analysis follows the analysis of objectives. This analysis includes: • the translation of the negative situations in the problem tree into a realised positive state (the objectives) for example, 'low rice production' is converted into 'improved rice production’; • verification of the hierarchy of objectives; • visualisation of means-end relationships in a diagram

Objective Tree • Also in this step it is of importance that all stakeholders are involved. • While transforming problems into objectives and verifying the hierarchy, discussion and feedback on the objectives is done. • This helps building consensus amongst the stakeholders. It might also be necessary to reformulate some of the problems.

Objective Tree • After having formulated the desired future situation the selection of possible interventions starts. • To analyse the strategies for implementation the following steps are taken: – identification of the different possible groups of objectives contributing to a higher objective (clustering); – choice of a strategy for the intervention, choosing the scope of the project (scoping).

Objective Tree • In the diagram of objectives, the different objectives sharing the same nature can be considered to be clusters. • The clustering should be based on common sense and should be of practical value in the planning stage. • The clusters should be neither too broadly nor too narrowly defined. It concerns the identification and selection of potential alternative strategies towards realising all or some of the objectives. • Clusters are made based on similarity of possible future activities, region or required expertise.

Objective tree • It is possible that problems are identified of which it is completely unrealistic to formulate an objective. • E. g. it is not possible to transform ‘heavy rainfall during rainy season’ into ‘no heavy rainfall during rainy season’, in the first instance the problem will be maintained. • one can think of measures to cope with the heavy rainfall, like proper drainage system or dikes to protect. • Important to realise is that while transforming problems into objectives one should remain realistic (is it feasible? ).

Select the preferred intervention This step is designed to allow the project team to select and focus an intervention on a preferred strategy. The solution tree may present a number of separate or linked interventions to solve a problem. Depending on project funding, time, and relevance, a planned intervention may not be able to tackle all the causes.

Select the preferred intervention If all the causes cannot be overcome by a project, or complementary projects, it is important to identify if any of the branches are more influential than others in solving a problem. This may impact on the success of your project. You can also consider the impact of other branches in your monitoring and evaluation.

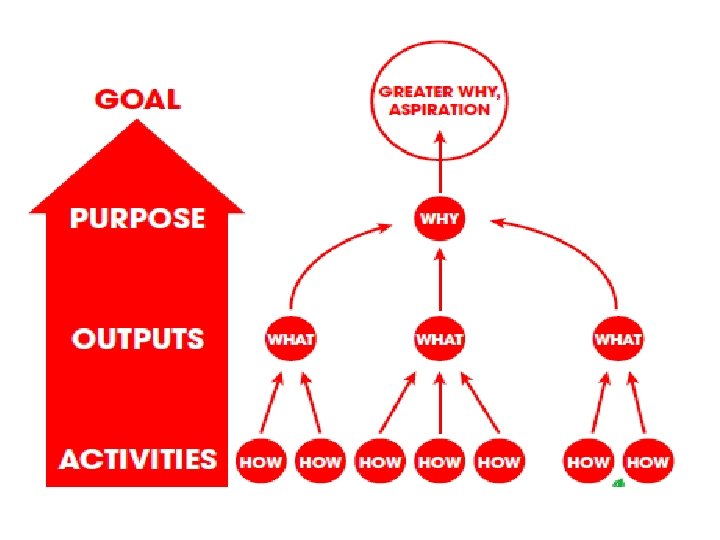
Using the solution tree to inform your project design Effects Core Cause Cause The effects become your intermediate and long term outcomes The core can become your project goal or immediate outcome The causes/solutions become your activities and objectives

GOAL Component 2 Objective Component 1 Objective Output 1. 1 Activities 1. 1. 1. 2 1. 1. 3 15/09/2021 Output 1. 2 Output 2. 1 Activities 1. 2. 1 1. 2. 2 1. 2. 3 Activities 2. 1. 1 2. 1. 2 2. 1. 3 Output 2. 2 Activities 2. 2. 1 2. 2. 2. 3 26

Next Step Now that you have a problem/solution tree, you can go on to develop a Log. Frame matrix, or a Program Logic.

What are Indicators? A quantitative or qualitative variable that allows the verification of changes produced by a development intervention relative to what was planned (UNDG Harmonized Terminology, 2003) In other words …. Means of measuring what actually happens against what has been planned in terms of quantity, quality and timeliness, for every level of result.

Indicators They are: • The blood stream of M & E • The signposts in a project ( are we in the right track? ) • They should be acceptable to all ( stakeholders and beneficiaries) • They guide monitoring/evaluation and thus gauging performance • They are negotiable: they are done at the planning stage • Should be based on objectives…. etc. 30

Quantitative vs Qualitative Indicators • In measuring results therefore the two types of indicators can be used: quantitative indicators that have a numerical value (how much) and qualitative indicators that reflect perceptions, judgments or attitudes (what, why). 31 31

Quantitative vs Qualitative Indicators • Quantitative indicators are measures of quantity such as the number of men and women in decision-making positions at the university , percentage of male and female attending BA course as compared to a baseline level. 32 32

Quantitative vs Qualitative Indicators • Qualitative indicators reflect people's judgments, opinions, perceptions and attitudes of a given situation or subject. 33 33

Quantitative vs Qualitative Indicators • They can include changes in sensitivity; satisfaction; influence; relevance; awareness; understanding; attitudes; quality; the perception of usefulness; the application of information or knowledge; the degree of openness; the quality of participation; the nature of dialogue; or the sense of well-being. 34 34

Quantitative vs Qualitative Indicators • Qualitative indicators can be obtained in a variety of ways including the use of focus groups, testimonials, application of PRA/PLA tools or through semi-structured interviewing and monitoring or field visits. 35 35

Examples of Indicators Goal Impact indicators Purpose Outcome indicators Infant mortality rate, under 5 mortality rate Objectives results Results monitoring Outputs Output indicators Activities Process indicators Input indicators Strategies means Implementation monitoring Project Logical Framework

INDICATO DATA R TYPE COLLECTION TIME FRAME Input/ Continuously Process Output Quarterly, semiannually, or annually Outcome 1 to 3 years Impact /Goal 2 to 5 years TYPES OF DATA SOURCES Routine data sources such as statistics about education or other government services Routine data sources such as routine monitoring data about training materials developed for schools Routine data sources such as statistics about education or other government services Routine data sources such as routine monitoring data about teacher absenteeism or the number of visits by agriculture extension officers Periodic data sources such as exit interview surveys Periodic data sources such as population-based surveys One-off data sources such as special studies (research or evaluation) Periodic data sources such as surveillance Periodic data sources such as population-based surveys One-off data sources such as special studies (research or evaluation)

Targets A target is an explicit statement or result derived for an indicator over any specified time period (to be provided at the level of output, outcomes and impact).

Indicators: The project process Input…Outcomes…Then impact 1. Input (e. g. funds; human resources; materials; equipment; time etc. ) 2. Output (e. g. Number of administrators trained; number of under students in Ph. D level etc. ) 39

Performance Indicators • Performance indicators are measures that show well a project/programme is achieving its set objectives. • Planned levels of achievement (targets) are different from indicators themselves. 40

Performance indicators Cont’d • Performance indicators define the data to be collected to measure progress • Performance indicators enable actual results achieved over time to be compared with planned results. 41

Selection of Indicators • Choosing proper indicators of change is crucial to setting up effective monitoring and evaluation system • Inappropriate indicators can doom an information system 42

Selection of Indicators Cont’d The criteria for selection of indicators include: Unambiguous definition: The indicator must be clearly defined in the programme/project’s context. Consistency: The values of the indicators should stay constant as long as they are collected in identical conditions, no matter who does collection. 43

Selection of Indicators Cont’d Specificity: Indicators should measure specific conditions that the programme/project aims to change Sensitivity: Indicators should be highly sensitive to changes in a programme/project. Ease of data collection: The collection of the data needed to calculate or assess the chosen indicators should be within the capability of the team. 44

Selection of Indicators Cont’d Note! It is uncommon to need more than three indicators to effectively track a result. 45

What are Good Indicators? SPECIFIC • In terms of quantity, quality, time, location, target groups, baseline and target for the indicator MEASURABLE • Will the indicator show desirable change? • Is it a reliable and clear measure of results? • Is it sensitive to changes in policies & programmes? • Do stakeholders agree on exactly what to measure? ACHIEVABLE • Are the result (s) realistic and based on risk assessment, partnership strategy and other factors contributing to the underlying result RELEVANT • Is it relevant to the intended result? • Does it reflect the expectations and success criteria for change in the target groups? TRACKABLE/TIMEBOUND • Are data actually available at reasonable cost & effort? • Can proxy indicators be used? • Are data sources known?
 Relevant (Appropriate to subject")
A good Indicator is…. . Y Clear (Precise and unambiguous) Relevant (Appropriate to subject at hand) Economic (Available at reasonable cost) Adequate (Must provide a sufficient basis to assess performance) Monitora (Must be amenable to ble independent validation)

Q &A

Q and A
- Slides: 49