Probiotics and Lactoferrin A review Keith Barrington Probiotics

Probiotics and Lactoferrin: A review Keith Barrington

Probiotics

What are probiotics? • “Live micro-organisms which when administered in adequate amounts confer a health benefit on the host” • FAO WHO 2001

Figure 1. The Pioneer Gut Microbiota in Human Neonates Vaginally Born at Term-A Pilot Study. KARLSSON, CAROLINE; MOLIN, GORAN; CILIO, CORRADO; AHRNE, SIV Pediatric Research. 70(3): 282 -286, September 2011. DOI: 10. 1203/PDR. 0 b 013 e 318225 f 765 Figure 1. Bacterial incidence in healthy neonates vaginally born at term. Incidence of different bacterial groups in the fecal microbiota of neonates in their first 48 h of life, presented as percentage of total number of neonates (n = 79). Primers used for the q. PCR analysis are indicated in Table 1. © International Pediatrics Research Foundation, Inc. 2011. All Rights Reserved. Published by Lippincott Williams & Wilkins, Inc. 4

• 29 prématurés <30 wk

The aggregate relative proportion of family-level faecal microbiota in 10 preterm infants at weeks 2 (A) and 4 (B) of life. Barrett E et al. Arch Dis Child Fetal Neonatal Ed doi: 10. 1136/archdischild-2012 -303035 Copyright © BMJ Publishing Group Ltd & Royal College of Paediatrics and Child Health. All rights reserved.

What is the source of the dysbiosis of the preterm infant? • Vaginal colonization with Bifido & Lacto as pregnancy advances • Often born by cesarian • Exposed to antibiotics pre and postnatally • Exposed to NICU flora • Multiple procedures – Fed by tube – Aspiration – Intubation • Less breast milk received

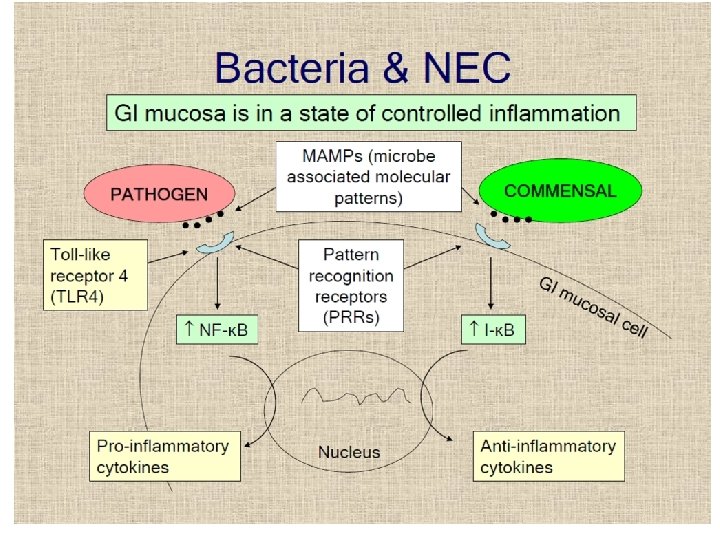
Why does breast milk decrease NEC? • ‘Contaminated’ with bifidobacteria and Lactobacilli • Prebiotics – fucosylated oligosaccahrides – Other molecules

Collado MC, Delgado S, Maldonado A, Rodríguez JM: Assessment of the bacterial diversity of breast milk of healthy women by quantitative real-time pcr. Letters in Applied Microbiology 2009, 48(5): 523 -528. Table 2. Detection of bacterial DNA in the breast milk samples by quantitative realtime PCR technique (q. RTi-PCR). Data are presented as log 10 (genome equivalent ml− 1) Bacterial groups Prevalence Range Mean ± SD Total bacteria 50/50 5· 05– 7· 76 6· 03 ± 0· 75 Staphylococcus group 50/50 1· 30– 5· 56 3· 55 ± 0· 84 Bifidobacterium group 50/50 2· 45– 4· 75 3· 56 ± 0· 53 Lactobacillus group 50/50 2· 61– 4· 50 3· 74 ± 0· 47 Enterococcus group 38/50 1· 20– 4· 85 2· 56 ± 0· 71 Streptococcus group 50/50 2· 91– 6· 11 4· 50 ± 0· 81 Bacteroides group 20/50 1· 50– 3· 35 2· 02 ± 0· 55 Clostridium cluster XIVa–XIVb 48/50 2· 27– 4· 85 3· 32 ± 0· 60 Clostridium cluster IV 2/50 1· 07– 2· 12 1· 60 ± 0· 17

Newburg DS, Ruiz-Palacios GM, Morrow AL: Human milk glycans protect infants against enteric pathogens. Annu Rev Nutr 2005, 25(1): 37 -58. Glycoconjugate Pathogen Reference Typical concentration a GM 1 Labile toxin, cholera toxin (44) 180 μg/liter GM 3 13 mg/liter Gb 3 Sulfatide Enteropathogenic Escherichia (20) coli Shiga toxin (36) Human immunodeficiency virus (59) Chondroitin sulfate Human immunodeficiency virus (39) 6 mg/liter Lactadherin Mucin Mannosylated glycopeptide Rotavirus S-fimbriated E. coli Enterohemorrhagic E. coli (62) (50) (2) 100 μg/liter 1 g/liter 60 mg/liter Oligosaccharides Streptococcus pneumoniae (1) 0. 2– 10 g/liter Enteropathogenic E. coli (9) 3 g/liter Listeria monocytogenes (6) 3 g/liter Fucosylated oligosaccharides (46) (41) Macromolecule-associated glycans Sialyllactose Campylobacter jejuni Vibrio cholerae Stable toxin Noroviruses Pseudomonas aeruginosa Cholera toxin E. coli P. aeruginosa Aspergillus fumigatus conidia (23) (26) 1– 25 mg/liter 40 μg/liter 370 mg/liter (21) (53, 57) (10) (3) 200 mg/liter Influenza virus Polyomavirus Helicobacter pylori (13, 29) (52) (33) 200 mg/liter 200 100– 150 μg/liter 100 μg/liter

• Siggers RH, Siggers J, Thymann T, Boye M, Sangild PT: Nutritional modulation of the gut microbiota and immune system in preterm neonates susceptible to necrotizing enterocolitis. The Journal of Nutritional Biochemistry 2011, 22(6): 511 -521.
 of sequence libraries. Samples collected from infants without NEC (control)")
Principal coordinate analysis (PCA) of sequence libraries. Samples collected from infants without NEC (control) are represented by squares (blue); samples from infants with NEC are represented by circles (red). Distribution of samples collected from infants with NEC was distinct from that collected from control infants. Samples C 9 and CN 10, which were collected from control patients who later developed NEC, notably clustered with the NEC group.

Establishment and development of intestinal microbiota in preterm neonates FEMS Microbiology Ecology Volume 79, Issue 3, pages 763 -772, 15 DEC 2011 DOI: 10. 1111/j. 15746941. 2011. 01261. x http: //onlinelibrary. wiley. com/doi/10. 1111/j. 15746941. 2011. 01261. x/full#fem 1261 -fig-0001

Latest meta-analysis • Wang Q, Dong J, Zhu Y: Probiotic supplement reduces risk of necrotizing enterocolitis and mortality in preterm very low-birth-weight infants: an updated meta-analysis of 20 randomized, controlled trials. J Pediatr Surg 2012, 47(1): 241 -248.
![Study Birth weight or gestation <1500 g Probiotic agents Primary outcome Kitajima H, 1997[30]](http://slidetodoc.com/presentation_image_h/2fc9011860636f214d7b784860f8e63d/image-17.jpg "Study Birth weight or gestation <1500 g Probiotic agents Primary outcome Kitajima H, 1997[30]")
Study Birth weight or gestation <1500 g Probiotic agents Primary outcome Kitajima H, 1997[30] Participants Probiotics Placebo 45 46 Bifidobacteria NEC; sepsis; mortality Jadad score 3 Dani C, 2002 [31] 295 290 <33 wk or <1500 g Lactobacillus NEC; sepsis; mortality 4 Costalos C, 2003[32] 51 36 28 -32 wk Saccharomyces NEC; sepsis 5 Bin-Nun A, 2005[33] 72 73 <1500 g Mixturea NEC; sepsis; mortality 3 Lin HC, 2005 [34] 180 187 <1500 g 4 Manzoni P, 2006[35] 39 41 <1500 g Lactobacillus and NEC; sepsis; mortality bifidobacteria Lactobacillus NEC; sepsis; mortality Mohan R, 2006[36]b 21 17 <34 wk and <1500 g bifidobacteria NEC 4 Stratiki Z, 2007[37]b 38 31 <34 wk and <1500 g bifidobacteria NEC; sepsis; mortality 5 Ke D, 2008 [38] Lin HC, 2008 [39] 98 217 91 217 <32 wk <34 wk and <1500 g 4 5 Huang B, 2009 [40] 95 88 <32 wk and <1500 g bifidobacteria NEC Lactobacillus and NEC; sepsis; mortality bifidobacteria Bifidobacteria NEC Manzoni P, 2009[12] 151 168 <1500 g Lactobacillus NEC; sepsis; mortality 5 Rougé C, 2009 [41] 45 49 <32 wk and <1500 g NEC; sepsis; mortality 5 Samanta M, 2009[42] 92 95 NEC; sepsis; mortality 3 Underwood MA, 2009 [13] 61 29 NEC 5 Di M, 2010 [43] Mihatsch WA, 2010[14] 41 91 35 89 Lactobacillus and bifidobacteria <34 wk and <1500 g Lactobacillus and bifidobacteria <34 wk and 750 -2000 Lactobacillus and g bifidobacteria <32 wk Bifidobacteria <30 wk and <1500 g Bifidobacteria NEC; sepsis; mortality 3 5 Ren B, 2010 [44] 80 70 NEC 3 Braga TD, 2011[15] 119 112 <33 wk and 10001800 g <1500 g 5 Sari FN, 2011 [16] 110 111 <33 wk or <1500 g Lactobacillus and NEC; sepsis; mortality bifidobacteria Lactobacillus NEC; sepsis; mortality Bifidobacteria 4 3 5

Forest plots of probiotics in preterm infants • (A, Effect of probiotics on NEC; B, Effect of probiotics on mortality; C, Effect of probiotics on sepsis).
 group/no. in placebo group) Bifidobacteria")
Subgroup analyses Studies (no. in RR probiotics RR (95%CI) group/no. in placebo group) Bifidobacteria NEC 8 (509/467) Mortality 3 (174/166) Sepsis 3 (174/166) Lactobacillus and Bifidobacteria NEC 6 (714/689) Mortality 5 (653/660) Sepsis 5 (653/660) Lactobacillus NEC 4 (595/610) Mortality 4 (595/610) Sepsis 4 (595/610) PRR I 2 Heterogeneity PHeterogeneity Model 0. 30 (0. 160. 58) 0. 74 (0. 182. 97) 0. 84 (0. 292. 41) . 0003 0 . 64 Fixed . 67 0 . 51 Fixed . 74 0. 21 . 28 Fixed 0. 33 (0. 190. 58) 0. 47 (0. 260. 87) 0. 90 (0. 601. 36) . 0001 0 . 51 Fixed . 02 49 . 09 Random . 62 71 . 007 Random 0. 37 (0. 190. 73) 0. 61 (0. 380. 97) 0. 79 (0. 461. 36) . 004 0 . 40 Fixed . 04 0 . 88 Fixed . 40 71 . 01 Random

Funnel plot to assess publication bias • Analysis of effect of probiotic supplement on NEC risk including 20 studies; TEgger test = − 1. 12; 95% CI, − 1. 82 to 0. 56; PEgger test =. 278 >. 05

Other recent meta-analyses • Deshpande G, Rao S, Patole S, Bulsara M: Updated Meta-analysis of Probiotics for Preventing Necrotizing Enterocolitis in Preterm Neonates. Pediatrics 2010, 125(5): 921 -930. • Al. Faleh, Khalid; Anabrees, Jasim; Bassler, Dirk; Al. Kharfi, Turki: Probiotics for prevention of necrotizing enterocolitis in preterm infants Cochrane Database of Systematic Reviews. Issue 3, 2011.

Trial sequential analysis. Deshpande G et al. Pediatrics 2010; 125: 921 -930 © 2010 by American Academy of Pediatrics

Other RCTs • 2 other RCTS have been recently presented, both examiend the effects of ‘Saccharomyces boulardii’ : no effect. • Rojas MA, Lozano JM, Rojas MX, Rodriguez VA, Rondon MA, Bastidas JA, Perez LA, Rojas C, Ovalle O, Garcia-Harker JE et al: Prophylactic probiotics to prevent death and nosocomial infection in preterm infants. Pediatrics 2012. Multicenter RCT infants <2 kg; primary outcome was survival without nosocomial sepsis (Columbia). NEC 8/372 probiotiques 15/378 contrôle (L reuteri) • 2 others in progress, or just completed, with a total of 2, 400 enfants, – Costeloe angleterre, (PIP) primary outcome is sepsis, NEC or death (justification en partie ‘None of the studies has taken place in the UK’) – Tobin Australie (PROPREMS) primary outcome sepsis.

Pro. Prems • Just finished and presented • Australian RCT of probiotics; a mixture of 2 bifidobacteria (infantis and lactis) and streptococcus thermophilus • 1100 babies randomized <1500 g and <32 wk • 4. 4% NEC grade 2 or more in controls • 2. 0% NEC (grade 2 or more) with probiotics • Slightly fewer serious infections

Meta-analysis Sans Manzoni 2009, sans les études de Saccharomyces

Prospective cohort study CHUSJ • Design/Methods: Starting in July 2011 we have administered a preparation containing a mix of 4 bifidobacteria (b breve, bifidum, infantis and longum) and a lactobacillus rhamnosus (Florababy (tm) holder of a Natural Product Number from Health Canada). • Data on complications has been collected, and compared with the admissions to the NICU during the previous 18 months. • NEC stage 2 or greater was diagnosed by the presence of pneumatosis or other diagnostic findings on an abdominal radiograph, by an attending radiologist.

Prospective cohort study CHUSJ Characteristic Pre-probiotic cohort Probiotic cohort Gestational Age, 28. 9 (2. 2) 29. 0 (2. 1) 1207 (376) 1220 (334) SGA (<10%le) 11. 4% 16% % female 44% 51% weeks. Mean (SD) Birth weight, g. Mean (SD)
 cohort (n=294) NEC 31 (10%) 16 (5%) p<0.")
Outcome Pre-probiotic Probiotic Significance cohort (n=317) cohort (n=294) NEC 31 (10%) 16 (5%) p<0. 05 Mortality 31 (10%) 20 (7%) p=NS NEC or 54 (17%) 31 (11%) p<0. 05 57 (18%) 54 (17%) p=NS Mortality HCAI
")
Logistic Regression Outcome Receipt of GA (per Probiotics additional Being SGA Being Female week) NEC 0. 51 (0. 26, 0. 72 (0. 62, 2. 6* (1. 1, 0. 44** (0. 23, 0. 98)* 0. 83)* 5. 8) 0. 87) 0. 71 (0. 38, 0. 56 (0. 48, 3. 5 (1. 54, 0. 80 (0. 43, 1. 34) 0. 66) * 7. 84)* 1. 5) NEC or 0. 56 (0. 33, 0. 62 (0. 54, 3. 8 (1. 95, 0. 72 (0. 43, mortality 0. 93)** 0. 69)* 7. 30)* 1. 19) HCAI 0. 98 (0. 81, 0. 56 (0. 50, 1. 73 (0. 90, 0. 83 (0. 52, 1. 98) 0. 63)*** 3. 34) 1. 31) Mortality

Lactoferrin • • Protein in milk Identified many decades ago Involved in iron absorption (hence ‘ferrin’) The reason why human milk iron is almost 100% bio-available • Very similar protein structure in cows milk and human milk • None in artificial formulae

Protein composition of milk • Breast fed term infants receive about 100 mg of lactoferrin a day during the period of production colostrum, and rather less afterward. • Very little lactoferrin in cows milk, even less after modification.

The known and postulated iron-transport processes believed to be operating in the neonatal duodenum. Collard K J Pediatrics 2009; 123: 1208 -1216 © 2009 by American Academy of Pediatrics

Lactoferrin w h e y includes lactoferrin, beta-lactoglobulin, alpha lactalbumin glycomacropeptide, and immunoglobulins,
 and bovine LF")
Three dimensional structures of diferric human LF (Farnaud and Evans, 2003) and bovine LF (Moore et al. , 1997). The location of lactoferricin within the protein is shown in yellow and the two ferric ions are in red

Lactoferricin • Lactoferrin is partially hydrolysed in the stomach • Which creates lactoferricin, which has an increased antibacterial activity. • Lactoferrin also seems to promote the growth of probiotic organisms, Bifidobacteria

Lactoferrin Rogan et al. Respiratory Research 2006 7: 29 doi: 10. 1186/1465 -9921 -7 -29
: 19 -29.")
Jenssen H, Hancock REW: Antimicrobial properties of lactoferrin. Biochimie 2009, 91(1): 19 -29.

Legrand D: Lactoferrin, a key molecule in immune and inflammatory processes. Biochem Cell Biol 2012, 90(3): 252 -268

Manzoni P et al: Bovine Lactoferrin Supplementation for Prevention of Late-Onset Sepsis in Very Low-Birth. Weight Neonates: A Randomized Trial. JAMA 2009, 302(13): 1421 -1428. • 472 VLBW infants were randomly assigned to receive orally administered BLF (100 mg/d) alone (n=153), BLF plus Lactobacillus GG (n=151), or placebo (n=168) from birth until day 30 of life (day 45 for neonates <1000 g at birth).

Table 2. Bacterial and Fungal Late-Onset Sepsis, Fungal Colonization, Progression From Colonization to Infection, Mortality in the Study Groups. Manzoni, P. et al. JAMA 2009; 302: 1421 -1428 Copyright restrictions may apply.

Table 3. Multivariable Logistic Regression Analysis Controlling for the Most Important Risk Factors Possibly Associated With Late-Onset Sepsisa. Manzoni, P. et al. JAMA 2009; 302: 1421 -1428 Copyright restrictions may apply.

Table 4. Secondary End Points. Manzoni, P. et al. JAMA 2009; 302: 1421 -1428 Copyright restrictions may apply.
 b. LF (%) Risk Ratio (95% CI) P Death in hospital")
Outcome Placebo (%) b. LF (%) Risk Ratio (95% CI) P Death in hospital after day 3 12/168 (7. 1) 4/153 (2. 6) 0. 37 (0. 12 - 1. 11) 0. 07 Hospital death from late-onset sepsis 8/168 (4. 8) 0/153 (0) NA 0. 008 Late-onset sepsis (bacterial + fungal) 29/168 (17. 3) 9/153 (5. 9) 0. 34 (0. 17 - 0. 70) 0. 002 Late-onset sepsis (bacterial only) 0. 43 (0. 21 - 0. 88) 0. 02 23/168 (13. 7) 9/153 (5. 9) Late-onset sepsis in infants fed only 7/37 (18. 9) breastmilk (not exposed to formula) 1/42 (4. 2) 0. 13 (0. 02 - 0. 98) 0. 02 Necrotising enterocolitis (≥ stage 2)* 14/259 (5. 4) 5/251 (2. 0) 0. 35 (0. 13 - 0. 99) 0. 04** Retinopathy of prematurity (treated) 19/168 (11. 3) 6/153 (3. 9) 0. 35 (0. 12 - 0. 82) 0. 02 Death > day 3 or major morbidity‡‡ 47/168 (28. 0) 22/153 (14. 4) 0. 51 (0. 24 - 0. 75) 0. 002

Manzoni P et al Early Hum Develop 2011 LF Placebo R. R. 95% p NEC>2 nd stage 5/251 2% 14/259 5. 4% 0. 35 0. 13– 0. 99 0. 04 LF+LGG Placebo R. R. 95% p NEC>2 nd stage 1/242 0. 4% 14/259 5. 4% 0. 07 0. 01– 0. 55 0. 001

Lacuna Study • The overall objective of this research program is to determine : P In infants who are born at gestational ages of 23 0/7 to 30 6/7 weeks, I does administration of bovine lactoferrin commencing within the first 48 hours of life, and continuing until 36 weeks post-menstrual age or to hospital discharge if sooner, C compared with control, O increase the probability of survival without a proven HCAI T to discharge from hospital?

LIFT Lactoferrin Infant Feeding Trial • A pragmatic, randomized clinical trial in 1, 500 very low birth weight infants (VLBW: <1, 500 g) • (I) aims to test the hypotheses that adding bovine lactoferrin (b. LF) vs placebo to feeds improves the • Primary composite outcome of all-cause hospital mortality or any of 5 morbidities diagnosed or treated in hospital: • brain injury or chronic lung disease or retinopathy of prematurity (ROP) treated by local guidelines or late onset sepsis or necrotising enterocolitis (NEC);

LIFT • Funded by Australian MRC • About to start

Lactoferrin • A promising intervention for the future, more studies are needed. • 2 large multi-center RCTs are in progress.

Probiotics • Probiotics are proven to reduce NEC and mortality. • The preparation chosen should contain a Bifidobacterium or Lactobacillus Rhamnosus, and probably a mix of the two • Good Quality Control of the preparation is essential • Parents deserve the right to know about probiotics • Further placebo controlled trials are unethical – Other trials comparing preparations and timing are needed

Probiotics • Babies in Canada should be receiving probiotics • We have appropriate preparations • There is no further excuse!

neonatalresearch. org
- Slides: 52