PROBABILITY Vocabulary probability interpret mutually exclusive twoway table

PROBABILITY Vocabulary: probability interpret mutually exclusive two-way table attributes outcomes data Venn diagram relationship values

VOWEL FILL: complete using list words __tc_m_s _nt_rpr_t V_nn d__gr_ms _ttr_b_t_s m_t__lly_xcl_s_v_ tw_-w_y t_bl_ Complete the definitions using list words: interpret To explain or make sense of __________ Information __________ data The study of chance probability __________ Characteristics attributes __________ All the things in the sample space outcomes __________

SPELLING ERRORS… Find the error and rewrite the list word correctly vallues owtcomes interrpret too-way table muchually exclusive probabilitie relasionship Vent diagram

What is probability? • Probability is all about chance. • What is the chance of something happening? • For example: the weather report gives us a percentage chance that it will rain today. • We can give a probability as a word or as a number • The number can be written as a percentage, decimal or fraction

• An event that is certain to happen is said to have a probability of 1 or 100% • An event that is impossible is said to have a probability of 0 or 0% • Any event in between impossible and certain have a probability in between 0 and 1 or between 0% and 100%. • An even chance is 0. 5 or 50%

Some definitions in probability Outcome – everything which can be a result of an event Sample Space – a list of all possible outcomes Exhaustive Event: Events that cover all possible outcomes Example: Rolling a number between 1 and 6 on a die This means rolling a 1, 2, 3, 4, 5 or 6. The sample space is {1, 2, 3, 4, 5, 6} so an exhaustive event is the same as the sample space

Writing Sample Spaces The Sample Space is the list of possible outcomes for a trial. Example: Rolling a die we can get any one of the numbers one to six. We write the sample space as {1, 2, 3, 4, 5, 6} Example: Tossing a coin we can either get a head or a tail. We write the sample space as {H, T}

Workbook

Probability of an Event Occurring •

Workbook

Workbook

Workbook

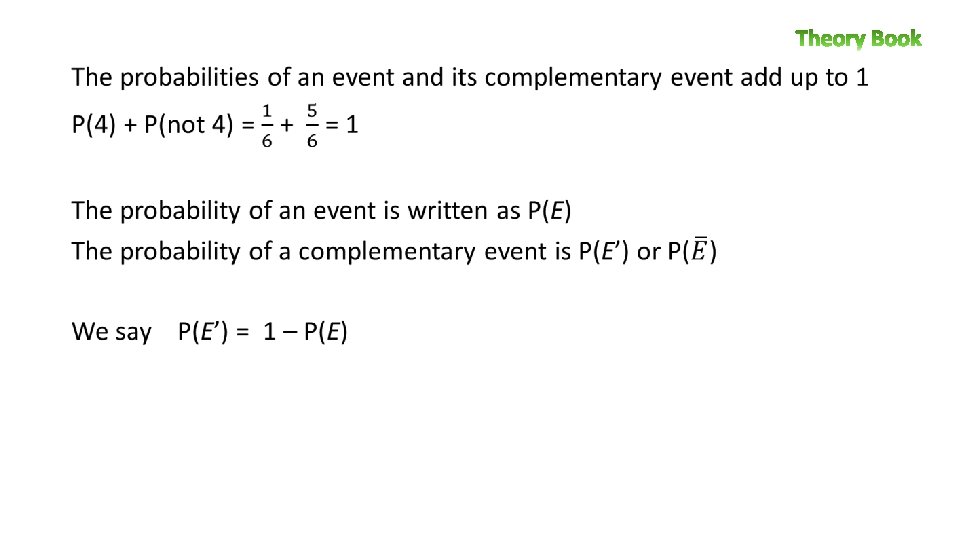
Complementary Events •

Workbook

Compound Events Compound events are two or more events happening at the same time. Example: Rolling a 6 on a die and getting a tail on a coin. Calculating the probabilities associated with the two events is best done using a tree diagram or a table.

Tree Diagrams Tree diagrams are used to list the sample space for experiments with two or more steps, and can make it easier to work out answers. The outcomes for each stage of the experiment are listed vertically and each stage is connected with branches. The tree below shows the possible outcomes when two coins are tossed. 1. What is the chance of getting 2 heads? 2. What is the chance of getting 2 tails? 3. What is the chance of getting a head and a tail?

Workbook

Workbook

Mutually Exclusive Events If one outcome can happen, then the other can’t; like ‘rolling an even number on a die’ and ‘rolling an odd number on a die’. Nothing can be BOTH of these.

Workbook

Workbook
 we can show")
Two way tables When we have two variables (things that change) we can show the options in a two way table and then calculate the probabilities of different events.

Workbook

Workbook

Workbook

Workbook
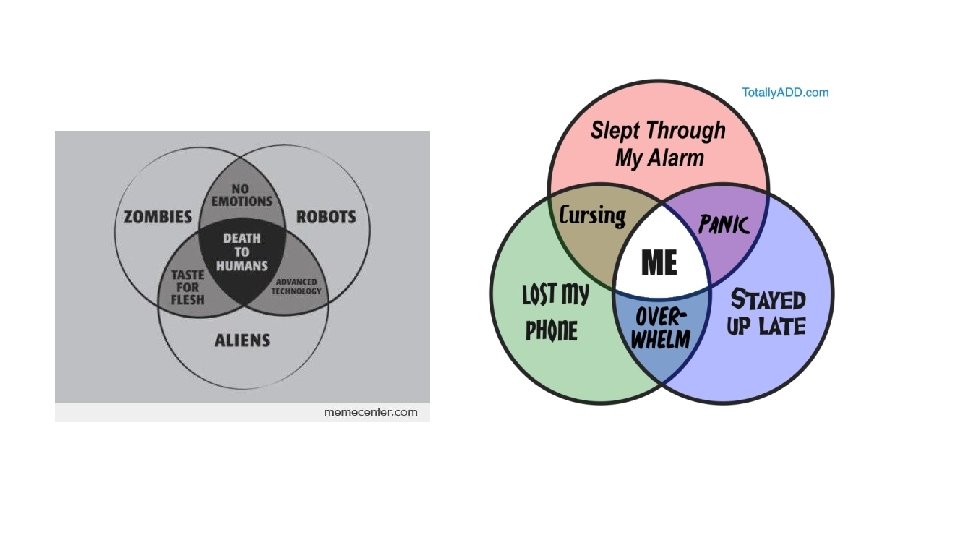

Venn Diagrams A Venn diagram is two or more circles that cross over for a section. We use Venn diagrams to show data points or people/items that fit into the categories for each circle If an item or person fits into more than one category they are placed in the overlap of the circles.
 is sometimes called the")
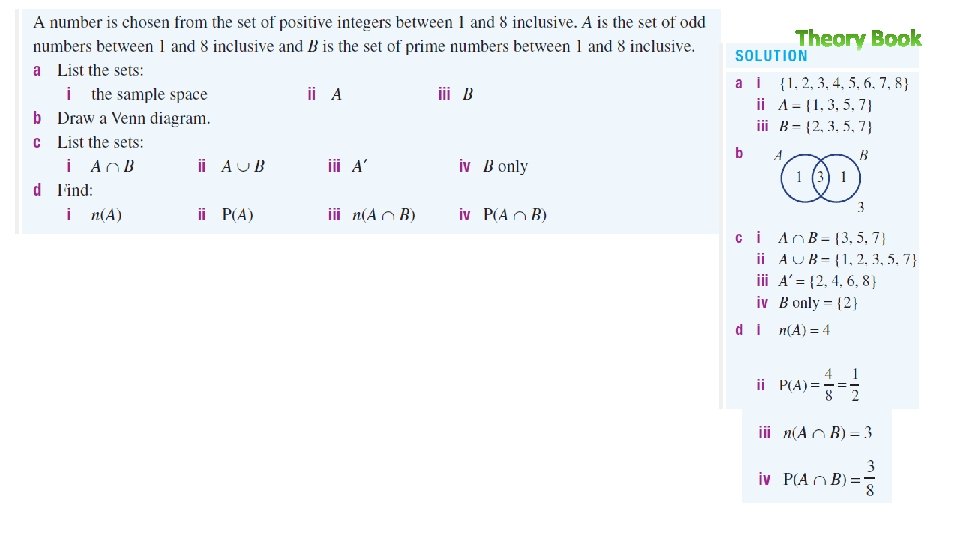
Set Notation: The sample space (list of all possible outcomes) is sometimes called the universal set and is given the symbol S, Ω, U or ξ. A is a particular subset (⊂) of the sample space if all the elements in A are contained in the sample space. For example, A is the set of prime numbers less than or equal to 10, which is a subset of all the integers less than or equal to 10. A′ is the complement of A and contains the elements not in A. 5 ∈ A means that 5 is an element of A (or is in set A). ∅ is the null or empty set and contains no elements. ∴ ∅ = { } n(A) is the cardinal number of A and means the number of elements in A. n(A) = 4

A Venn diagram can be used to illustrate how different subsets in the sample space are grouped. For example: A = {2, 3, 5, 7} B = {1, 3, 5, 7, 9} A ∩ B means A and B, which means the intersection of A and B and includes the elements in common with both sets. ∴ A ∩ B = {3, 5, 7} A ∪ B means A or B, which means the union of A and B and includes the elements in either A or B or both. ∴ A ∪ B = {1, 2, 3, 5, 7, 9} A only is the elements in A but not in B. ∴ A only = {2}

Workbook

Workbook

Workbook

Workbook

Workbook

Workbook

Workbook

Workbook

Workbook

Workbook

Workbook

Relationships: Information can be recorded both using a Venn diagram and a two-way table:

Workbook

Workbook

Workbook Extension…

Workbook Extension…

Workbook Extension…

Workbook Extension…

Workbook Extension…
- Slides: 51