Probability TwoWay Tables Worksheet A The worksheet is

Probability – Two-Way Tables – Worksheet A The worksheet is in 2 sizes.

Printing To print handouts from slides Select the slide from the left. Then click: File > Print > ‘Print Current Slide’ To print multiple slides Click on a section title to highlight all those slides, or press ‘Ctrl’ at the same time as selecting slides to highlight more than one. Then click: File > Print > ‘Print Selection’ To print double-sided handouts Highlight both slides before using ‘Print Selection’. Choose ‘Print on Both Sides’ and ‘Flip on Short Edge’.
 After school on Tuesday, 14 Year 9 s played")
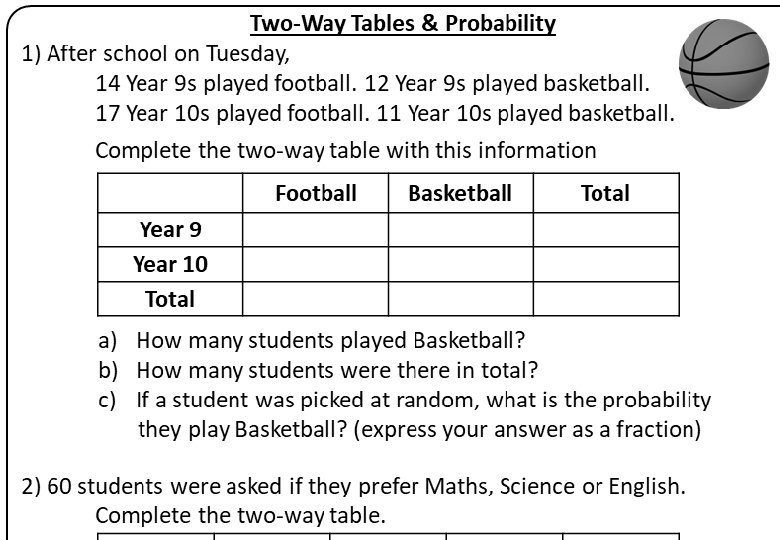
Two-Way Tables & Probability 1) After school on Tuesday, 14 Year 9 s played football. 12 Year 9 s played basketball. 17 Year 10 s played football. 11 Year 10 s played basketball. Complete the two-way table with this information. Football Basketball Total Year 9 Year 10 Total 4) 100 mixed Year 7, 8 & 9 students were asked how they got to school. For Year 7 s: 12 walked, 9 cycled, 7 took a bus and 2 took a car. For the 30 Year 8 s: 5 walked, 11 cycled & 9 took a bus 15 of the Year 9 students cycled to school. In total, 33 students walked and 22 took the bus. Complete a two-way table with this information. a) How many students played Basketball? b) How many students were there in total? c) If a student was picked at random, what is the probability they play Basketball? (express your answer as a fraction) 2) 60 students were asked if they prefer Maths, Science or English. Complete the two-way table. Maths Science Year 7 12 8 Year 8 11 English Total 10 35 a) If a student was picked at random, what is: P(They prefer Maths)? b) If we picked only from Year 7 s, what is: P(They prefer English)? 3) 40 adults & 50 children people were asked how they prefer to keep fit. Complete the two-way table. Running Gym Sport N/A Adults 17 10 4 Children 6 21 Total 37 a) From everyone, what is P(They prefer to play sport)? b) From only those that prefer going to the gym, what is P(Adult)? a) What is P(Cycled and are in Year 9)? b) What is P(Year 7 and walked)? c) Of those that took a car, what is P(Year 7)? 5) Children under 13, Teenagers, Adults & Pensioners were asked how much money they spend a day on snacks. 0 -99 p Child (<13) £ 2+ 4 Teenager 4 Adult 5 Pensioner Total £ 1 -1. 99 14 14 8 2 5 4 22 Total 11 50 a) Find P(A person who spends £ 2 or more a day) b) Find P(A teenager who spends more than £ 1 per day) c) From those older than 12, P(A person who spends less than £ 2 per day)
 After school on Tuesday, 14 Year 9 s played")
Two-Way Tables & Probability 1) After school on Tuesday, 14 Year 9 s played football. 12 Year 9 s played basketball. 17 Year 10 s played football. 11 Year 10 s played basketball. Complete the two-way table with this information. Year 9 Year 10 Total Football 14 17 31 Basketball 12 11 23 Total 26 28 54 4) 100 mixed Year 7, 8 & 9 students were asked how they got to school. For Year 7 s: 12 walked, 9 cycled, 7 took a bus and 2 took a car. For the 30 Year 8 s: 5 walked, 11 cycled & 9 took a bus 15 of the Year 9 students cycled to school. In total, 33 students walked and 22 took the bus. Complete a two-way table with this information. a) How many students played Basketball? b) How many students were there in total? c) If a student was picked at random, what is the probability they play Basketball? (express your answer as a fraction) 2) 60 students were asked if they prefer Maths, Science or English. Complete the two-way table. Maths Science English Total Year 7 12 8 5 25 Year 8 11 14 10 35 Total 23 22 15 60 a) If a student was picked at random, what is: P(They prefer Maths)? b) If we picked only from Year 7 s, what is: P(They prefer English)? 3) 40 adults & 50 children people were asked how they prefer to keep fit. Complete the two-way table. Running Gym Sport N/A Total Adults 17 10 9 4 40 Children 20 6 21 3 50 Total 37 16 30 7 90 a) From everyone, what is P(They prefer to play sport)? b) From only those that prefer going to the gym, what is P(Adult)? a) What is P(Cycled and are in Year 9)? b) What is P(Year 7 and walked)? c) Of those that took a car, what is P(Year 7)? 5) Children under 13, Teenagers, Adults & Pensioners were asked how much money they spend a day on snacks. 0 -99 p Child (<13) £ 2+ 4 Teenager 4 Adult 5 Pensioner Total £ 1 -1. 99 14 14 8 2 5 4 22 Total 11 50 a) Find P(A person who spends £ 2 or more a day) b) Find P(A teenager who spends more than £ 1 per day) c) From those older than 12, P(A person who spends less than £ 2 per day)
 After school on Tuesday, 14 Year 9 s played")
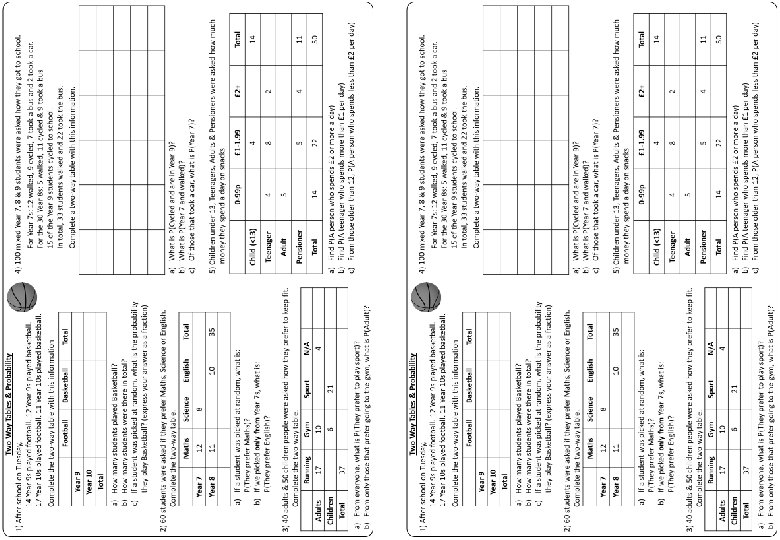
Two-Way Tables & Probability 1) After school on Tuesday, 14 Year 9 s played football. 12 Year 9 s played basketball. 17 Year 10 s played football. 11 Year 10 s played basketball. Complete the two-way table with this information. Year 9 Year 10 Total Football 14 17 31 Basketball 12 11 23 Total 26 28 54 a) How many students played Basketball? b) How many students were there in total? c) If a student was picked at random, what is the probability they play Basketball? (express your answer as a fraction) 2) 60 students were asked if they prefer Maths, Science or English. Complete the two-way table. Maths Science English Total Year 7 12 8 5 25 Year 8 11 14 10 35 Total 23 22 15 60 a) If a student was picked at random, what is: P(They prefer Maths)? b) If we picked only from Year 7 s, what is: P(They prefer English)? 3) 40 adults & 50 children people were asked how they prefer to keep fit. Complete the two-way table. Running Gym Sport N/A Total Adults 17 10 9 4 40 Children 20 6 21 3 50 Total 37 16 30 7 90 a) From everyone, what is P(They prefer to play sport)? b) From only those that prefer going to the gym, what is P(Adult)? 4) 100 mixed Year 7, 8 & 9 students were asked how they got to school. For Year 7 s: 12 walked, 9 cycled, 7 took a bus and 2 took a car. For the 30 Year 8 s: 5 walked, 11 cycled & 9 took a bus 15 of the Year 9 students cycled to school. In total, 33 students walked and 22 took the bus. Complete a two-way table with this information. Walk Cycle Bus Car Total Year 7 12 9 7 2 30 Year 8 5 11 9 5 30 Year 9 16 15 6 3 40 Total 33 35 22 10 100 a) What is P(Cycled and are in Year 9)? b) What is P(Year 7 and walked)? c) Of those that took a car, what is P(Year 7)? 5) Children under 13, Teenagers, Adults & Pensioners were asked how much money they spend a day on snacks. 0 -99 p £ 1 -1. 99 £ 2+ Total Child (<13) 3 4 7 14 Teenager 4 8 2 14 Adult 5 5 1 11 Pensioner 2 5 4 11 Total 14 22 14 50 a) Find P(A person who spends £ 2 or more a day) b) Find P(A teenager who spends more than £ 1 per day) c) From those older than 12, P(A person who spends less than £ 2 per day)
 After school on Tuesday, 14 Year 9 s played")
Two-Way Tables & Probability 1) After school on Tuesday, 14 Year 9 s played football. 12 Year 9 s played basketball. 17 Year 10 s played football. 11 Year 10 s played basketball. Complete the two-way table with this information Football Basketball Total Year 9 Year 10 Total 4) 100 mixed Year 7, 8 & 9 students were asked how they got to school. For Year 7 s: 12 walked, 9 cycled, 7 took a bus and 2 took a car. For the 30 Year 8 s: 5 walked, 11 cycled & 9 took a bus 15 of the Year 9 students cycled to school. In total, 33 students walked and 22 took the bus. Complete a two-way table with this information. a) How many students played Basketball? b) How many students were there in total? c) If a student was picked at random, what is the probability they play Basketball? (express your answer as a fraction) 2) 60 students were asked if they prefer Maths, Science or English. Complete the two-way table. Maths Science Year 7 12 8 Year 8 11 English Total 10 35 a) If a student was picked at random, what is: P(They prefer Maths)? b) If we picked only from Year 7 s, what is: P(They prefer English)? 3) 40 adults & 50 children people were asked how they prefer to keep fit. Complete the two-way table. Running Gym Sport N/A Adults 17 10 4 Children 6 21 Total 37 a) From everyone, what is P(They prefer to play sport)? b) From only those that prefer going to the gym, what is P(Adult)? a) What is P(Cycled and are in Year 9)? b) What is P(Year 7 and walked)? c) Of those that took a car, what is P(Year 7)? 5) Children under 13, Teenagers, Adults & Pensioners were asked how much money they spend a day on snacks 0 -99 p Child (<13) £ 2+ 4 Teenager 4 Adult 5 Pensioner Total £ 1 -1. 99 14 14 8 2 5 4 22 Total 11 50 a) Find P(A person who spends £ 2 or more a day) b) Find P(A teenager who spends more than £ 1 per day) c) From those older than 12, P(A person who spends less than £ 2 per day)

Questions? Comments? Suggestions? …or have you found a mistake!? Any feedback would be appreciated . Please feel free to email: tom@goteachmaths. co. uk
- Slides: 9