Probability TwoWay Tables Demonstration This resource provides animated

Probability – Two-Way Tables – Demonstration This resource provides animated demonstrations of the mathematical method. Check animations and delete slides not needed for your class.

You work for a video game company. You survey gamers about their nationality (English, French, German) and their gaming platform (console, mobile, PC). 3 English gamers said console. 7 English gamers said mobile. 5 English gamers said PC. 1 French gamer said console. 6 French gamers said mobile. 5 French gamers said PC. 12 German gamers said console. 3 German gamers said mobile. 8 German gamers said PC. You select a gamer at random, what is the probability they are English and play on console? In France , what is the probability a gamer plays on PC? Why is this analysis useful to us?

We can use a two-way table to link two variables. Console Mobile PC Total English 3 7 5 15 French 1 6 5 12 German 12 3 8 23 Total 16 16 18 50 You select a gamer at random, what is the probability they are English and play on console? In France , what is the probability a gamer plays on PC? Why is this analysis useful to us? Market Analysis: Support, Future-planning

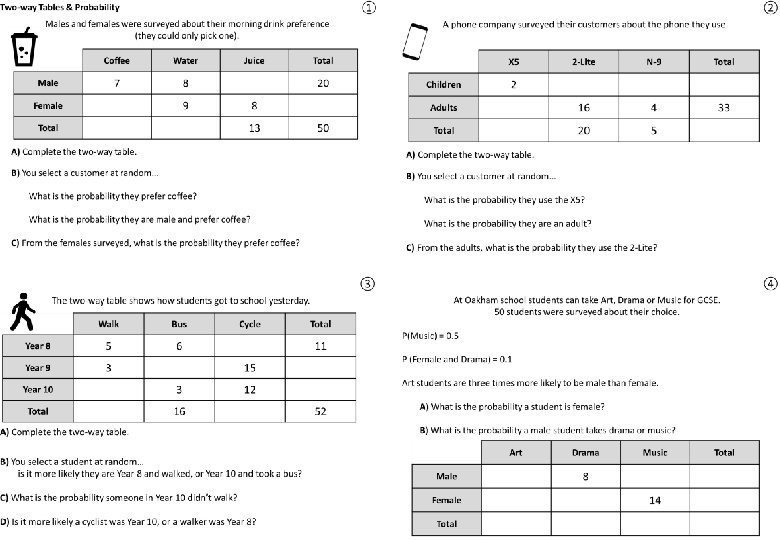
① Two-way Tables & Probability Males and females were surveyed about their morning drink preference (they could only pick one). Coffee Water Juice Total Male 7 8 5 20 Female 13 9 8 30 Total 20 17 13 50 A) Complete the two-way table. B) You select a customer at random… What is the probability they prefer coffee? What is the probability they are male and prefer coffee? C) From the females surveyed, what is the probability they prefer coffee?

② Two-way Tables & Probability A phone company surveyed their customers about the phone they use. X 5 2 -Lite N-9 Total Children 2 4 1 7 Adults 13 16 4 33 Total 15 20 5 40 A) Complete the two-way table. B) You select a customer at random… What is the probability they use the X 5? What is the probability they are an adult? C) From the adults, what is the probability they use the 2 -Lite?

③ Two-way Tables & Probability The two-way table shows how students got to school yesterday. Walk Bus Cycle Total Year 8 5 6 0 11 Year 9 3 7 15 25 Year 10 1 3 12 16 Total 9 16 27 52 A) Complete the two-way table. B) You select a student at random… is it more likely they are Year 8 and walked, or Year 10 and took a bus? C) What is the probability someone in Year 10 didn’t walk? D) Is it more likely a cyclist was Year 10, or a walker was Year 8?

④ Two-way Tables & Probability At Oakham school students can take Art, Drama or Music for GCSE. 50 students were surveyed about their choice. P(Music) = 0. 5 P (Female and Drama) = 0. 1 Art students are three times more likely to be male than female. A) What is the probability a student is female? B) What is the probability a male student takes drama or music? Art Drama Music Total Male 9 8 11 28 Female 3 5 14 22 Total 12 13 25 50

Questions? Comments? Suggestions? …or have you found a mistake!? Any feedback would be appreciated . Please feel free to email: tom@goteachmaths. co. uk
- Slides: 10