Probability Tree Diagram Experiment Select 2 Red 4

“Probability”
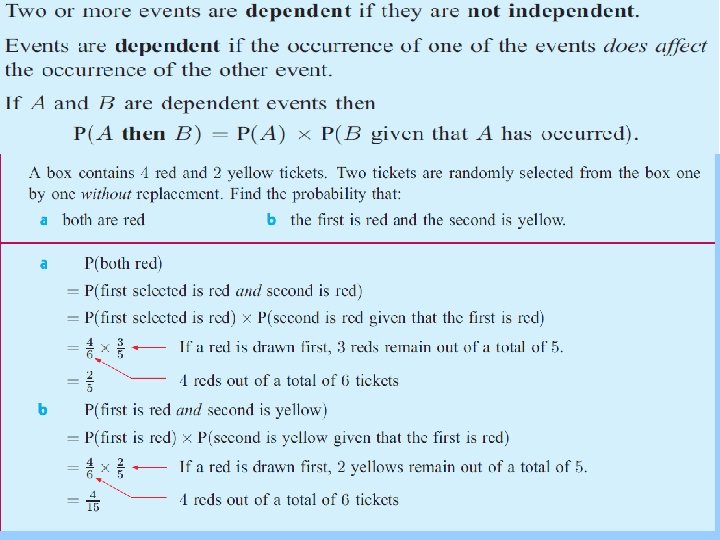

Tree Diagram Experiment: Select 2 Red 4 Yellow Tickets without replacement. Dependent ! 2/6 4/6 R Y 1/5 4/5 3/5 R Y P(both are Red)=(2/6)(1/5) =1/15 P(First is Red & Second is yellow)=(2/6)(4/5) =4/15 P(First is Yellow & Second is Red)=(4/6)(4/5) =16/30 P(Both red)=(4/6)(3/5) =12/30

Tree Diagram Experiment: Select 2 Red 4 Yellow Tickets with replacement. Dependent ! 2/6 4/6 R Y 1/5 4/5 3/5 R Y P(both are Red)=(2/6)(1/5) =1/15 P(First is Red & Second is yellow)=(2/6)(4/5) =4/15 P(First is Yellow & Second is Red)=(4/6)(4/5) =16/30 P(Both red)=(4/6)(3/5) =12/30

Dependent ! 7/10 3/10 R G 6/9 3/9 7/9 2/9 R G P(both are Red)=(7/10)(6/9) =7/15 P(First is Red & Second is Green)=(7/10)(3/9) =7/30 P(First is Green & Second is Red)=(3/10)(7/9) =7/30 P(Both Green)=(3/10)(2/9) =1/15

Tree Diagram Experiment: Select 2 pens from 20 pens: 14 blue & 6 red. Don’t replace. 6/20 14/20 R B Dependent ! 5/19 14/19 6/19 13/19 R B P(R R)=(6/20)(5/19) =3/38 P(R B)=(6/20)(14/19) =21/95 P(B R)=(14/20)(6/19) =21/95 P(B B)=(14/20)(13/19) =91/190

Practice Problems A card is drawn from a deck of 10 cards numbered 1 through 10 and a number cube is rolled. Find the probability of each below. 1. P(10 and 3) 2. P(two even numbers) 3. P(two numbers less than 4) 7

Practice Problems There are 4 red, 6 green, and 5 yellow pencils in a jar. Once a pencil is selected, it is not replaced. Find the probability of each below. 4. P(red then yellow) 5. P(two green) 6. P(green then yellow) 7. P(red then green) 8

Definitions Probability is the mathematics of chance. It tells us the relative frequency with which we can expect an event to occur The greater the probability the more likely the event will occur. It can be written as a fraction, decimal, percent, or ratio.

Definitions 1 Certain . 5 50/50 Probability is the numerical measure of the likelihood that the event will occur. Value is between 0 and 1. Sum of the probabilities of all events is 1. 0 Impossible

Definitions A probability experiment is an action through which specific results (counts, measurements, or responses) are obtained. The result of a single trial in a probability experiment is an outcome. The set of all possible outcomes of a probability experiment is the sample space, denoted as S. e. g. All 6 faces of a die: S = { 1 , 2 , 3 , 4 , 5 , 6 }

Definitions Other Examples of Sample Spaces may include: Lists Tables Grids Venn Diagrams Tree Diagrams May use a combination of these Where appropriate always display your sample space

Definitions An event consists of one or more outcomes and is a subset of the sample space. Events are often represented by uppercase letters, such as A, B, or C. Notation: The probability that event E will occur is written P(E) and is read “the probability of event E. ”
 = Number of Event Outcomes")
Definitions • The Probability of an Event, E: P(E) = Number of Event Outcomes Total Number of Possible Outcomes in S Consider a pair of Dice • Each of the Outcomes in the Sample Space are random and equally likely to occur. e. g. P( ) = (There are 2 ways to get one 6 and the other 4)

Definitions There are three types of probability 1. Theoretical Probability Theoretical probability is used when each outcome in a sample space is equally likely to occur. P(E) = Number of Event Outcomes Total Number of Possible Outcomes in S The Ultimate probability formula

Definitions There are three types of probability 2. Experimental Probability Experimental probability is based upon observations obtained from probability experiments. P(E) = Number of Event Occurrences Total Number of Observations The experimental probability of an event E is the relative frequency of event E

Definitions There are three types of probability 3. Subjective Probability Subjective probability is a probability measure resulting from intuition, educated guesses, and estimates. Therefore, there is no formula to calculate it. Usually found by consulting an expert.

Definitions Law of Large Numbers. As an experiment is repeated over and over, the experimental probability of an event approaches theoretical probability of the event. The greater the number of trials the more likely the experimental probability of an event will equal its theoretical probability.

Complimentary Events The complement of event E is the set of all outcomes in a sample space that are not included in event E. The complement of event E is denoted by Properties of Probability:

Sample Space and Events Sample space: The collection of all possible outcomes for an experiment. Event: A collection of outcomes for the experiment, that is, any subset of the sample space.

Sample space for rolling a die once

Possible outcomes for rolling a pair of dice

A deck of playing cards

The event the king of hearts is selected 1/52

The event a king is selected 1/13 = 4/52

The event a heart is selected 1/4 = 13/52

The event a face card is selected 3/13=13/52

The event a heart is selected 1/4 = 13/52

The event the king of hearts is selected 1/52

Ex 6. 1 Pg 268 – 277 Q 3 to 5, *Q 6, 10

Probabilities of Combined events • Dependent and Independent Events A compound event is made up of one or more separate events. To find the probability of a compound event, you need to know if the events are independent or dependent. Events are independent events if the occurrence of one event does not affect the probability of the other. Events are dependent events if the occurrence of one does affect the probability of the other.

Example 1: Classifying Events as Independent or Dependent • Determine if the events are dependent or independent. • A. getting tails on a coin toss and rolling a 6 on a number cube Tossing a coin does not affect rolling a number cube, so the two events are independent. • B. getting 2 red gumballs out of a gumball machine After getting one red gumball out of a gumball machine, the chances for getting the second red gumball have changed, so the two events are dependent.

Independent and Dependent Events Example: Finding the Probability of Independent Events Three separate boxes each have one blue marble and one green marble. One marble is chosen from each box. What is the probability of choosing a blue marble from each box? The outcome of each choice does not affect the outcome of the other choices, so the choices are independent. 1 In each box, P(blue) =. 2 1 1 P(blue, blue) = = = 0. 125 Multiply. · · 2 2 2 8 Course 3

Independent and Dependent Events To calculate the probability of two dependent events occurring, do the following: 1. Calculate the probability of the first event. 2. Calculate the probability that the second event would occur if the first event had already occurred. 3. Multiply the probabilities. Course 3

Independent and Dependent Events Example : Find the Probability of Dependent Events The letters in the word dependent are placed in a box. If two letters are chosen at random, what is the probability that they will both be consonants? Because the first letter is not replaced, the sample space is different for the second letter, so the events are dependent. Find the probability that the first letter chosen is a consonant. P(first consonant) = Course 3 6 = 2 9 3

Independent and Dependent Events Example Continued If the first letter chosen was a consonant, now there would be 5 consonants and a total of 8 letters left in the box. Find the probability that the second letter chosen is a consonant. 5 P(second consonant) = 8 5 2 · 5 = 12 3 8 Multiply. The probability of choosing two letters that are both consonants is. 5 12 Course 3

Probability Tree Diagrams The probability of a complex event can be found using a probability tree diagram. 1. Draw the appropriate tree diagram. 2. Assign probabilities to each branch. (Each section sums to 1. ) 3. Multiply the probabilities along individual branches to find the probability of the outcome at the end of each branch. 4. Add the probabilities of the relevant outcomes, depending on the event.

Ex 6. 2 Q 9

Q 10
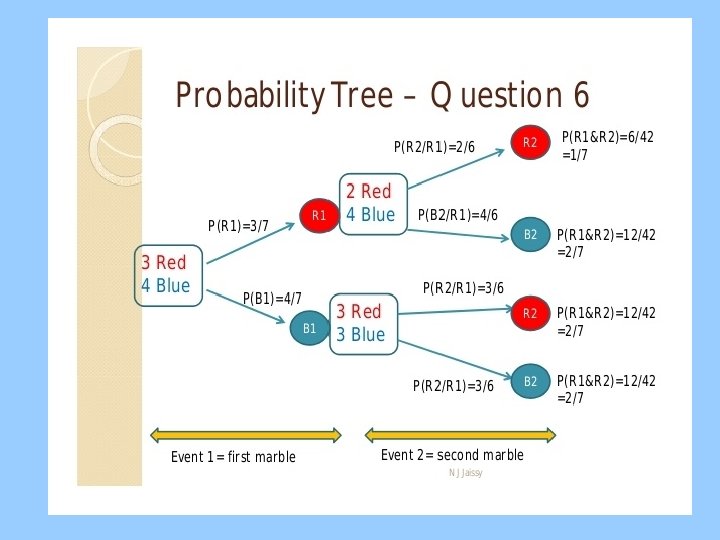

Figure 3. 1 Tree diagram for the cointossing experiment

Example: What is the probability of randomly drawing either an ace or a heart from a deck of 52 playing cards? Note that you can not use our original version of the addition rule here since the events are not disjoint. (It is possible for the card to be both an Ace and a Heart).

Venn diagram for event E
: The event that “E does not occur. ” (A")
Relationships Among Events (not E): The event that “E does not occur. ” (A & B): The event that “both A and B occur. ” (A or B): The event that “either A or B or both occur. ”
 where E is the probability of drawing a face card. 40/52=10/13")
Event (not E) where E is the probability of drawing a face card. 40/52=10/13

An event and its complement
 = 1 – P (~ E).")
The Complementation Rule For any event E, P(E) = 1 – P (~ E). In words, the probability that an event occurs equals 1 minus the probability that it does not occur.

Combinations of Events The Addition Rule – “Or” • The special addition rule (mutually exclusive events) • The general addition rule (non-mutually exclusive events) The Multiplication Rule – “And” • The special multiplication rule (for independent events) • The general multiplication rule (for non-independent events)
 event (not E ) (b) event (A & B) (c)")
Venn diagrams for (a) event (not E ) (b) event (A & B) (c) event (A or B)
 1/13 X 1/4 = 1/52")
Event (B & C) 1/13 X 1/4 = 1/52
 16/52 = 4/52 + 13/52 -1/52")
Event (B or C) 16/52 = 4/52 + 13/52 -1/52
 3/52 = 3/13 X 1/4")
Event (C & D) 3/52 = 3/13 X 1/4

Mutually Exclusive Events Two or more events are said to be mutually exclusive if at most one of them can occur when the experiment is performed, that is, if no two of them have outcomes in common

Two mutually exclusive events
 Two mutually exclusive events (b) Two non-mutually exclusive events")
(a) Two mutually exclusive events (b) Two non-mutually exclusive events
 Three mutually exclusive events (b) Three non-mutually exclusive events (c) Three non -mutually")
(a) Three mutually exclusive events (b) Three non-mutually exclusive events (c) Three non -mutually exclusive events

The Special Addition Rule If event A and event B are mutually exclusive, then More generally, if events A, B, C, … are mutually exclusive, then That is, for mutually exclusive events, the probability that at least one of the events occurs is equal to the sum of the individual probabilities.

Non-mutually exclusive events

The General Addition Rule If A and B are any two events, then P(A or B) = P(A) + P(B) – P(A & B). In words, for any two events, the probability that one or the other occurs equals the sum of the individual probabilities less the probability that both occur.
: Spade or Face Card P (spade) + P (face card) –")
P(A or B): Spade or Face Card P (spade) + P (face card) – P (spade & face card) = 1/4 + 3/13 – 3/52 = 22/52

Example: What is the probability of randomly drawing either an Ace or a 7 from a deck of 52 playing cards? • P(Card is an Ace) 4/52 • P(Card is a 7) 4/52 • P(Card is an Ace AND a 7) 0 P(Draw an Ace OR Draw a 7) ? = P(Ace) + P(7) – P(Ace and 7) = 4/52 + 4/52 – 0/52) = 8/52 P(A or B) = P(A) + P(B) – P

Why do we call it the “general” addition rule? • Because it applies to ANY addition events. You can use it for BOTH disjoint events and non-disjoint events! • Why does it also work for disjoint events? – Recall that if 2 events are disjoint, this means that the two events are mutually exclusive. In other words, if 1 event is true, the other must be false. – Therefore, P(A and B), i. e. the probability of both events being true will always equal 0. So: P(A or B) = P(A) + P(B) - P(A and B) However, if the events are disjoint, then P(A and B) is 0, Therefore: P(A or B) = P(A) + P(B) - 0 (i. e. This is our addition rule for disjoint events) Here is an example of applying the general rule to a disjoint event…

Example: What is the probability of randomly drawing either an Ace or a 7 from a deck of 52 playing cards? • P(Card is an Ace) 4/52 • P(Card is a 7) 4/52 • P(Card is an Ace AND a 7) P(A or B) = P(A) + P(B) – 0 P(Draw an Ace OR Draw a 7) ? = P(Ace) + P(7) – P(Ace and 7) = 4/52 + 4/52 – 0/52) = 8/52
 = P(A) +")
Example: What is the probability of randomly drawing P(A or B) = P(A) + P(B) – P(A and B) either an Ace or a 7 from a deck of 52 playing cards? • P(Card is an Ace) 4/52 • P(Card is a 7) 4/52 • P(Card is an Ace AND a 7) 0 P(Draw an Ace OR Draw a 7) ? = P(Ace) + P(7) – P(Ace and 7) = 4/52 + 4/52 – 0/52) = 8/52

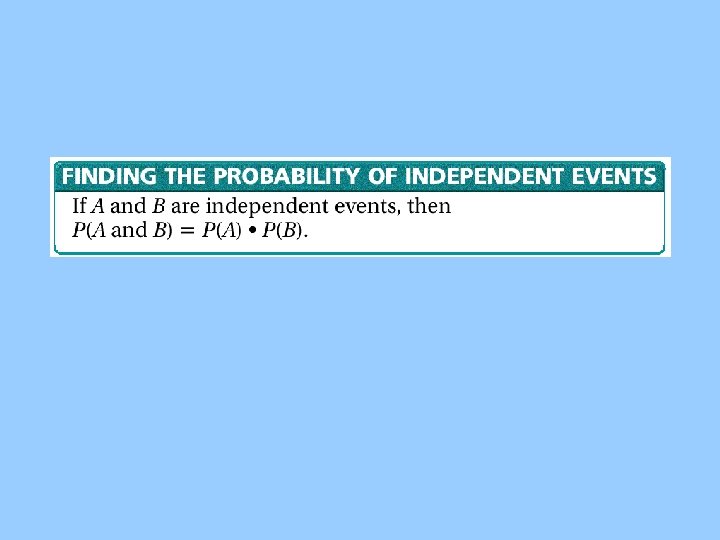
The Multiplication Rule If events A and B are independent, then the probability of two events, A and B occurring in a sequence (or simultaneously) is: This rule can extend to any number of independent events. Two events are independent if the occurrence of the first event does not affect the probability of the occurrence of the second event. More on this later

Mutually Exclusive Two events A and B are mutually exclusive if and only if: In a Venn diagram this means that event A is disjoint from event B. A and B are M. E. A and B are not M. E.

The Addition Rule The probability that at least one of the events A or B will occur, P(A or B), is given by: If events A and B are mutually exclusive, then the addition rule is simplified to: This simplified rule can be extended to any number of mutually exclusive events.

Conditional Probability Conditional probability is the probability of an event occurring, given that another event has already occurred. Conditional probability restricts the sample space. The conditional probability of event B occurring, given that event A has occurred, is denoted by P(B|A) and is read as “probability of B, given A. ” We use conditional probability when two events occurring in sequence are not independent. In other words, the fact that the first event (event A) has occurred affects the probability that the second event (event B) will occur.

Conditional Probability Formula for Conditional Probability Better off to use your brain and work out conditional probabilities from looking at the sample space, otherwise use the formula.

Conditional Probability e. g. There are 2 red and 3 blue counters in a bag and, without looking, we take out one counter and do not replace it. The probability of a 2 nd counter taken from the bag being red depends on whether the 1 st was red or blue. Conditional probability problems can be solved by considering the individual possibilities or by using a table, a Venn diagram, a tree diagram or a formula. Harder problems are best solved by using a formula together with a tree diagram.

e. g. 1. The following table gives data on the type of car, grouped by petrol consumption, owned by 100 people. Low Medium High Male 12 33 7 Female 23 21 4 Total 100 One person is selected at random. L is the event “the person owns a low rated car”

e. g. 1. The following table gives data on the type of car, grouped by petrol consumption, owned by 100 people. Low Medium High Male 12 33 7 Female 23 21 4 Total 100 One person is selected at random. L is the event “the person owns a low rated car” F is the event “a female is chosen”.

e. g. 1. The following table gives data on the type of car, grouped by petrol consumption, owned by 100 people. Low Medium High Male 12 33 7 Female 23 21 4 Total 100 One person is selected at random. L is the event “the person owns a low rated car” F is the event “a female is chosen”.

e. g. 1. The following table gives data on the type of car, grouped by petrol consumption, owned by 100 people. Low Medium High Male 12 33 7 Female 23 21 4 Total 100 One person is selected at random. L is the event “the person owns a low rated car” F is the event “a female is chosen”. Find (i) P(L) (ii) P(F L) (iii) P(F L) There is no need for a Venn diagram or a formula to solve this type of problem. We just need to be careful which row or column we look at.
 P(L) = Low 12 23 35 (ii) P(F L)")
Solution: Male Female Find (i) P(L) = Low 12 23 35 (ii) P(F L) Medium 33 21 High 7 4 Total 100 (iii) P(F L) (Best to leave the answers as fractions)

Solution: Male Female Low 12 23 Medium 33 21 High 7 4 Total 100 Find (i) P(L) (ii) P(F L) (iii) P(F L) (i) P(L) = (ii) P(F L) = The probability of selecting a female with a low rated car.
 P(L) = (ii) P(F L) = (iii) P(F L)")
Solution: Male Female Find (i) P(L) = (ii) P(F L) = (iii) P(F L) = Low 12 23 35 (ii) P(F L) Medium 33 21 High 7 4 Total 100 (iii) P(F L) The sample space is restricted from 100 to 35. We be careful with thea The must probability of selecting denominators in (ii) Here female given the carand is (iii). low rated. we are given the car is low rated. We want the total of that column.

Solution: Male Female Low 12 23 Medium 33 21 High 7 4 Total 100 Find (i) P(L) = (ii) P(F L) = (iii) P(F L) = (ii) P(F L) (iii) P(F L) Notice that P(L) P(F L) = P(F L) So, P(F L) = P(F|L) P(L)

e. g. 2. I have 2 packets of seeds. One contains 20 seeds and although they look the same, 8 will give red flowers and 12 blue. The 2 nd packet has 25 seeds of which 15 will be red and 10 blue. Draw a Venn diagram and use it to illustrate the conditional probability formula. Solution: Let R be the event “ Red flower ” and F be the event “ First packet ” F R Red in the 1 st packet

e. g. 2. I have 2 packets of seeds. One contains 20 seeds and although they look the same, 8 will give red flowers and 12 blue. The 2 nd packet has 25 seeds of which 15 will be red and 10 blue. Draw a Venn diagram and use it to illustrate the conditional probability formula. Solution: Let R be the event “ Red flower ” and F be the event “ First packet ” R F 8 Red in the 1 st packet

e. g. 2. I have 2 packets of seeds. One contains 20 seeds and although they look the same, 8 will give red flowers and 12 blue. The 2 nd packet has 25 seeds of which 15 will be red and 10 blue. Draw a Venn diagram and use it to illustrate the conditional probability formula. Solution: Let R be the event “ Red flower ” and F be the event “ First packet ” R F 8 Blue in the 1 st packet

e. g. 2. I have 2 packets of seeds. One contains 20 seeds and although they look the same, 8 will give red flowers and 12 blue. The 2 nd packet has 25 seeds of which 15 will be red and 10 blue. Draw a Venn diagram and use it to illustrate the conditional probability formula. Solution: Let R be the event “ Red flower ” and F be the event “ First packet ” R F 12 8 Blue in the 1 st packet

e. g. 2. I have 2 packets of seeds. One contains 20 seeds and although they look the same, 8 will give red flowers and 12 blue. The 2 nd packet has 25 seeds of which 15 will be red and 10 blue. Draw a Venn diagram and use it to illustrate the conditional probability formula. Solution: Let R be the event “ Red flower ” and F be the event “ First packet ” R F 12 8 Red in the 2 nd packet

e. g. 2. I have 2 packets of seeds. One contains 20 seeds and although they look the same, 8 will give red flowers and 12 blue. The 2 nd packet has 25 seeds of which 15 will be red and 10 blue. Draw a Venn diagram and use it to illustrate the conditional probability formula. Solution: Let R be the event “ Red flower ” and F be the event “ First packet ” R F 12 8 15 Red in the 2 nd packet

e. g. 2. I have 2 packets of seeds. One contains 20 seeds and although they look the same, 8 will give red flowers and 12 blue. The 2 nd packet has 25 seeds of which 15 will be red and 10 blue. Draw a Venn diagram and use it to illustrate the conditional probability formula. Solution: Let R be the event “ Red flower ” and F be the event “ First packet ” R F 12 8 15 Blue in the 2 nd packet

e. g. 2. I have 2 packets of seeds. One contains 20 seeds and although they look the same, 8 will give red flowers and 12 blue. The 2 nd packet has 25 seeds of which 15 will be red and 10 blue. Draw a Venn diagram and use it to illustrate the conditional probability formula. Solution: Let R be the event “ Red flower ” and F be the event “ First packet ” R F 12 8 15 10 Blue in the 2 nd packet

e. g. 2. I have 2 packets of seeds. One contains 20 seeds and although they look the same, 8 will give red flowers and 12 blue. The 2 nd packet has 25 seeds of which 15 will be red and 10 blue. Draw a Venn diagram and use it to illustrate the conditional probability formula. Solution: Let R be the event “ Red flower ” and F be the event “ First packet ” R F 12 Total: 20 + 25 8 15 10

e. g. 2. I have 2 packets of seeds. One contains 20 seeds and although they look the same, 8 will give red flowers and 12 blue. The 2 nd packet has 25 seeds of which 15 will be red and 10 blue. Draw a Venn diagram and use it to illustrate the conditional probability formula. Solution: Let R be the event “ Red flower ” and F be the event “ First packet ” 45 R F 12 Total: 20 + 25 8 15 10

e. g. 2. I have 2 packets of seeds. One contains 20 seeds and although they look the same, 8 will give red flowers and 12 blue. The 2 nd packet has 25 seeds of which 15 will be red and 10 blue. Draw a Venn diagram and use it to illustrate the conditional probability formula. Solution: Let R be the event “ Red flower ” and F be the event “ First packet ” 45 R F 12 8 15 10

e. g. 2. I have 2 packets of seeds. One contains 20 seeds and although they look the same, 8 will give red flowers and 12 blue. The 2 nd packet has 25 seeds of which 15 will be red and 10 blue. Draw a Venn diagram and use it to illustrate the conditional probability formula. Solution: Let R be the event “ Red flower ” and F be the event “ First packet ” P(R F) = 45 R F 12 8 15 10

e. g. 2. I have 2 packets of seeds. One contains 20 seeds and although they look the same, 8 will give red flowers and 12 blue. The 2 nd packet has 25 seeds of which 15 will be red and 10 blue. Draw a Venn diagram and use it to illustrate the conditional probability formula. Solution: Let R be the event “ Red flower ” and F be the event “ First packet ” P(R F) = 45 R F 12 8 15 10

e. g. 2. I have 2 packets of seeds. One contains 20 seeds and although they look the same, 8 will give red flowers and 12 blue. The 2 nd packet has 25 seeds of which 15 will be red and 10 blue. Draw a Venn diagram and use it to illustrate the conditional probability formula. Solution: Let R be the event “ Red flower ” and F be the event “ First packet ” P(R F) = 45 R F 12 8 15 10

e. g. 2. I have 2 packets of seeds. One contains 20 seeds and although they look the same, 8 will give red flowers and 12 blue. The 2 nd packet has 25 seeds of which 15 will be red and 10 blue. Draw a Venn diagram and use it to illustrate the conditional probability formula. Solution: Let R be the event “ Red flower ” and F be the event “ First packet ” P(R F) = P(R F) = 45 R F 12 8 15 10

e. g. 2. I have 2 packets of seeds. One contains 20 seeds and although they look the same, 8 will give red flowers and 12 blue. The 2 nd packet has 25 seeds of which 15 will be red and 10 blue. Draw a Venn diagram and use it to illustrate the conditional probability formula. Solution: Let R be the event “ Red flower ” and F be the event “ First packet ” 45 P(R F) = P(R F) = P(F) = R F 12 8 15 10

e. g. 2. I have 2 packets of seeds. One contains 20 seeds and although they look the same, 8 will give red flowers and 12 blue. The 2 nd packet has 25 seeds of which 15 will be red and 10 blue. Draw a Venn diagram and use it to illustrate the conditional probability formula. Solution: Let R be the event “ Red flower ” and F be the event “ First packet ” 45 P(R F) = P(R F) = P(F) = R F 12 8 15 10

e. g. 2. I have 2 packets of seeds. One contains 20 seeds and although they look the same, 8 will give red flowers and 12 blue. The 2 nd packet has 25 seeds of which 15 will be red and 10 blue. Draw a Venn diagram and use it to illustrate the conditional probability formula. Solution: Let R be the event “ Red flower ” and F be the event “ First packet ” 45 P(R F) = P(R F) = P(F) = R F 12 8 15 10

e. g. 2. I have 2 packets of seeds. One contains 20 seeds and although they look the same, 8 will give red flowers and 12 blue. The 2 nd packet has 25 seeds of which 15 will be red and 10 blue. Draw a Venn diagram and use it to illustrate the conditional probability formula. Solution: Let R be the event “ Red flower ” and F be the event “ First packet ” 45 P(R F) = P(R F) = P(F) = R F 12 P(R F) P(F) = So, P(R F) = P(R|F) P(F) 8 15 10

e. g. 3. In November, the probability of a man getting to work on time if there is fog on the M 6 is If the visibility is good, the probability is . . The probability of fog at the time he travels is . (a) Calculate the probability of him arriving on time. (b) Calculate the probability that there was fog given that he arrives on time. There are lots of clues in the question to tell us we are dealing with conditional probability.

e. g. 3. In November, the probability of a man getting to work on time if there is fog on the M 6 is If the visibility is good, the probability is . . The probability of fog at the time he travels is . (a) Calculate the probability of him arriving on time. (b) Calculate the probability that there was fog given that he arrives on time. There are lots of clues in the question to tell us we are dealing with conditional probability. Solution: Let T be the event “ getting to work on time ” Let F be the event “ fog on the M 6 ” Can you write down the notation for the probabilities that we want to find in (a) and (b)?
 Calculate the probability of him arriving on time. P(T) (b) Calculate the probability")
(a) Calculate the probability of him arriving on time. P(T) (b) Calculate the probability that there was fog given that he arrives on time. P(F T) Can you also write down the notation for the three probabilities given in the question? “ the probability of a man getting to work on time if there is fog is ” P(T F) “ If the visibility is good, the probability is Not foggy ”. P(T F/) “ The probability of fog at the time he travels is ”. P(F) This is a much harder problem so we draw a tree diagram.
 P(T F/) F Fog / FNo Fog Each section sums to 1")
P(T F) P(T F/) F Fog / FNo Fog Each section sums to 1 P(F) On T time Not on / T time On T time Not on T/ time
 P(T F/) P(F) T F T/ F/ T T/ Because we only")
P(T F) P(T F/) P(F) T F T/ F/ T T/ Because we only reach the 2 nd set of branches after the 1 st set has occurred, the 2 nd set must represent conditional probabilities.
 Calculate the probability of him arriving on time. T F T/ F/ T")
(a) Calculate the probability of him arriving on time. T F T/ F/ T T/
 Calculate the probability of him arriving on time. T F F/ ( foggy")
(a) Calculate the probability of him arriving on time. T F F/ ( foggy and he / T arrives on time ) T T/
 Calculate the probability of him arriving on time. T F T/ F/ T")
(a) Calculate the probability of him arriving on time. T F T/ F/ T ( not foggy and he T/ arrives on time )
 Calculate the probability that there was fog given that he arrives on time.")
(b) Calculate the probability that there was fog given that he arrives on time. We need Fog on M 6 Getting to work T F From part (a),

Eg 4. The probability of a maximum temperature of 28 or more on the 1 st day of Wimbledon ( tennis competition! ) has been estimated as . The probability of a particular Aussie player winning on the 1 st day if it is below 28 is estimated to be but otherwise only . Draw a tree diagram and use it to help solve the following: (i) the probability of the player winning, (ii) the probability that, if the player has won, it was at least 28. Solution: Let T be the event “ temperature 28 or more ” Let W be the event “ player wins ” Then,

Let T be the event “ temperature 28 or more ” Let W be the event “ player wins ” Then, Wins W High T temp W/ Loses W Wins Lower / T temp / W Loses Sum =1
 W/")
W T W/ W T/ (i) W/
 W/")
W T W/ W T/ (i) W/
 W/")
W T W/ W T/ (ii) W/
 W/")
W T W/ W T/ (ii) W/
 W/")
W T W/ W T/ (ii) W/

Independent Events We can deduce an important result from the conditional law of probability: If B has no effect on A, then, P(A B) = P(A) and we say the events are independent. ( The probability of A does not depend on B. ) So, P(A|B) = P(A B) P (B ) becomes or P (A ) = P (A B ) = P (A ) P (B )
 = P (A ) P")
Independent Events Tests for independence P (A B ) = P (A ) P (B A ) = P (B ) or P (A B ) = P (A ) P (B )

Expected Value Suppose that the outcomes of an experiment are real numbers called and suppose that these outcomes have probabilities respectively. Then the expected value of x, E(x), of the experiment is:

Expected Value Example At a raffle, 1500 tickets are sold at $2 each for four prizes of $500, $250, $150, and $75. What is the expected value of your gain if you play? Gain P(x) $498 $248 $148 $73 -$2

Odds When one speaks about the odds in favour of an event, they are actually stating the number of favourable outcomes of an event to the number of unfavourable outcomes of the event, assuming that the outcomes are equally likely. The odds in favour of event E are: n(E) P(E): P(E) The odds against event E are n(E): n(E) P(E): P(E) If the odds in favour of E are a: b, then

“Probability”
- Slides: 122