
Probability The Foundation of Inferential Statistics October 14
Probability: The Foundation of Inferential Statistics October 14, 2009
Subjective Probability • Throughout the course I have used the word probability. – Yet I have not defined it. Instead I have relied on the assumption that you all have a sense of probability. – The book calls this sense of probability “subjective probability”.
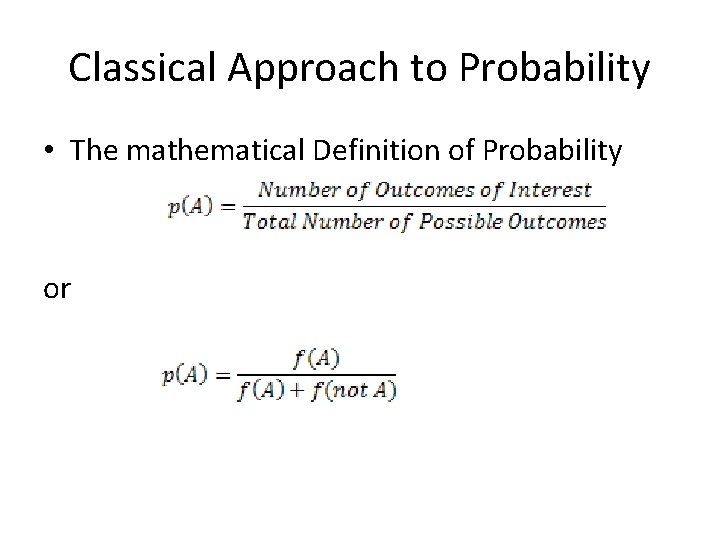
Classical Approach to Probability • The mathematical Definition of Probability or
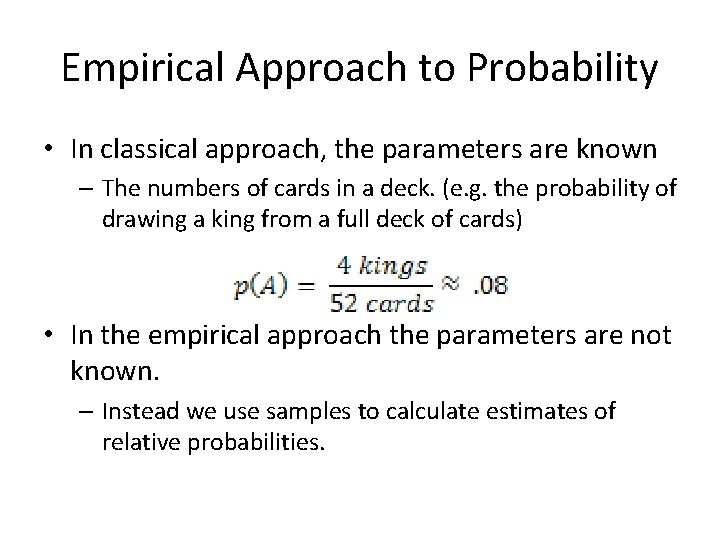
Empirical Approach to Probability • In classical approach, the parameters are known – The numbers of cards in a deck. (e. g. the probability of drawing a king from a full deck of cards) • In the empirical approach the parameters are not known. – Instead we use samples to calculate estimates of relative probabilities.
Foundations of Empirical Probability • Discrete vs. Continuous Variables – Discrete- a variable that is represented in whole numbers. • Decimals don’t make sense – Continuous- a variable where intermediate or fractional values are valid. • Sample Space – All possible outcomes that can occur • In Mendelian genetics, dominant recessive allele Aa located at one locus may have the following sample space: AA, aa, Aa. • If Hardy-Weinberg Equilibrium is not violated the relative frequencies in the population should be: • f(AA)= 1, p=. 25 • f(Aa)= 2, p=. 5 • f(aa)=1, p=. 25
Mutually vs. Nonmutually Exclusive Events • Mutually Exclusive – Events in our sample that cannot occur together or overlap. • Nonmutually exclusive events – Events in our sample that can occur together. – A joint probability is the degree in which a set of events do occur together in a sample.

Calculating Probability • Probability can be expressed – in a percentage or relative frequency in 100. – As a decimal. • p=. 5 is the same as, 50% chance, is the same as saying 50 in one hundred. • The addition rule: p(A or B) – It is used when we want to calculate the probability of selecting an element that has one or more conditions.
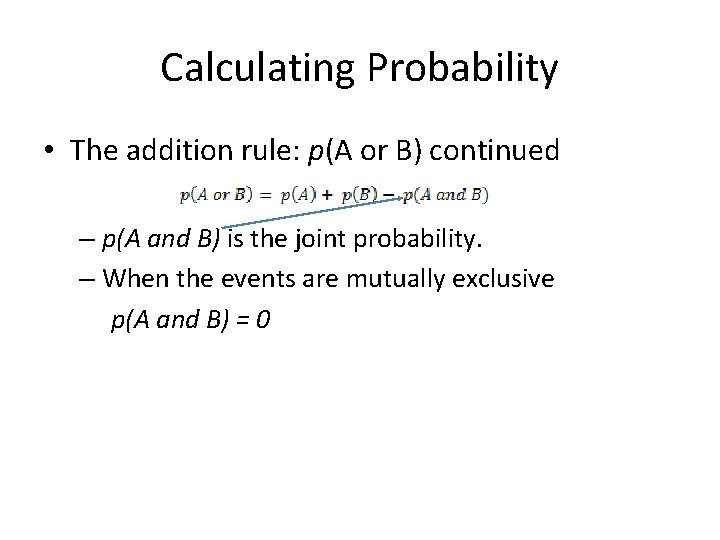
Calculating Probability • The addition rule: p(A or B) continued – p(A and B) is the joint probability. – When the events are mutually exclusive p(A and B) = 0
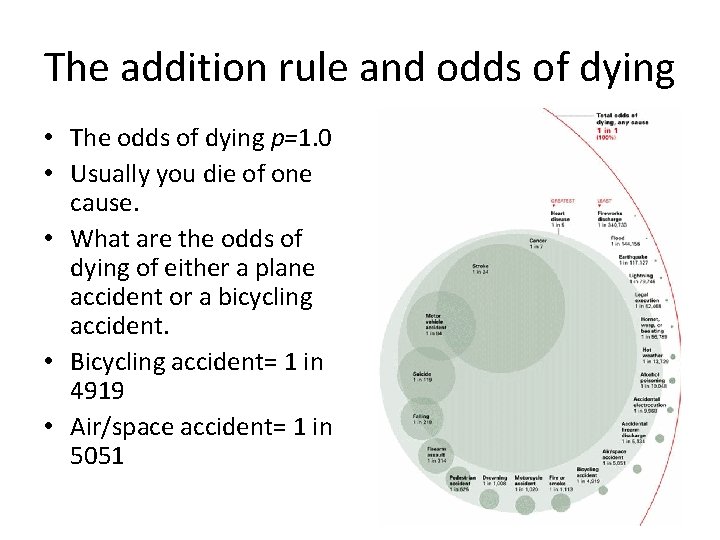
The addition rule and odds of dying • The odds of dying p=1. 0 • Usually you die of one cause. • What are the odds of dying of either a plane accident or a bicycling accident. • Bicycling accident= 1 in 4919 • Air/space accident= 1 in 5051
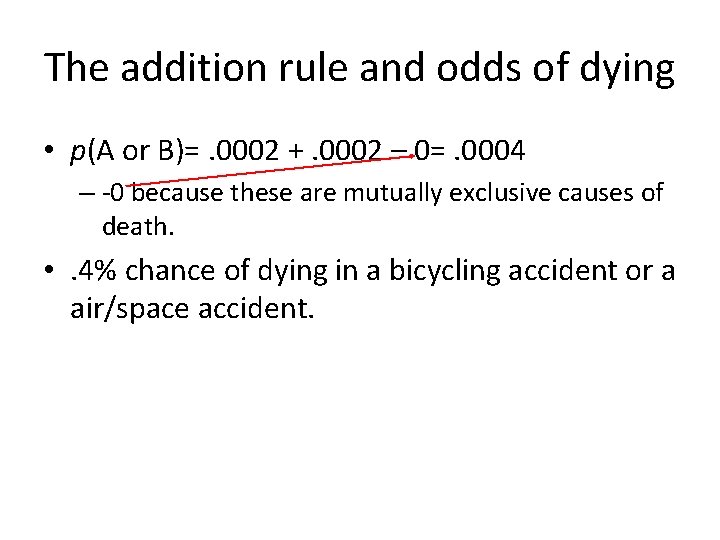
The addition rule and odds of dying • p(A or B)=. 0002 +. 0002 – 0=. 0004 – -0 because these are mutually exclusive causes of death. • . 4% chance of dying in a bicycling accident or a air/space accident.

Multiplication Rule for Independent Events: p(A) x p(B) • Used to determine the probability of two or more events occurring at the same time that are mutually exclusive. • Example: You want to know what the odds are that you will win the lottery. You have to match all five numbers. The choices range from 1: 40. • The probability for choosing the first number is 1 in 40, the second number 1 in 39, third number 1 in 38…
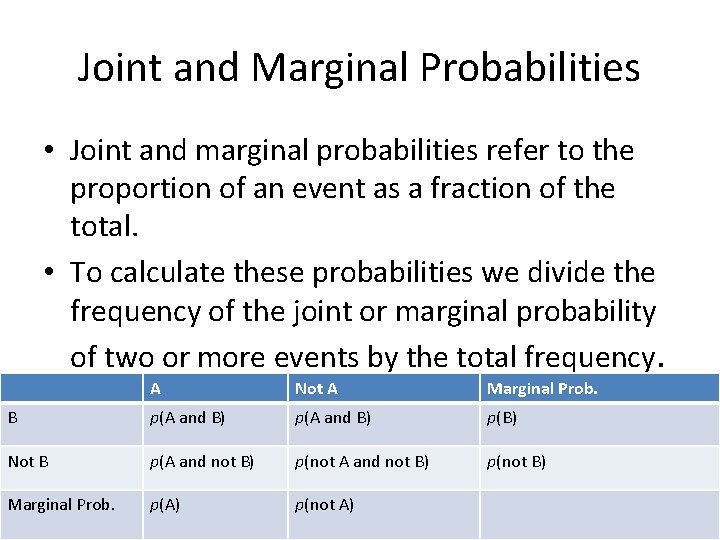
Joint and Marginal Probabilities • Joint and marginal probabilities refer to the proportion of an event as a fraction of the total. • To calculate these probabilities we divide the frequency of the joint or marginal probability of two or more events by the total frequency. A Not A Marginal Prob. B p(A and B) p(B) Not B p(A and not B) p(not B) Marginal Prob. p(A) p(not A)
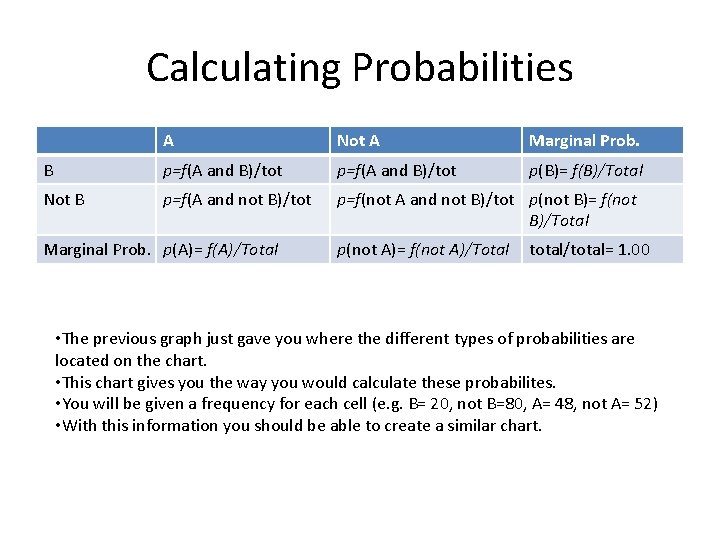
Calculating Probabilities A Not A Marginal Prob. B p=f(A and B)/tot p(B)= f(B)/Total Not B p=f(A and not B)/tot p=f(not A and not B)/tot p(not B)= f(not B)/Total Marginal Prob. p(A)= f(A)/Total p(not A)= f(not A)/Total total/total= 1. 00 • The previous graph just gave you where the different types of probabilities are located on the chart. • This chart gives you the way you would calculate these probabilites. • You will be given a frequency for each cell (e. g. B= 20, not B=80, A= 48, not A= 52) • With this information you should be able to create a similar chart.
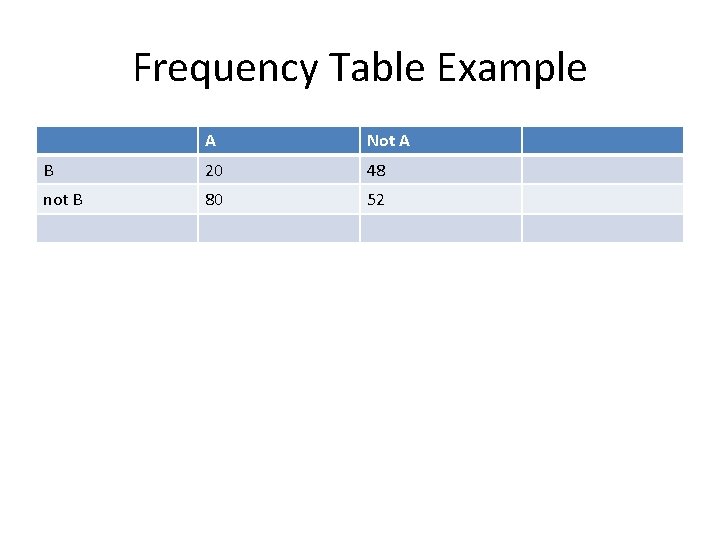
Frequency Table Example A Not A B 20 48 not B 80 52
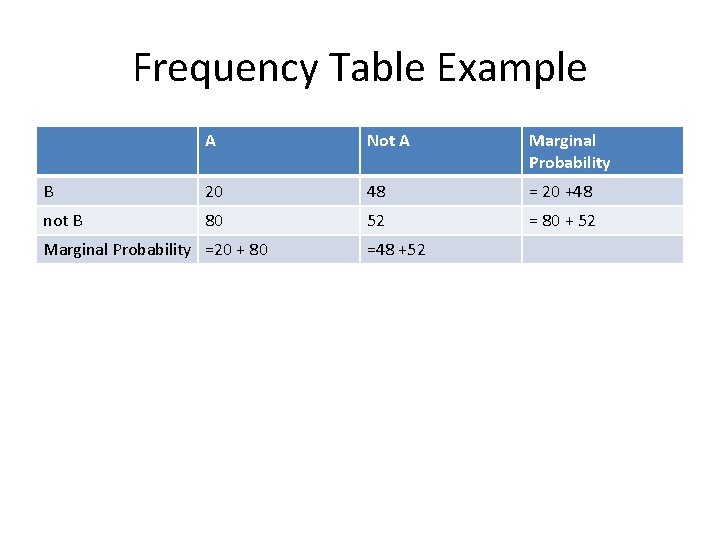
Frequency Table Example A Not A Marginal Probability B 20 48 = 20 +48 not B 80 52 = 80 + 52 Marginal Probability =20 + 80 =48 +52
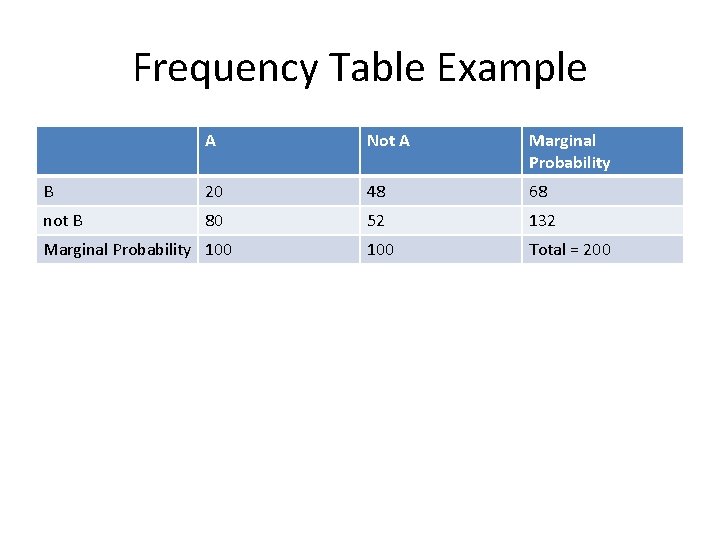
Frequency Table Example A Not A Marginal Probability B 20 48 68 not B 80 52 132 100 Total = 200 Marginal Probability 100

Calculating Probabilities A Not A Marginal Prob. B p=20/200 p=48/200 p(B)= 68/200 Not B p=80/200 p=52/200 p(not B)=132/200 100/200 200/200= 1. 00 Marginal Prob. 100/200
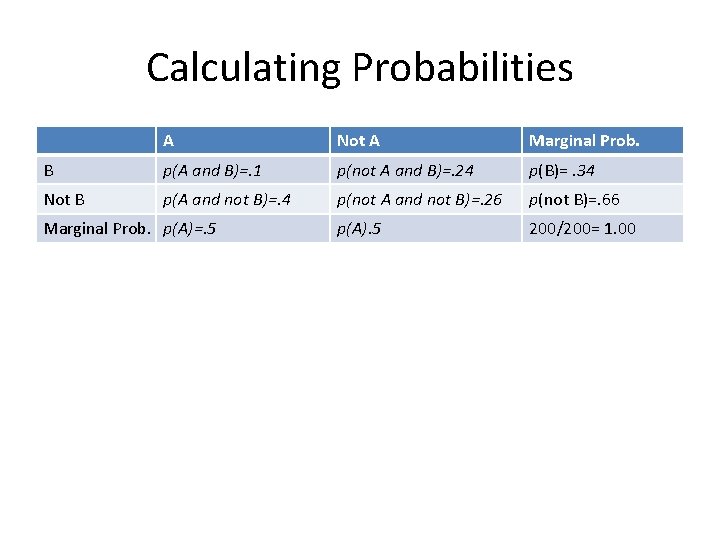
Calculating Probabilities A Not A Marginal Prob. B p(A and B)=. 1 p(not A and B)=. 24 p(B)=. 34 Not B p(A and not B)=. 4 p(not A and not B)=. 26 p(not B)=. 66 p(A). 5 200/200= 1. 00 Marginal Prob. p(A)=. 5
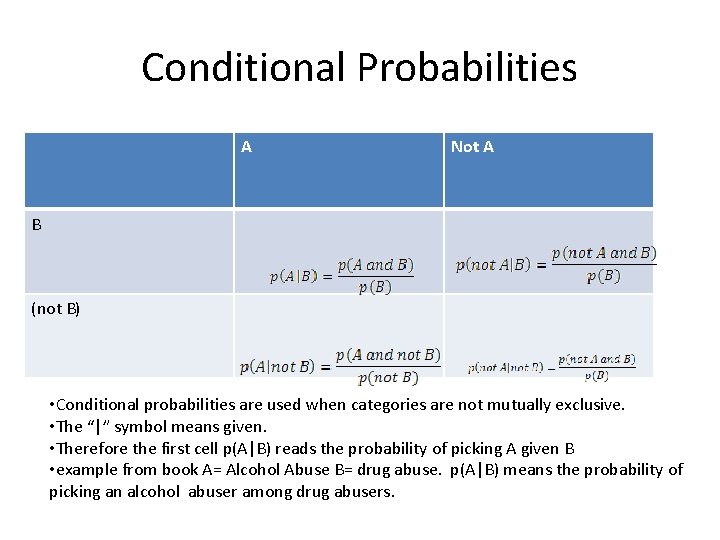
Conditional Probabilities A Not A B (not B) • Conditional probabilities are used when categories are not mutually exclusive. • The “|” symbol means given. • Therefore the first cell p(A|B) reads the probability of picking A given B • example from book A= Alcohol Abuse B= drug abuse. p(A|B) means the probability of picking an alcohol abuser among drug abusers.
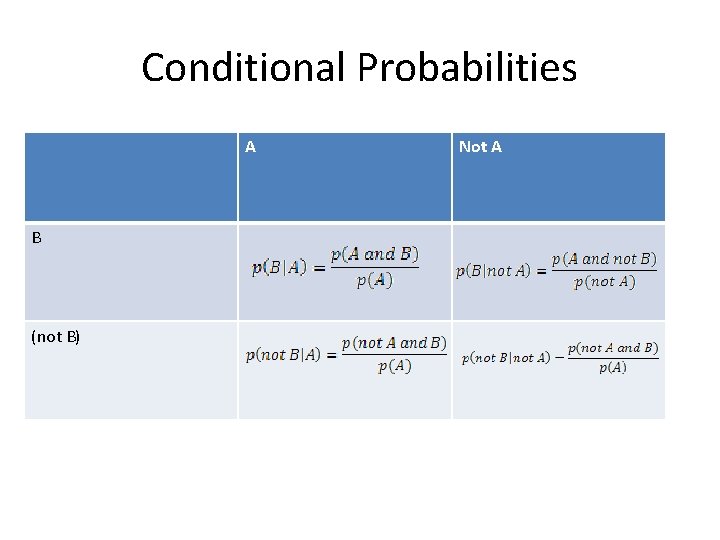
Conditional Probabilities A B (not B) Not A

p(B|A)≠p(A|B) A Not A Marginal Prob. B p(A |B)=. 1/. 34 p(not A |B)=. 24/. 34 p(B)=. 34 Not B p(A |not B)=. 4/. 66 p(not A |not B)=. 26/. 66 Marginal Prob. p(B)=. 5 p(not B)=. 66 p(A). 5 200/200= 1. 00 A Not A Marginal Prob. B p(B |A)=. 1/. 5 p(B |not A)=. 24/. 5 p(B)=. 34 Not B p(not B |A)=. 4/. 5 p(not B |not A)=. 26/. 5 p(not B)=. 66 p(A). 5 200/200= 1. 00 Marginal Prob. p(B)=. 5

p(B|A)≠p(A|B) A Not A Marginal Prob. B p(A |B)=. 294 p(not A |B)=. 706 p(B)=. 34 Not B p(A |not B)=. 606 p(not A |not B)=. 394 p(not B)=. 66 p(A). 5 200/200= 1. 00 A Not A Marginal Prob. B p(B |A)=. 2 p(B |not A)=. 48 p(B)=. 34 Not B p(not B |A)=. 8 p(not B |not A)=. 52 p(not B)=. 66 p(A). 5 200/200= 1. 00 Marginal Prob. p(B)=. 5
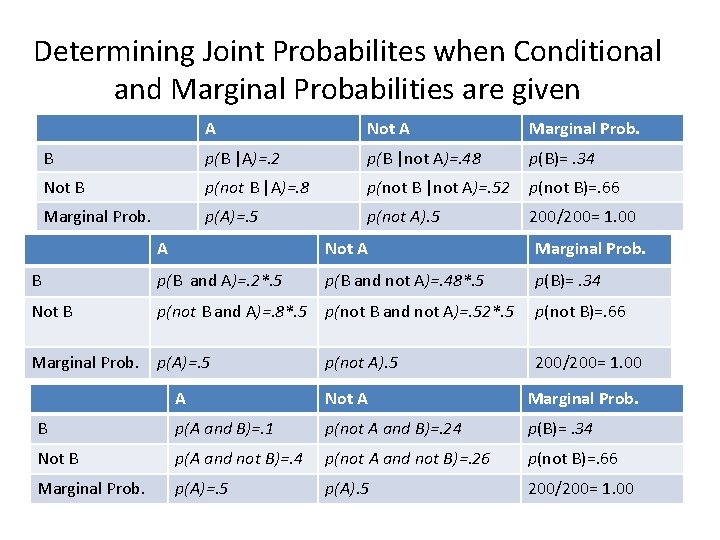
Determining Joint Probabilites when Conditional and Marginal Probabilities are given A Not A Marginal Prob. B p(B |A)=. 2 p(B |not A)=. 48 p(B)=. 34 Not B p(not B |A)=. 8 p(not B |not A)=. 52 p(not B)=. 66 Marginal Prob. p(A)=. 5 p(not A). 5 200/200= 1. 00 A Not A Marginal Prob. B p(B and A)=. 2*. 5 p(B and not A)=. 48*. 5 p(B)=. 34 Not B p(not B and A)=. 8*. 5 p(not B and not A)=. 52*. 5 p(not B)=. 66 p(not A). 5 200/200= 1. 00 Marginal Prob. p(A)=. 5 A Not A Marginal Prob. B p(A and B)=. 1 p(not A and B)=. 24 p(B)=. 34 Not B p(A and not B)=. 4 p(not A and not B)=. 26 p(not B)=. 66 Marginal Prob. p(A)=. 5 p(A). 5 200/200= 1. 00
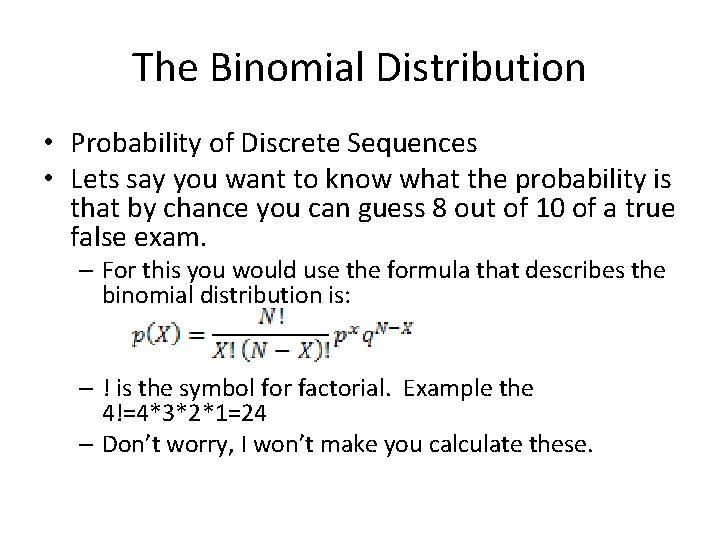
The Binomial Distribution • Probability of Discrete Sequences • Lets say you want to know what the probability is that by chance you can guess 8 out of 10 of a true false exam. – For this you would use the formula that describes the binomial distribution is: – ! is the symbol for factorial. Example the 4!=4*3*2*1=24 – Don’t worry, I won’t make you calculate these.
Mean and Standard Deviation for a Binomial Distribution. • When p=. 5 the binomial distribution is symmetrical and approximates a bell curve. – This approximation becomes more accurate as N increases. • When p<. 5 the binomial distribution is positively skewed. • When p>. 5 it will have a negative skew.
The Binomial Distribution Continued. • The binomial distribution has all the same descriptive statistics we already know. • Mean, standard deviation, and z scores. • We can use what we already know to relate this distribution to the normal curve.
Example • Take the midterms I haven’t passed out yet. • Let’s say that the mean on this test Is around. 9 and has a standard deviation of. 2. • What is the probability of picking a person at random who actually failed the test?
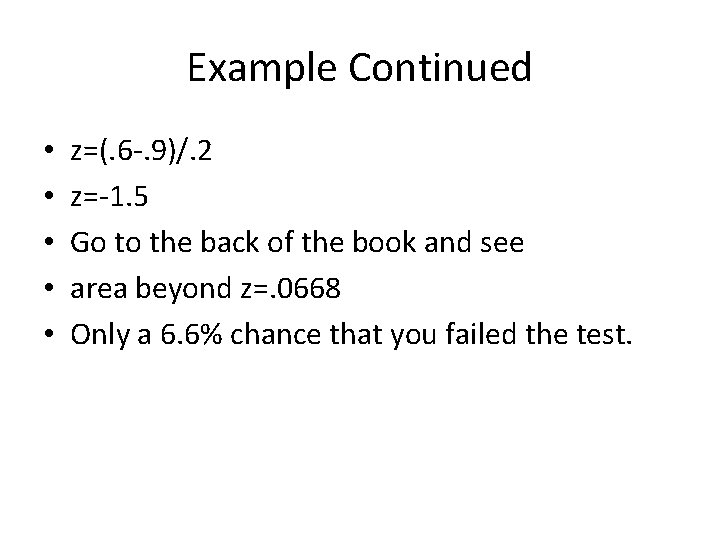
Example Continued • • • z=(. 6 -. 9)/. 2 z=-1. 5 Go to the back of the book and see area beyond z=. 0668 Only a 6. 6% chance that you failed the test.
Quiz time.
- Slides: 29