
Probability Statistics Thomas Schwarz SJ Overview Statistics is
Probability & Statistics Thomas Schwarz, SJ
Overview • Statistics is the lifeblood of data science • • You need to learn how to use statistics But the calculations are implemented in two powerful Python modules • • scipy. statsmodels
Probability • We concentrate on categorical data • Categorical data is discrete: e. g. "not infected", "infected, but no symptoms", "sick", "recovered", "dead" • Categorical data can be ordinal : • • number of cases in Milwaukee County Categorical data can be nominal : • Republican, Democrat, Other, Non-affiliated
Probability Distributions for Categorical Data • Binomial distribution: • Given a binary characteristic (yes/no) and a sample / population of what is the probability that have the characteristics • If we assume that the presence of the characteristic in one individual is independent of the characteristic of another individual
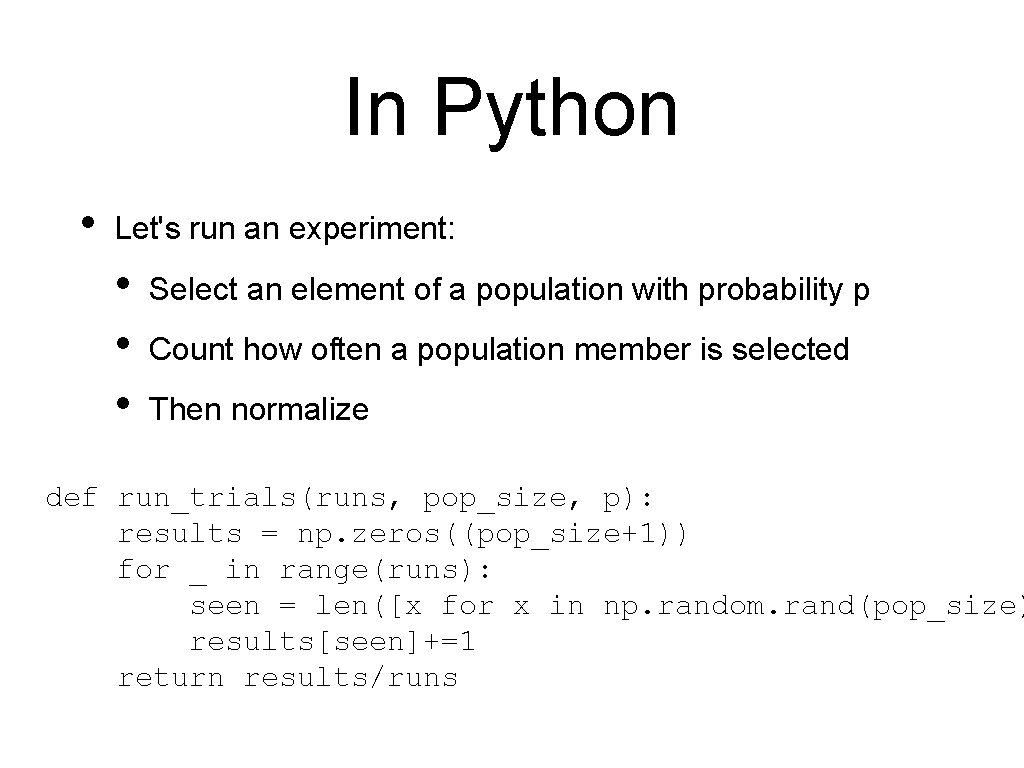
In Python • Let's run an experiment: • • • Select an element of a population with probability p Count how often a population member is selected Then normalize def run_trials(runs, pop_size, p): results = np. zeros((pop_size+1)) for _ in range(runs): seen = len([x for x in np. random. rand(pop_size) results[seen]+=1 return results/runs

In Python • Then compare with the binomial probability • binom. pmf is the probability mass function from scipy. stats import binom results = run_trials(runs, pop_size, p) xvalues = np. arange(0, len(results)) binom. pmf(xvalues, pop_size, p)
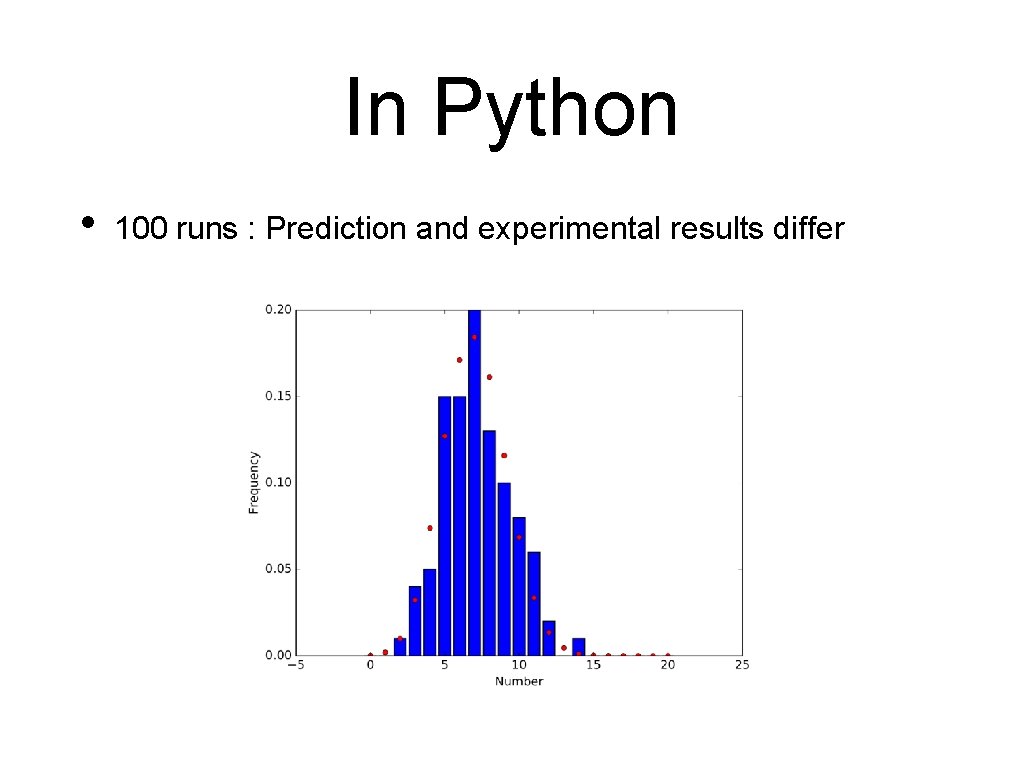
In Python • 100 runs : Prediction and experimental results differ
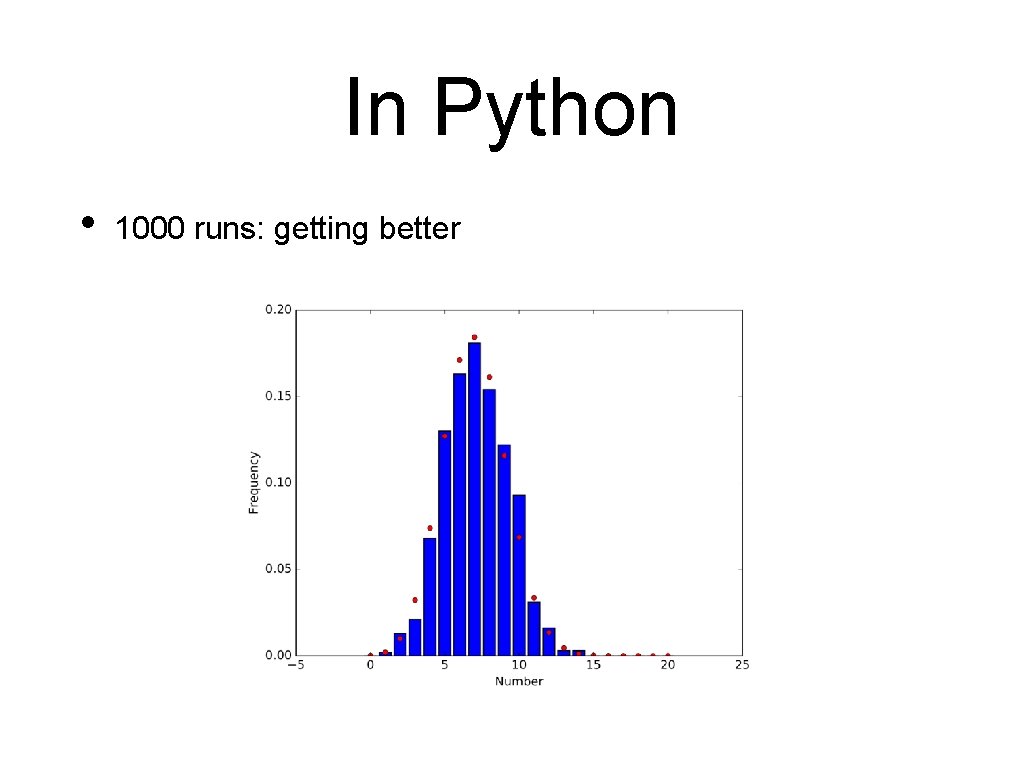
In Python • 1000 runs: getting better
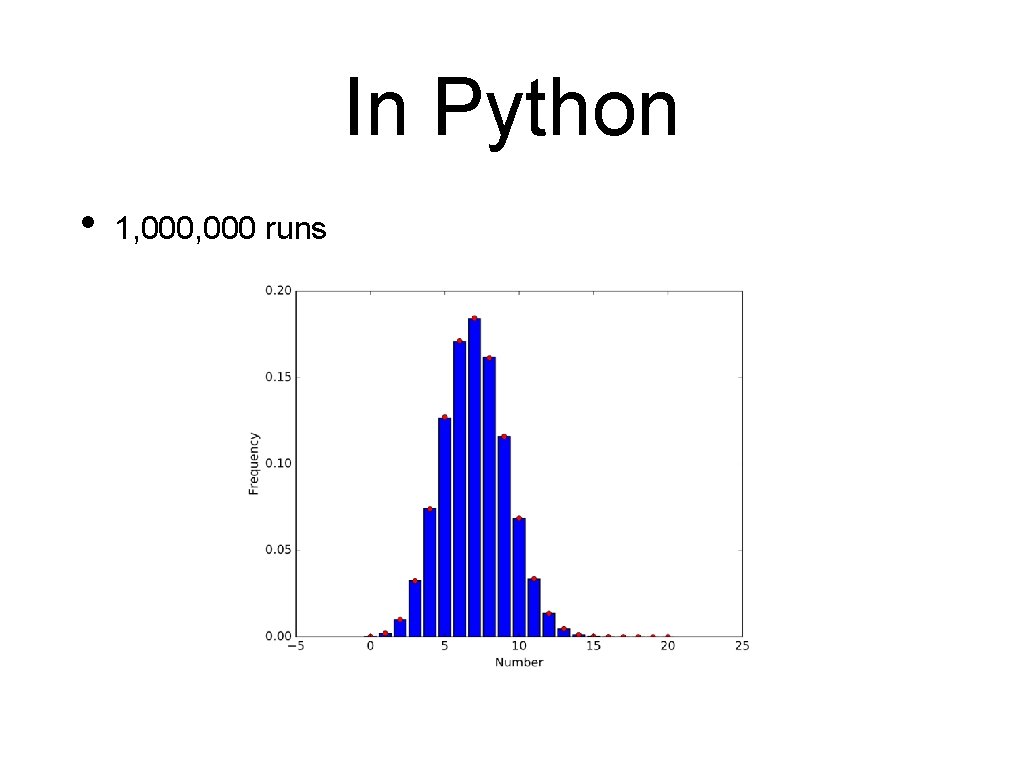
In Python • 1, 000 runs
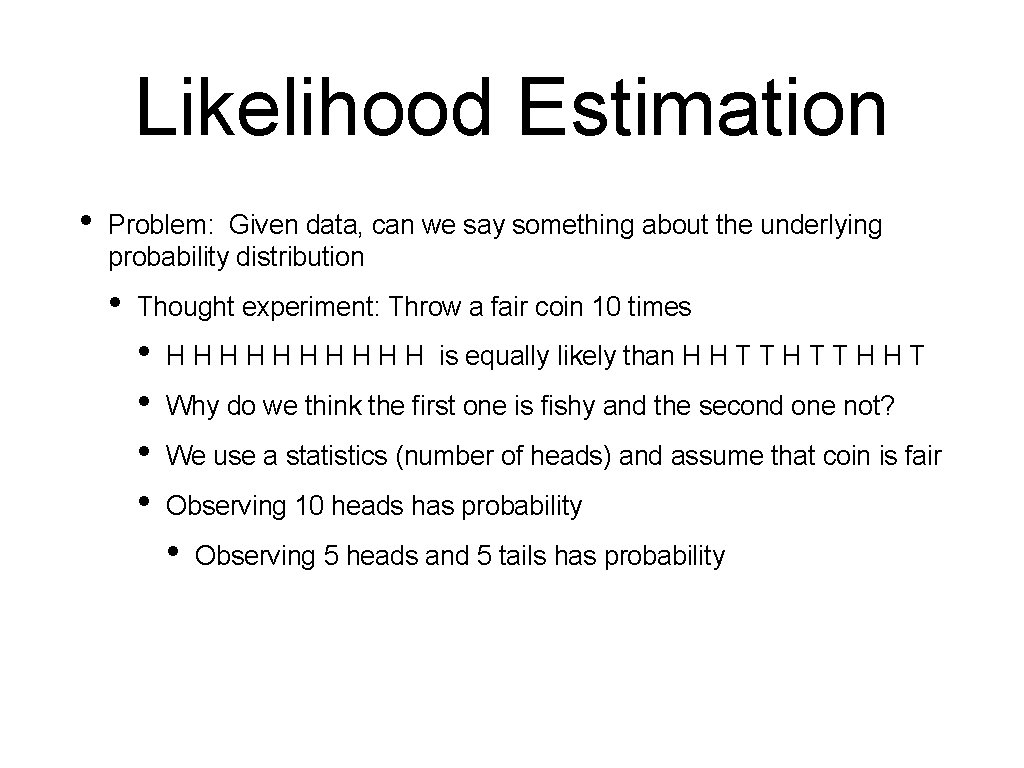
Likelihood Estimation • Problem: Given data, can we say something about the underlying probability distribution • Thought experiment: Throw a fair coin 10 times • • H H H H H is equally likely than H H T T H H T Why do we think the first one is fishy and the second one not? We use a statistics (number of heads) and assume that coin is fair Observing 10 heads has probability • Observing 5 heads and 5 tails has probability
Likelihood Estimation • Reversely • • Given a sample and a putative probability Likelihood: • What is the probability given to observe a statistics on the sample
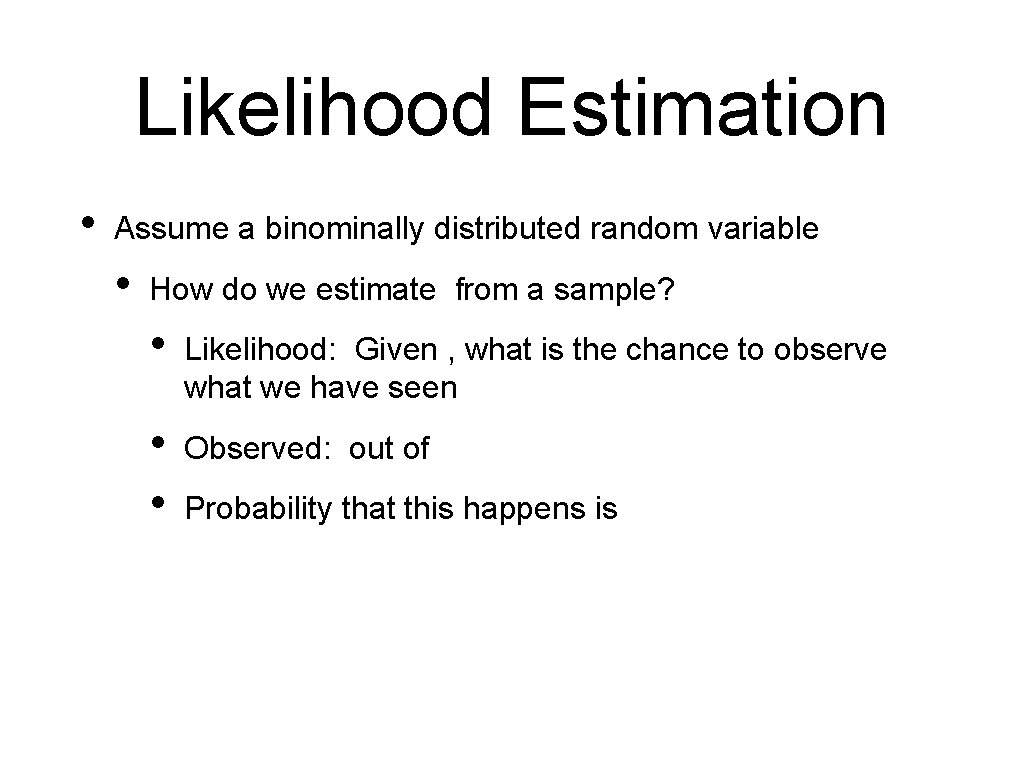
Likelihood Estimation • Assume a binominally distributed random variable • How do we estimate from a sample? • Likelihood: Given , what is the chance to observe what we have seen • • Observed: out of Probability that this happens is
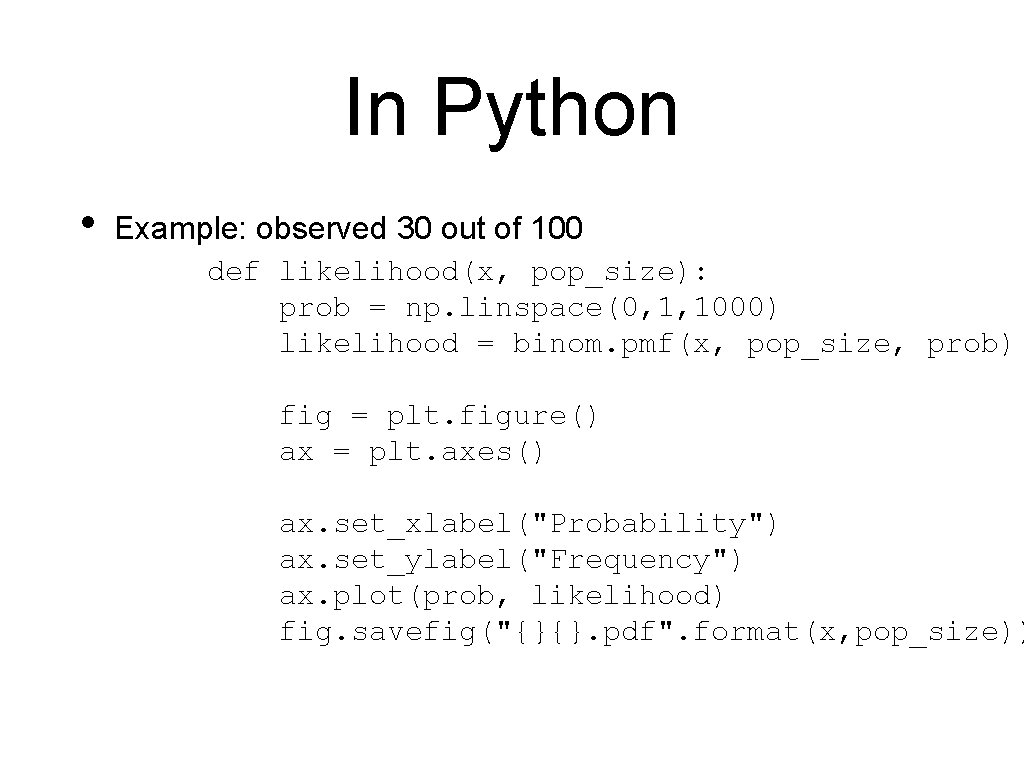
In Python • Example: observed 30 out of 100 def likelihood(x, pop_size): prob = np. linspace(0, 1, 1000) likelihood = binom. pmf(x, pop_size, prob) fig = plt. figure() ax = plt. axes() ax. set_xlabel("Probability") ax. set_ylabel("Frequency") ax. plot(prob, likelihood) fig. savefig("{}{}. pdf". format(x, pop_size))
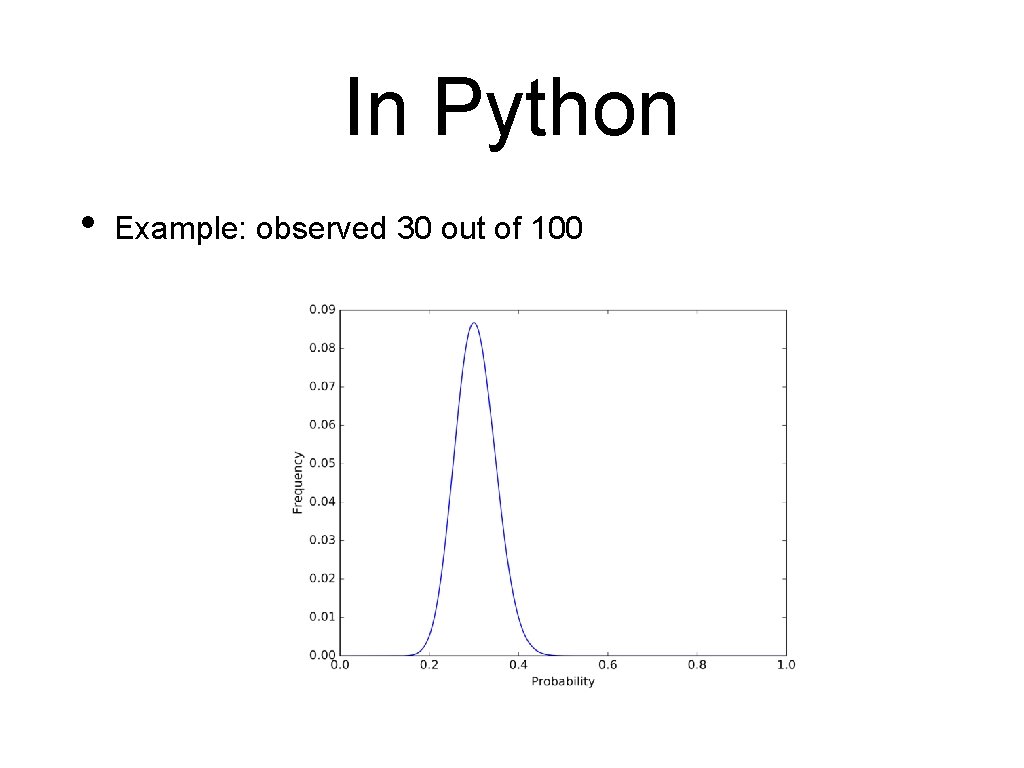
In Python • Example: observed 30 out of 100
Binomial Distribution • • Likelihood is maximized for Formally: • which implies by differentiation that
Binomial Distribution • Therefore: Maximum Likelihood estimator for given out of observations is
Getting Statistics
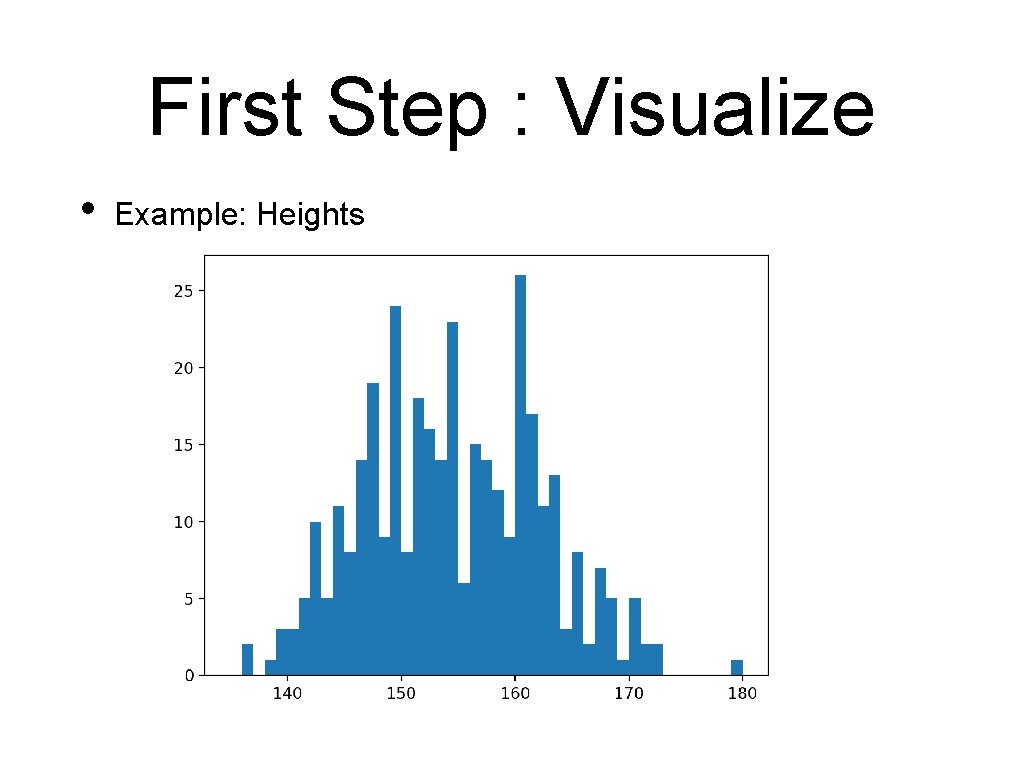
First Step : Visualize • Example: Heights
Second Step: Get Stats • • • Statistic: any type of measure taken on a sample Implemented in scipy. stats Random number generation in np. random
Sample Generation • Use np. random • Returns samples for many different distributions • E. g. • np. random. normal(mean, • np. random. gamma(shape, std, size=1000) scale, size=1000) • Can use numpy. random. seed(12345)to insure same behavior
Getting Statistical Measures • • Use scipy. stats Has many different distributions • scipy. stats. norm is a distribution object • Has a pdf, a cdf, …
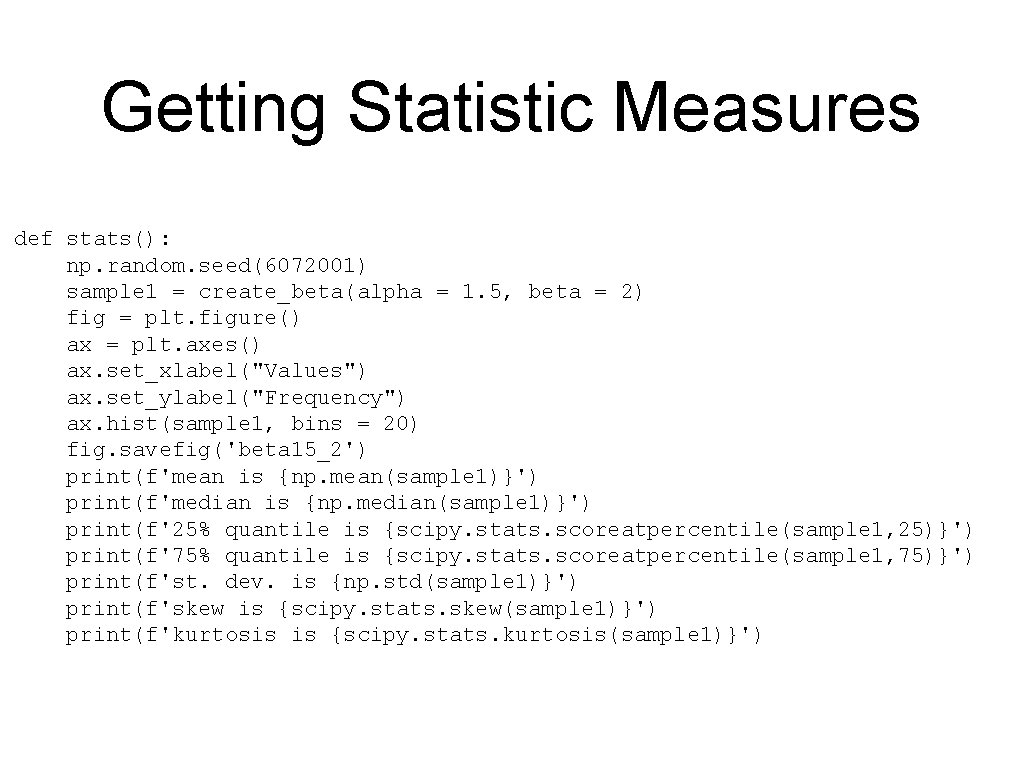
Getting Statistic Measures def stats(): np. random. seed(6072001) sample 1 = create_beta(alpha = 1. 5, beta = 2) fig = plt. figure() ax = plt. axes() ax. set_xlabel("Values") ax. set_ylabel("Frequency") ax. hist(sample 1, bins = 20) fig. savefig('beta 15_2') print(f'mean is {np. mean(sample 1)}') print(f'median is {np. median(sample 1)}') print(f'25% quantile is {scipy. stats. scoreatpercentile(sample 1, 25)}') print(f'75% quantile is {scipy. stats. scoreatpercentile(sample 1, 75)}') print(f'st. dev. is {np. std(sample 1)}') print(f'skew is {scipy. stats. skew(sample 1)}') print(f'kurtosis is {scipy. stats. kurtosis(sample 1)}')
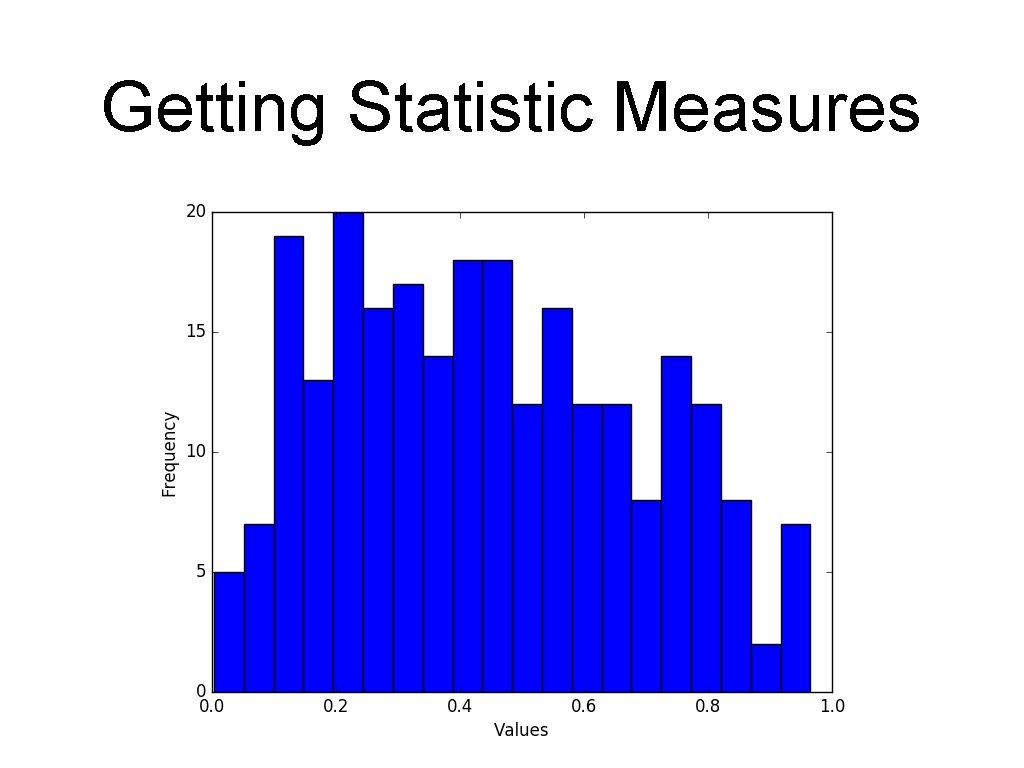
Getting Statistic Measures
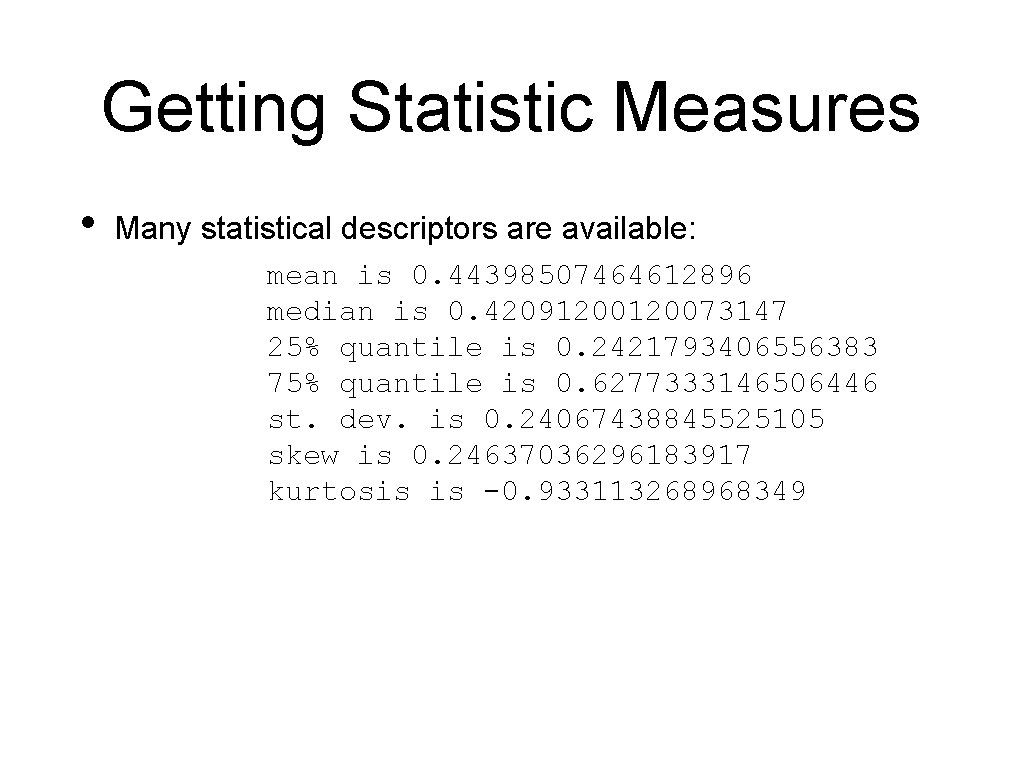
Getting Statistic Measures • Many statistical descriptors are available: mean is 0. 44398507464612896 median is 0. 4209120073147 25% quantile is 0. 2421793406556383 75% quantile is 0. 6277333146506446 st. dev. is 0. 24067438845525105 skew is 0. 24637036296183917 kurtosis is -0. 933113268968349
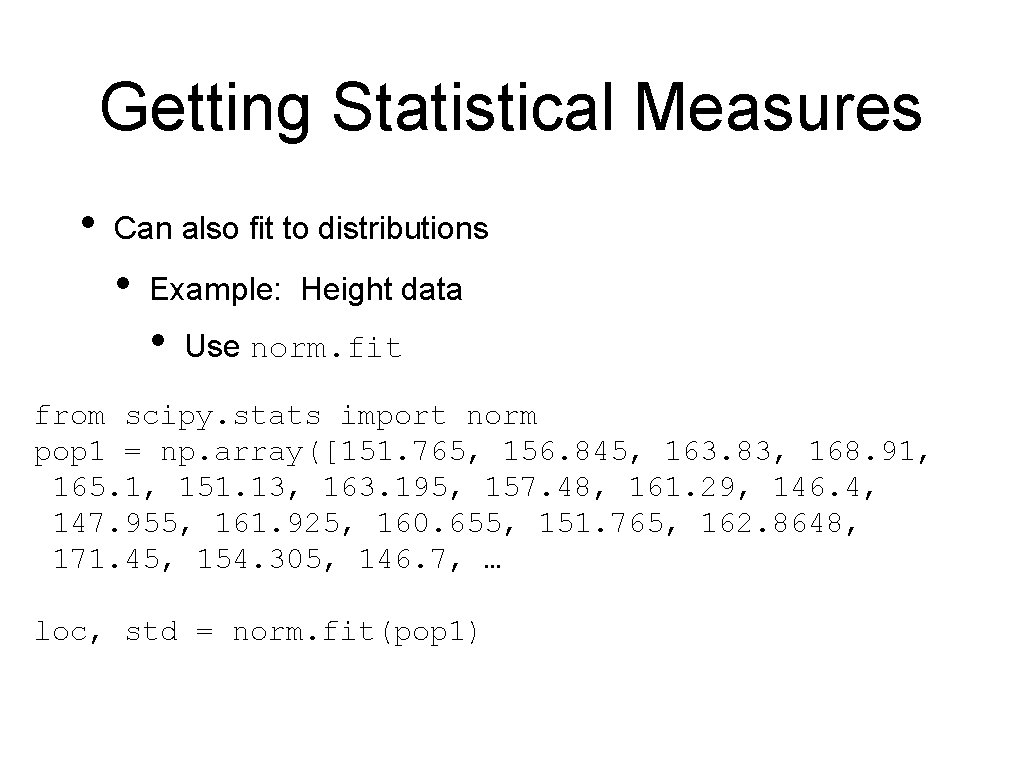
Getting Statistical Measures • Can also fit to distributions • Example: Height data • Use norm. fit from scipy. stats import norm pop 1 = np. array([151. 765, 156. 845, 163. 83, 168. 91, 165. 1, 151. 13, 163. 195, 157. 48, 161. 29, 146. 4, 147. 955, 161. 925, 160. 655, 151. 765, 162. 8648, 171. 45, 154. 305, 146. 7, … loc, std = norm. fit(pop 1)
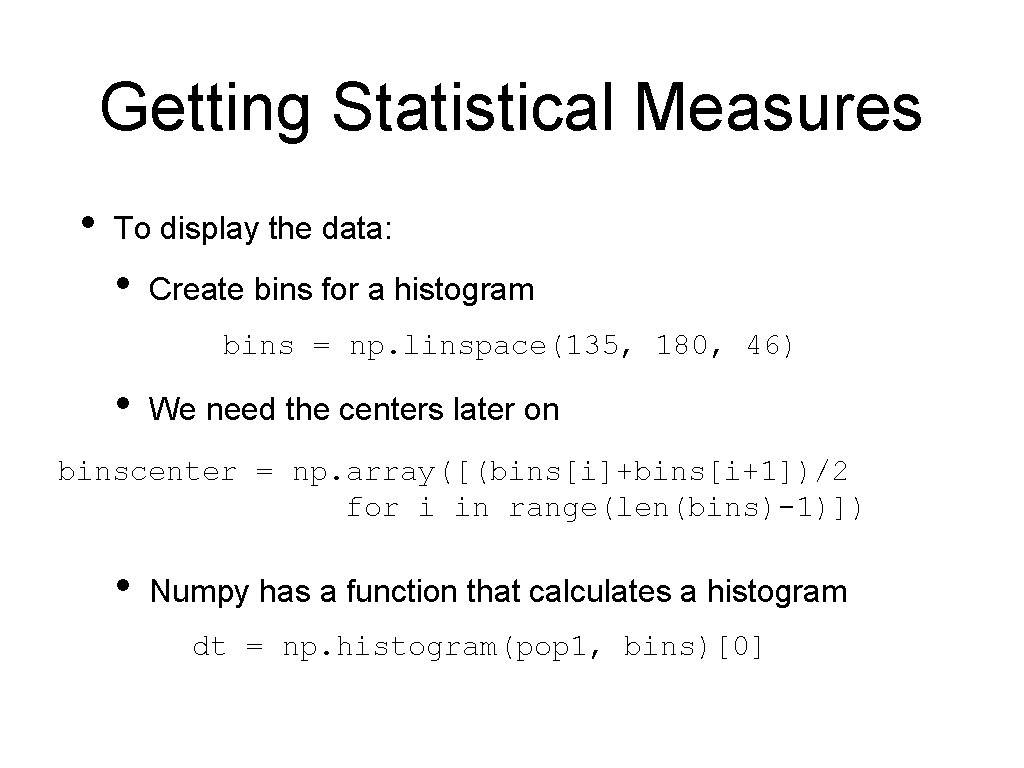
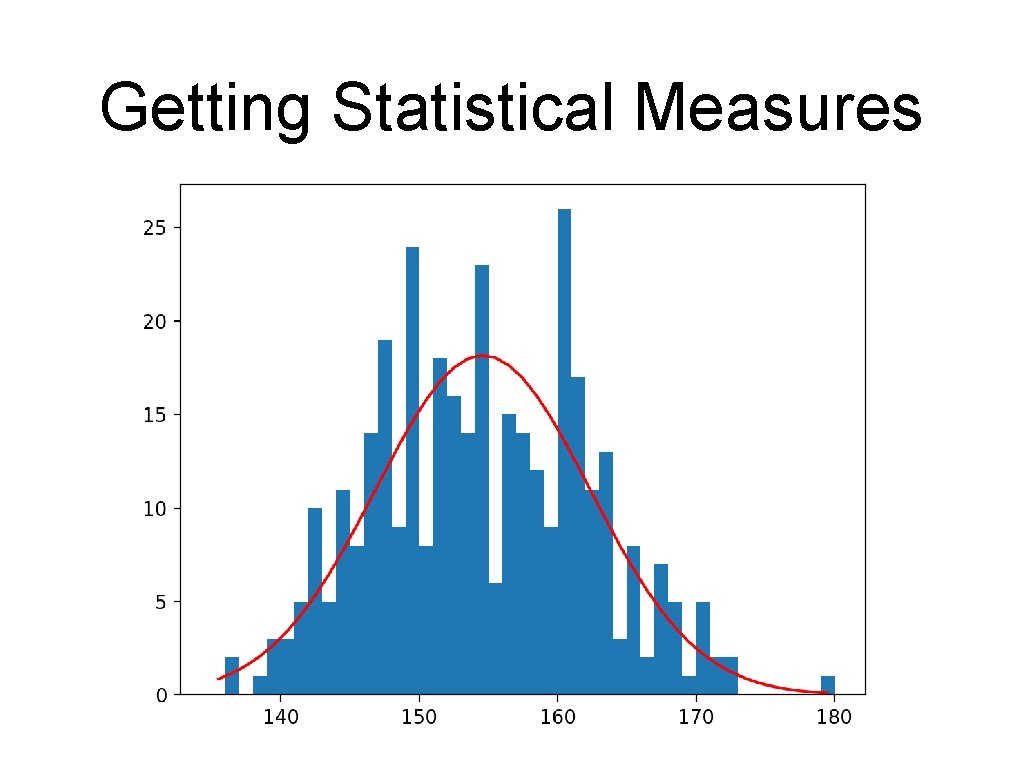
Getting Statistical Measures • To display the data: • Create bins for a histogram bins = np. linspace(135, 180, 46) • We need the centers later on binscenter = np. array([(bins[i]+bins[i+1])/2 for i in range(len(bins)-1)]) • Numpy has a function that calculates a histogram dt = np. histogram(pop 1, bins)[0]
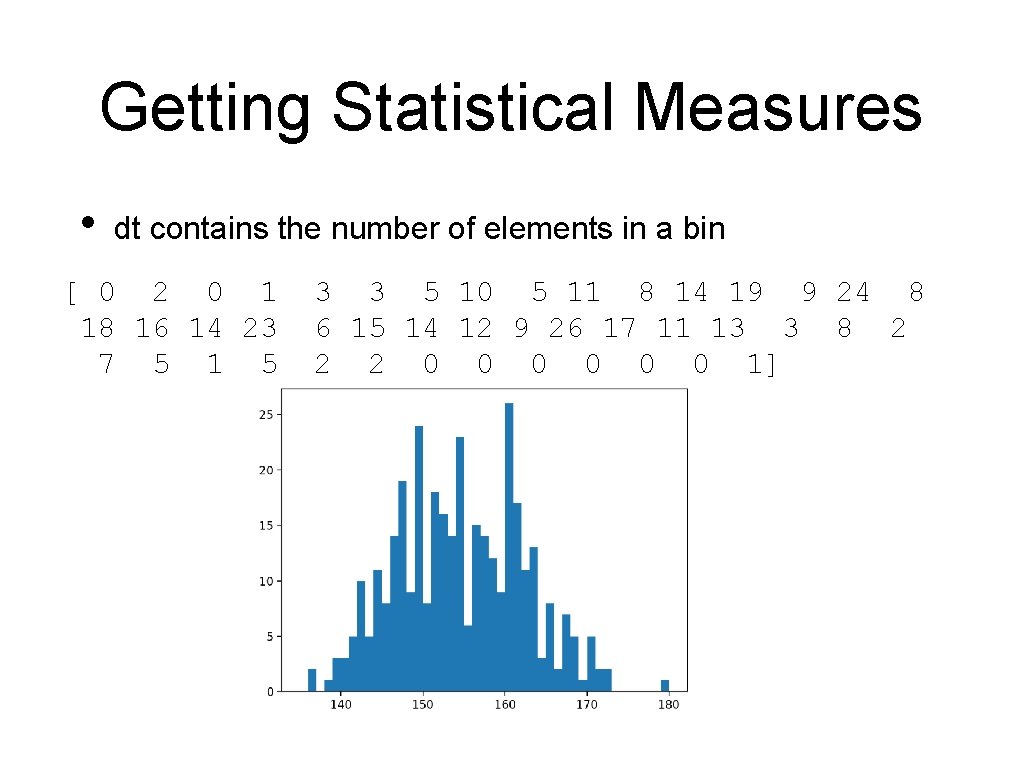
Getting Statistical Measures • dt contains the number of elements in a bin [ 0 2 0 1 18 16 14 23 7 5 1 5 3 3 5 10 5 11 8 14 19 9 24 8 6 15 14 12 9 26 17 11 13 3 8 2 2 2 0 0 0 1]
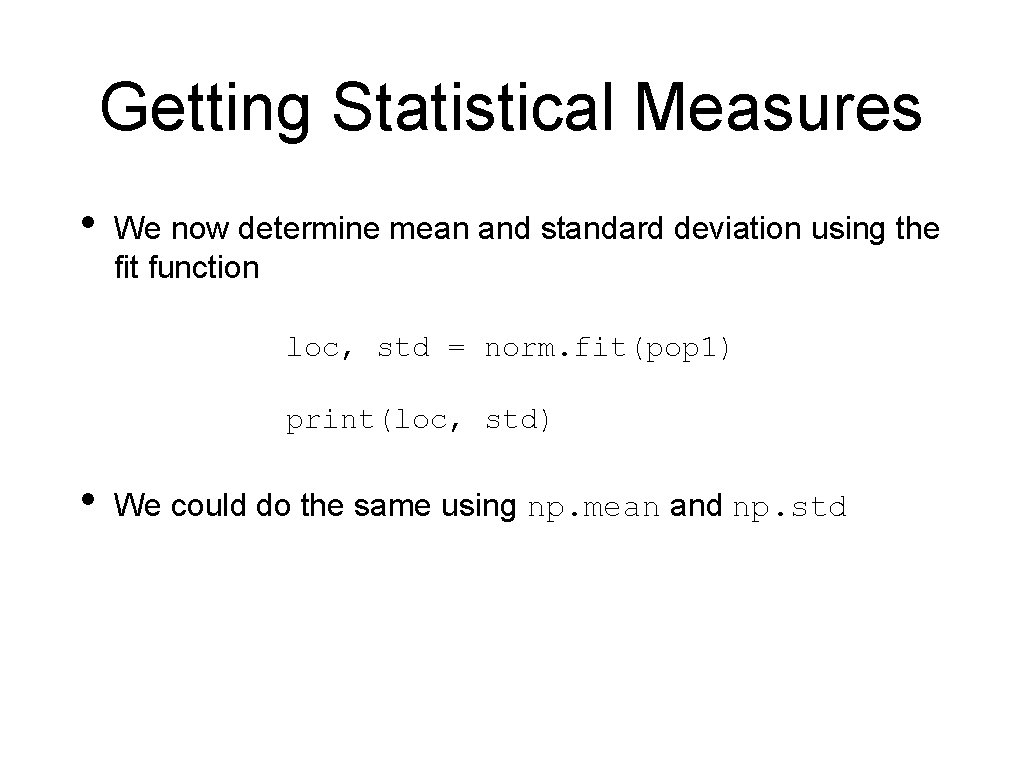
Getting Statistical Measures • We now determine mean and standard deviation using the fit function loc, std = norm. fit(pop 1) print(loc, std) • We could do the same using np. mean and np. std
Getting Statistical Measures • We now create a normal distribution object with this mean and this standard deviation pdf = norm(loc, std). pdf
Getting Statistical Measures • Now, we draw both the histogram and the pdf • The pdf has an integral of 1, so we multiply with the number of elements in the population plt. figure() plt. bar(binscenter, dt, width = bins[1]-bins[0]) plt. plot(binscenter, len(pop 1)*pdf(binscenter), 'red') plt. show()
Getting Statistical Measures
Statistical Tests
Statistical Tests • Statistical test calculates a value — the test statistics — from a sample in order to refute or confirm a hypothesis • Formulate a null hypothesis • This is usually the boring stuff: two samples from the same distribution, mean is where it is expected to be, … • Calculate the probability that the observed statistics or a more significant result has occurred given the null hypothesis • If the probability is small: reject the null hypothesis
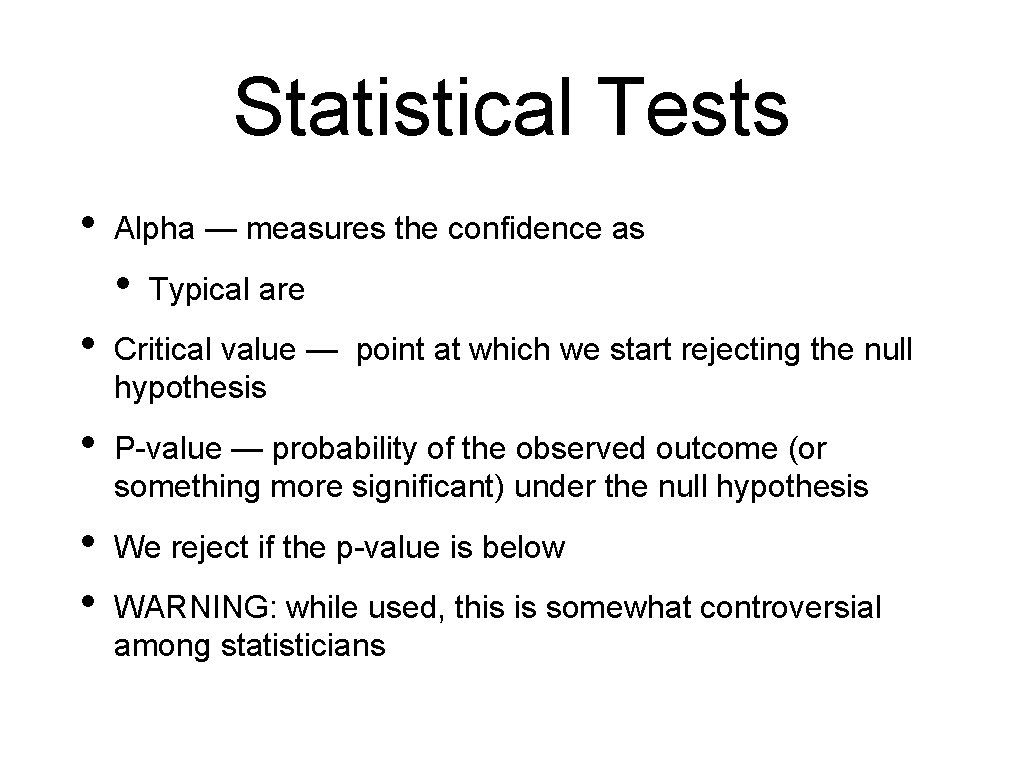
Statistical Tests • Alpha — measures the confidence as • Typical are • Critical value — point at which we start rejecting the null hypothesis • P-value — probability of the observed outcome (or something more significant) under the null hypothesis • • We reject if the p-value is below WARNING: while used, this is somewhat controversial among statisticians
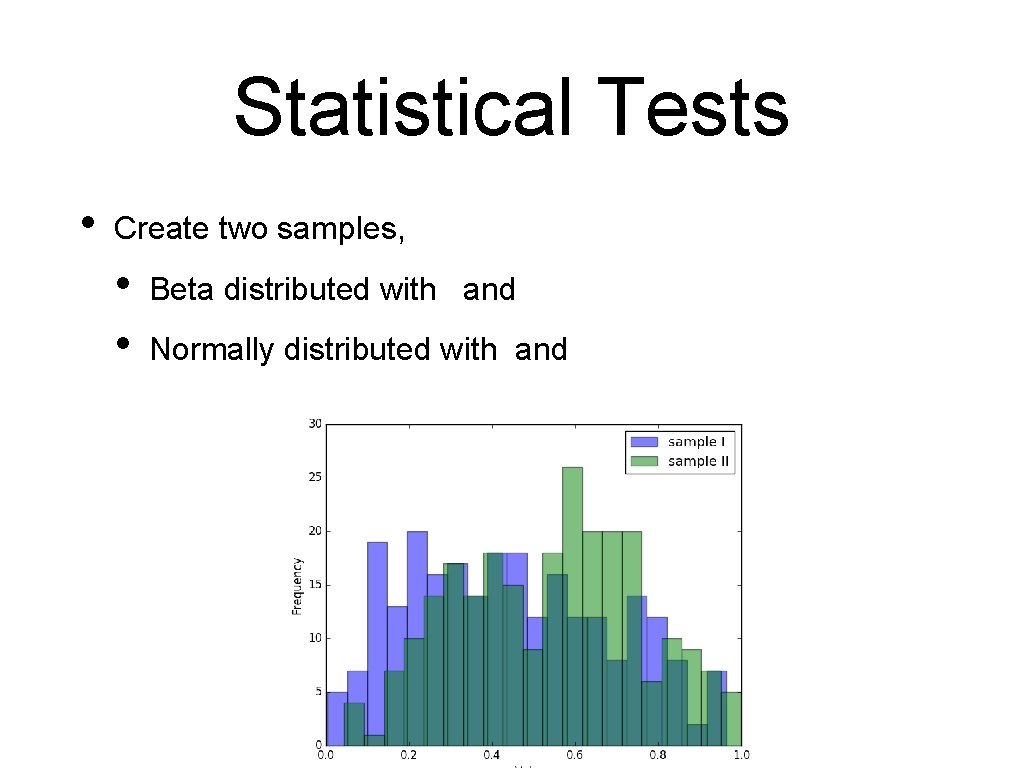
Statistical Tests • Create two samples, • • Beta distributed with and Normally distributed with and
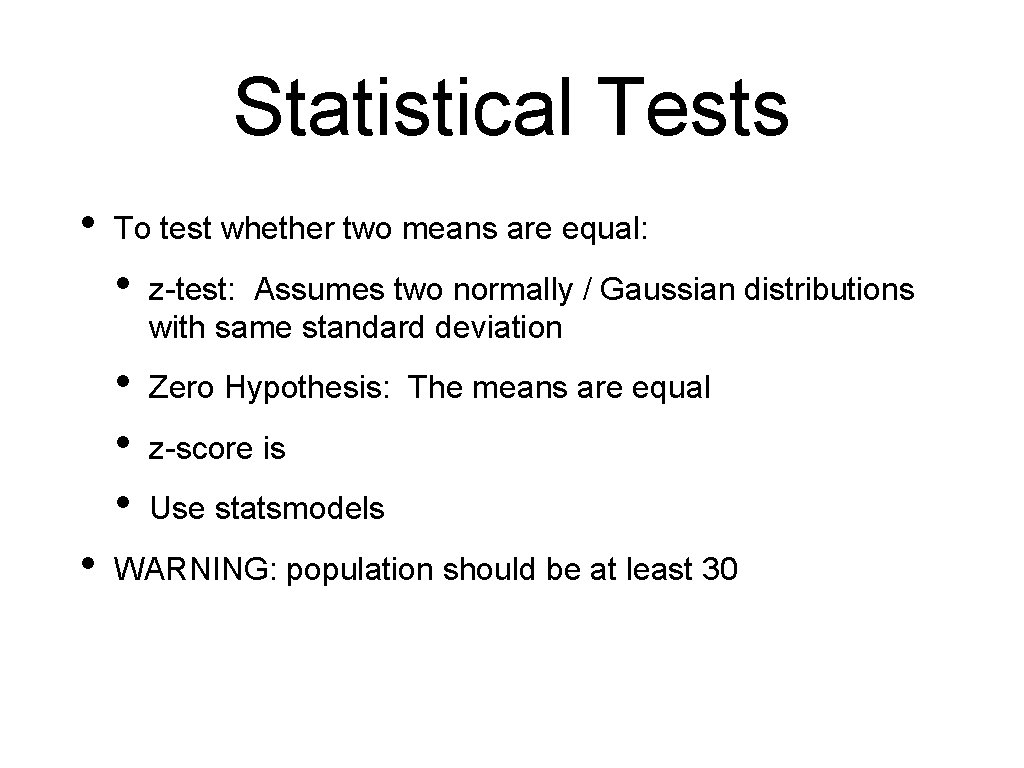
Statistical Tests • • To test whether two means are equal: • z-test: Assumes two normally / Gaussian distributions with same standard deviation • • • Zero Hypothesis: The means are equal z-score is Use statsmodels WARNING: population should be at least 30
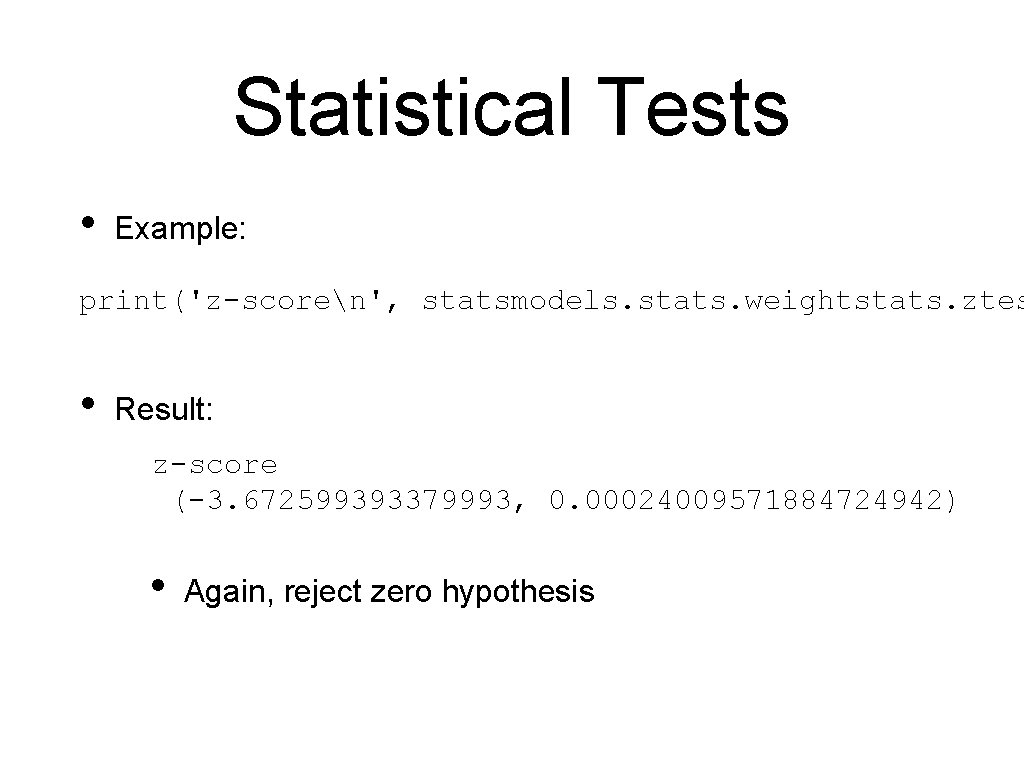
Statistical Tests • Example: print('z-scoren', statsmodels. stats. weightstats. ztes • Result: z-score (-3. 672599393379993, 0. 00024009571884724942) • Again, reject zero hypothesis
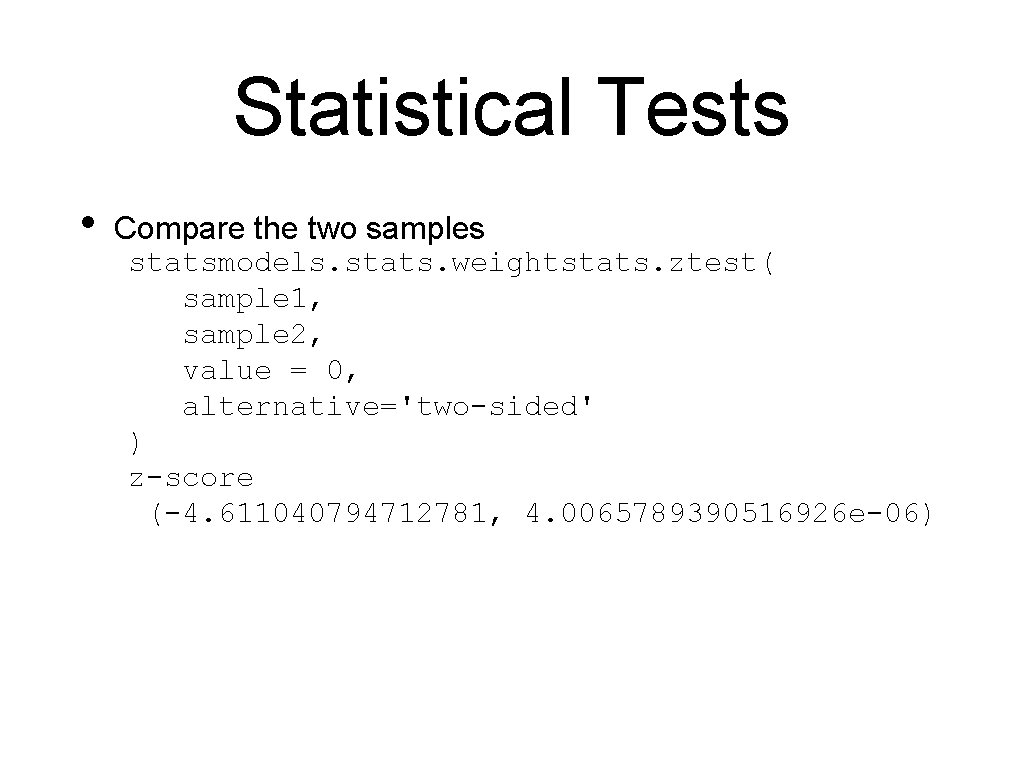
Statistical Tests • Compare the two samples statsmodels. stats. weightstats. ztest( sample 1, sample 2, value = 0, alternative='two-sided' ) z-score (-4. 611040794712781, 4. 0065789390516926 e-06)
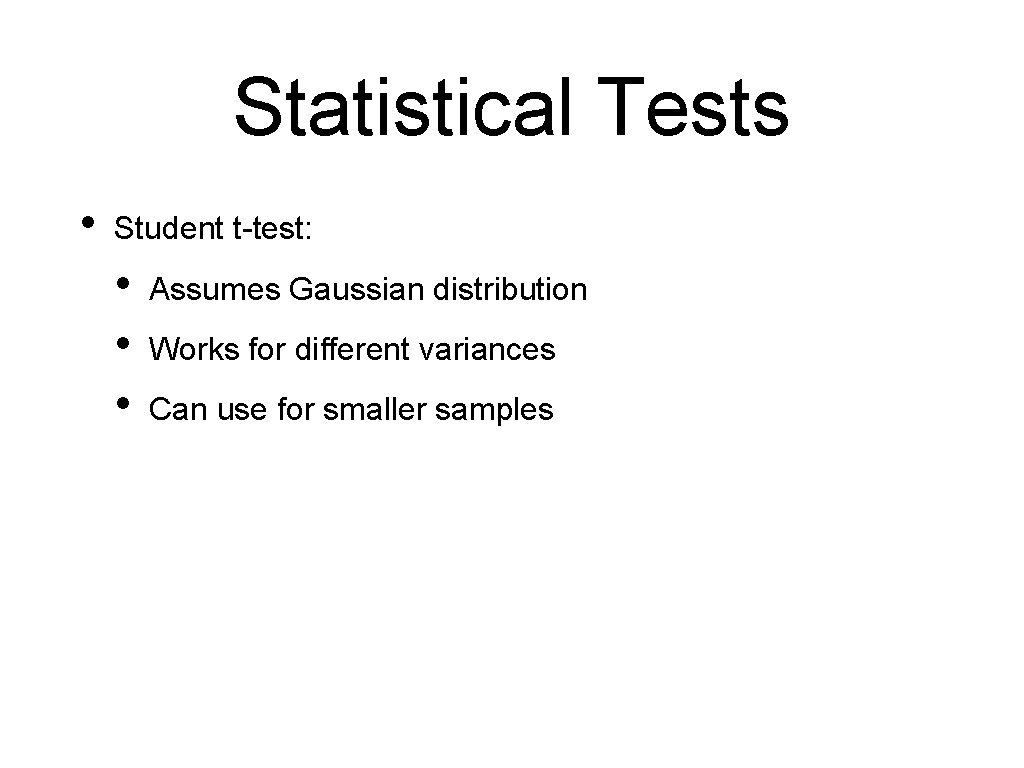
Statistical Tests • Student t-test: • • • Assumes Gaussian distribution Works for different variances Can use for smaller samples
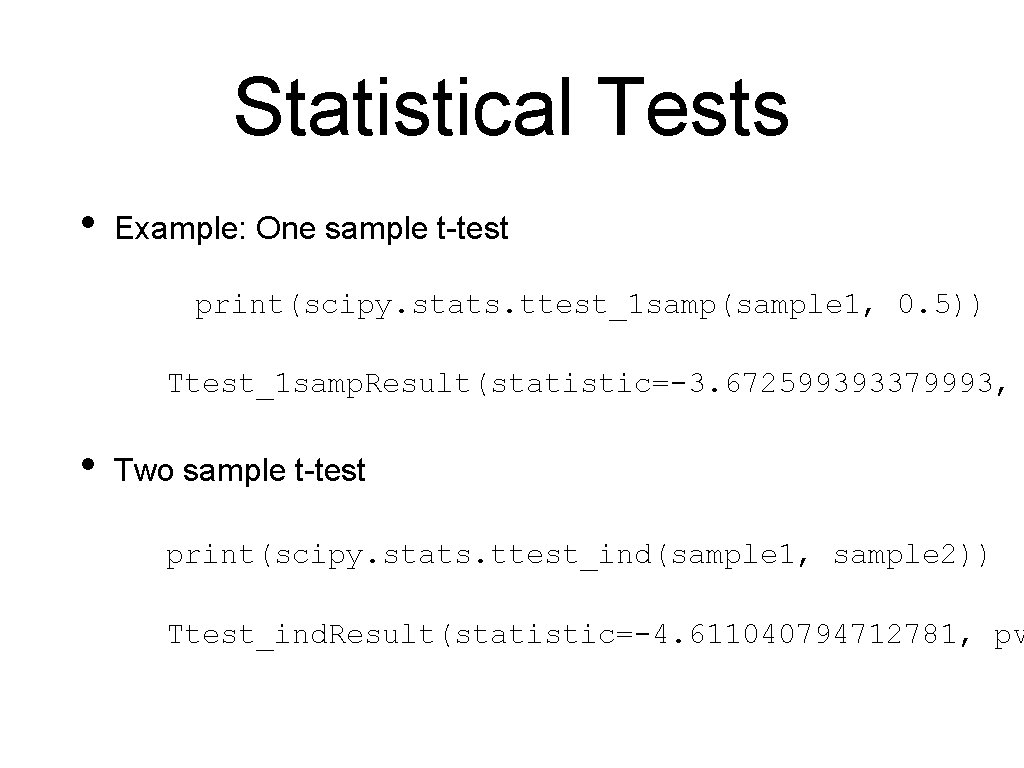
Statistical Tests • Example: One sample t-test print(scipy. stats. ttest_1 samp(sample 1, 0. 5)) Ttest_1 samp. Result(statistic=-3. 672599393379993, • Two sample t-test print(scipy. stats. ttest_ind(sample 1, sample 2)) Ttest_ind. Result(statistic=-4. 611040794712781, pv
Statistical Tests • This is just a sample of important tests

Contingency Tables
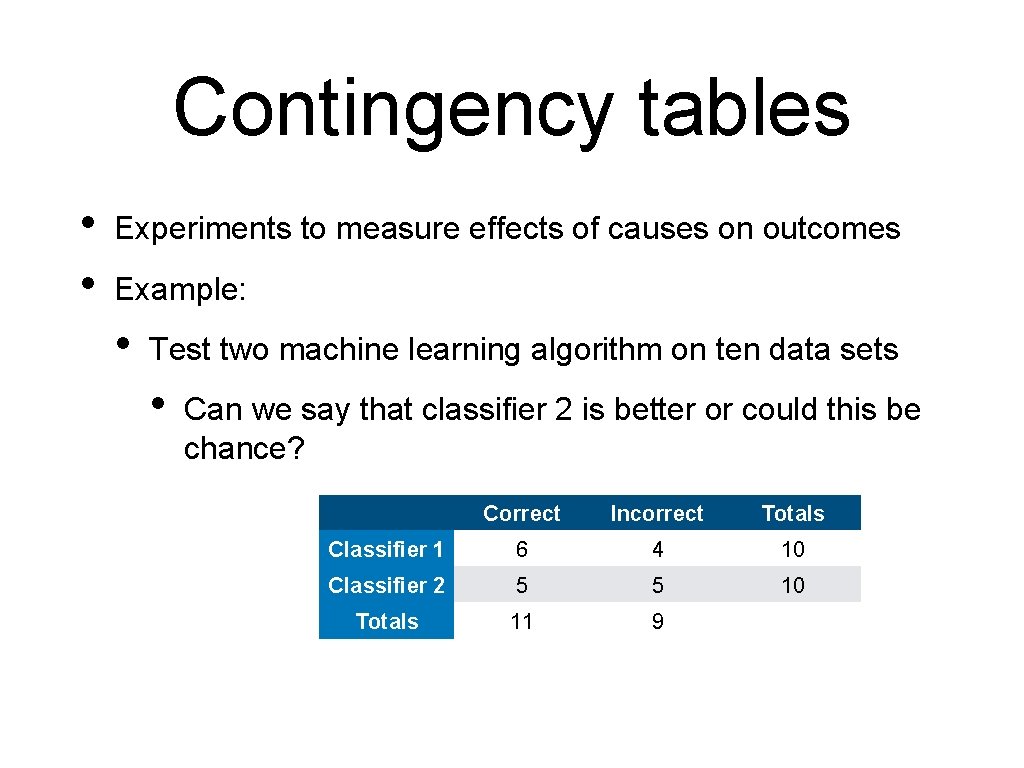
Contingency tables • • Experiments to measure effects of causes on outcomes Example: • Test two machine learning algorithm on ten data sets • Can we say that classifier 2 is better or could this be chance? Correct Incorrect Totals Classifier 1 6 4 10 Classifier 2 5 5 10 Totals 11 9
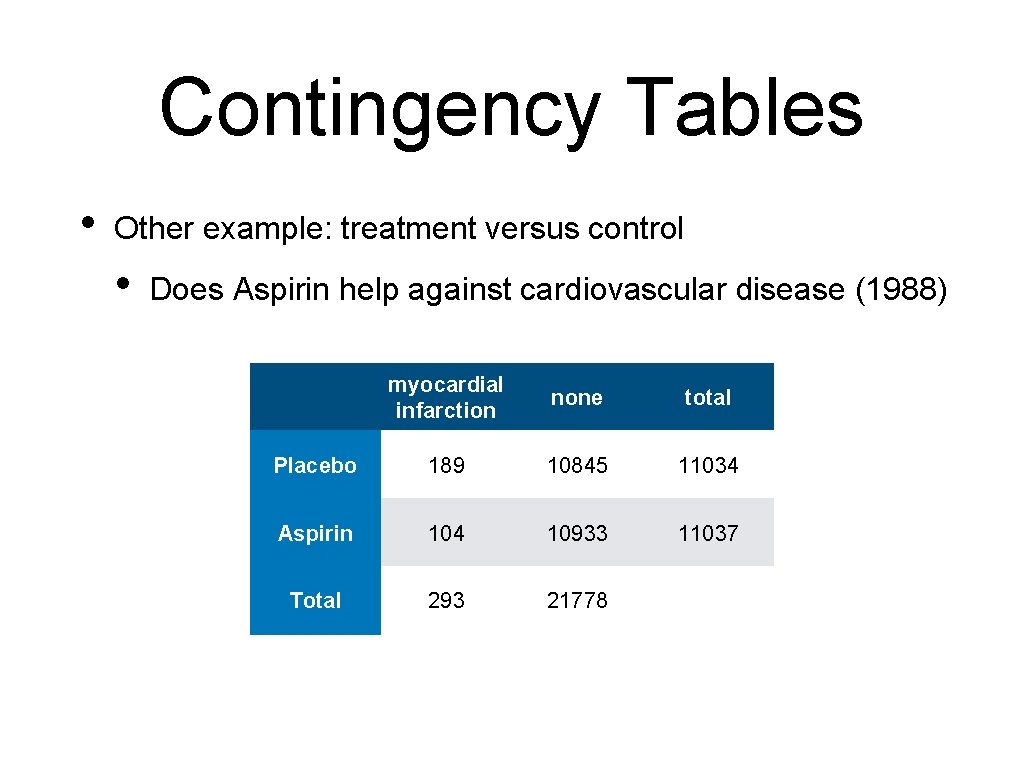
Contingency Tables • Other example: treatment versus control • Does Aspirin help against cardiovascular disease (1988) myocardial infarction none total Placebo 189 10845 11034 Aspirin 104 10933 11037 Total 293 21778
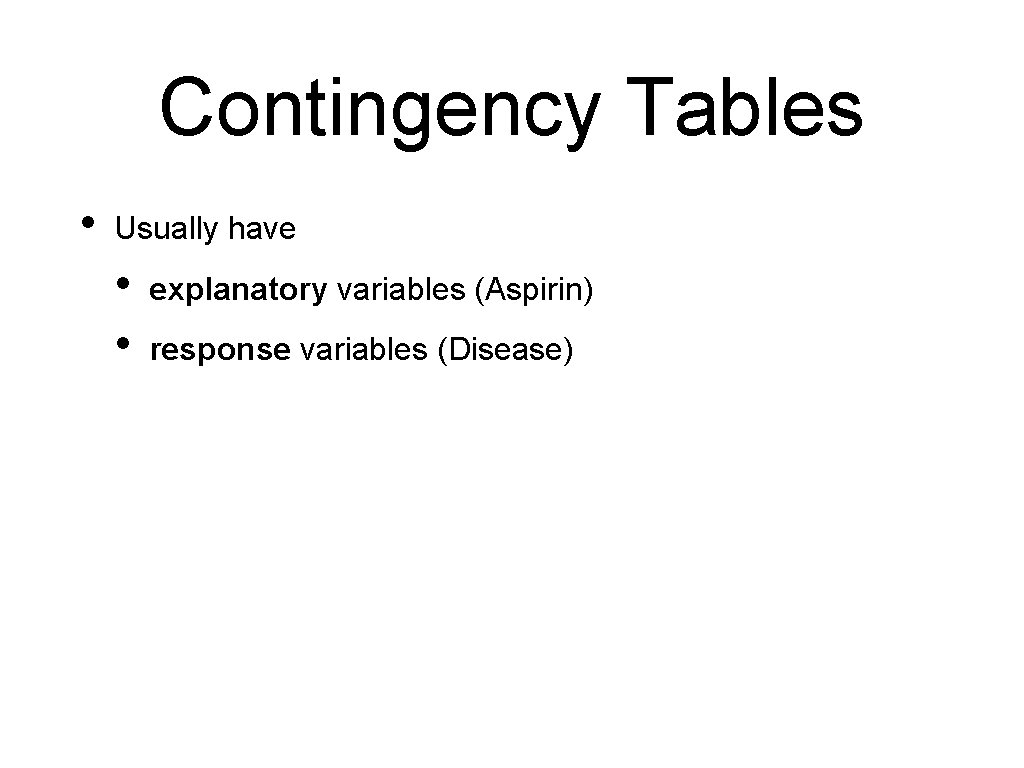
Contingency Tables • Usually have • • explanatory variables (Aspirin) response variables (Disease)
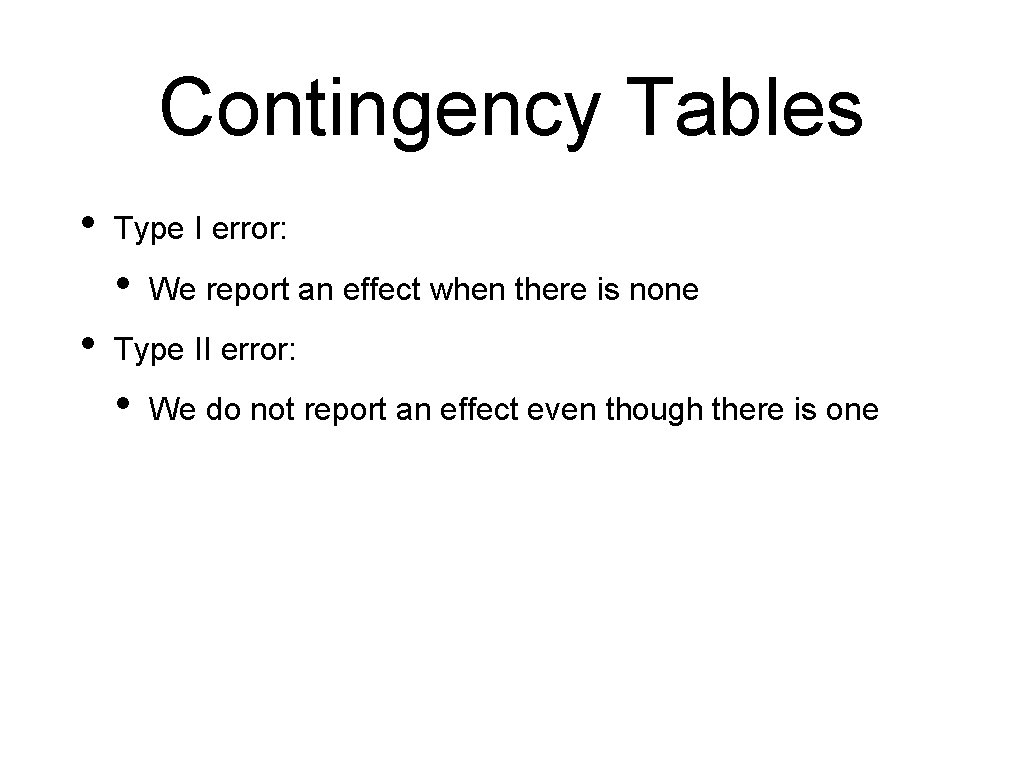
Contingency Tables • Type I error: • • We report an effect when there is none Type II error: • We do not report an effect even though there is one
Contingency Tables • There are many possible statistics • More, if the number of observations is high
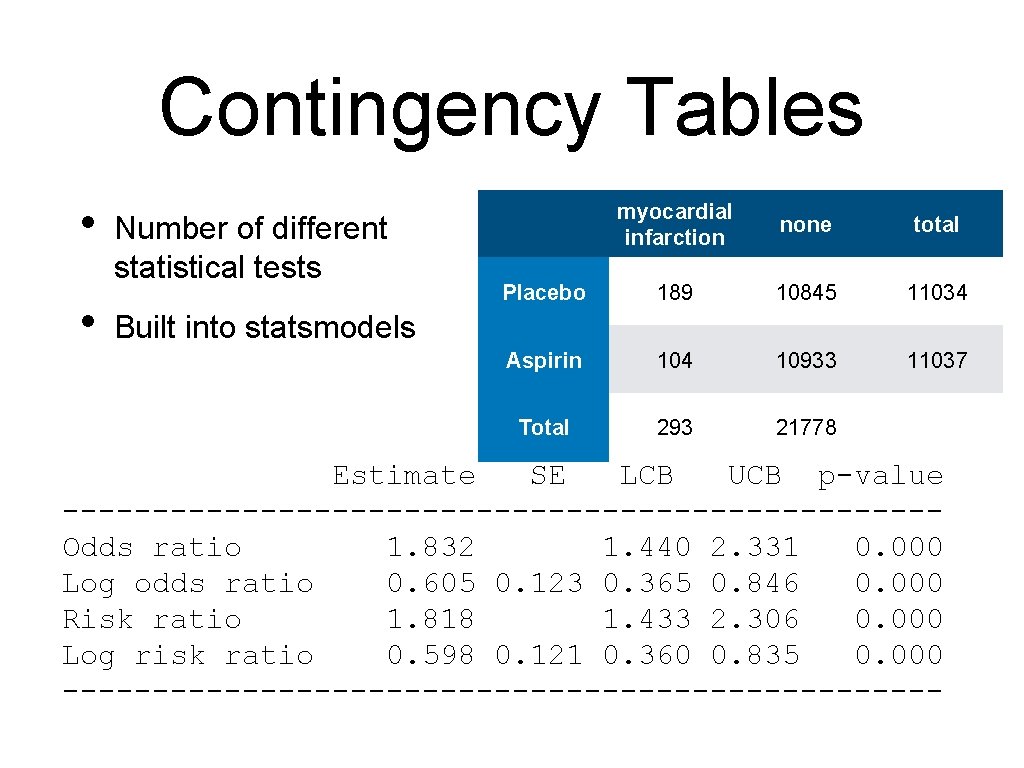
Contingency Tables • • Number of different statistical tests myocardial infarction none total Placebo 189 10845 11034 Aspirin 104 10933 11037 Total 293 21778 Built into statsmodels Estimate SE LCB UCB p-value ------------------------Odds ratio 1. 832 1. 440 2. 331 0. 000 Log odds ratio 0. 605 0. 123 0. 365 0. 846 0. 000 Risk ratio 1. 818 1. 433 2. 306 0. 000 Log risk ratio 0. 598 0. 121 0. 360 0. 835 0. 000 -------------------------
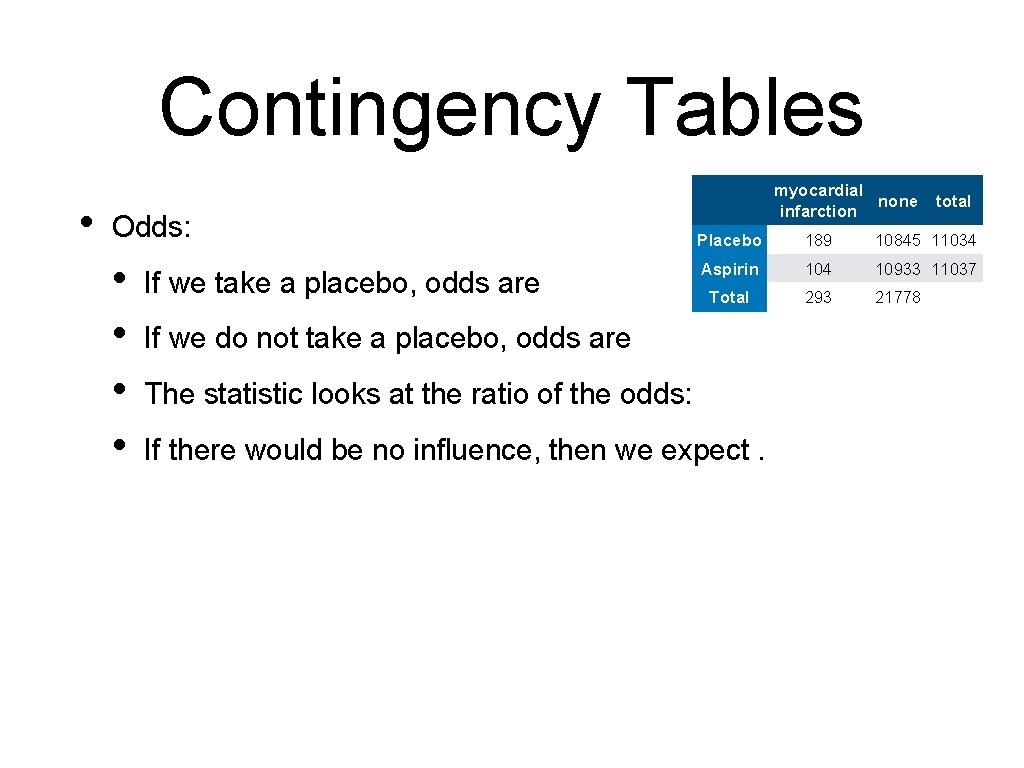
Contingency Tables • Odds: • • If we take a placebo, odds are myocardial none infarction total Placebo 189 10845 11034 Aspirin 104 10933 11037 Total 293 21778 If we do not take a placebo, odds are The statistic looks at the ratio of the odds: If there would be no influence, then we expect.
Contingency Tables • Log odds • • The statistics for odds are heavily skewed Easier to use which can be approximated with a normal distribution
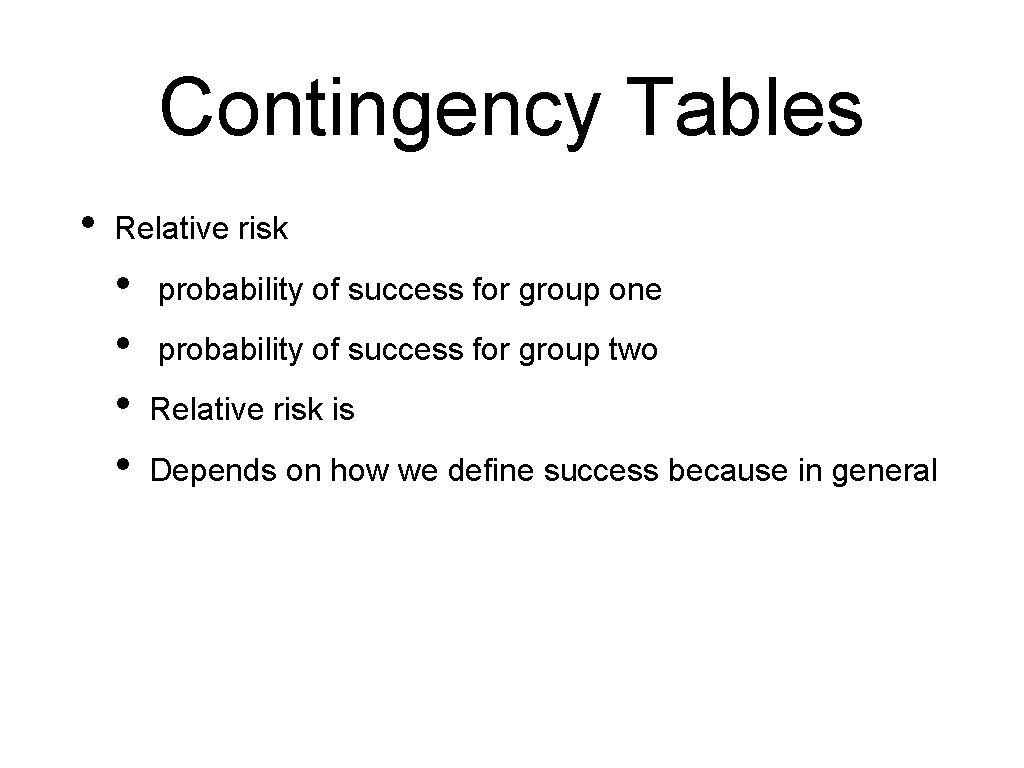
Contingency Tables • Relative risk • • probability of success for group one probability of success for group two Relative risk is Depends on how we define success because in general
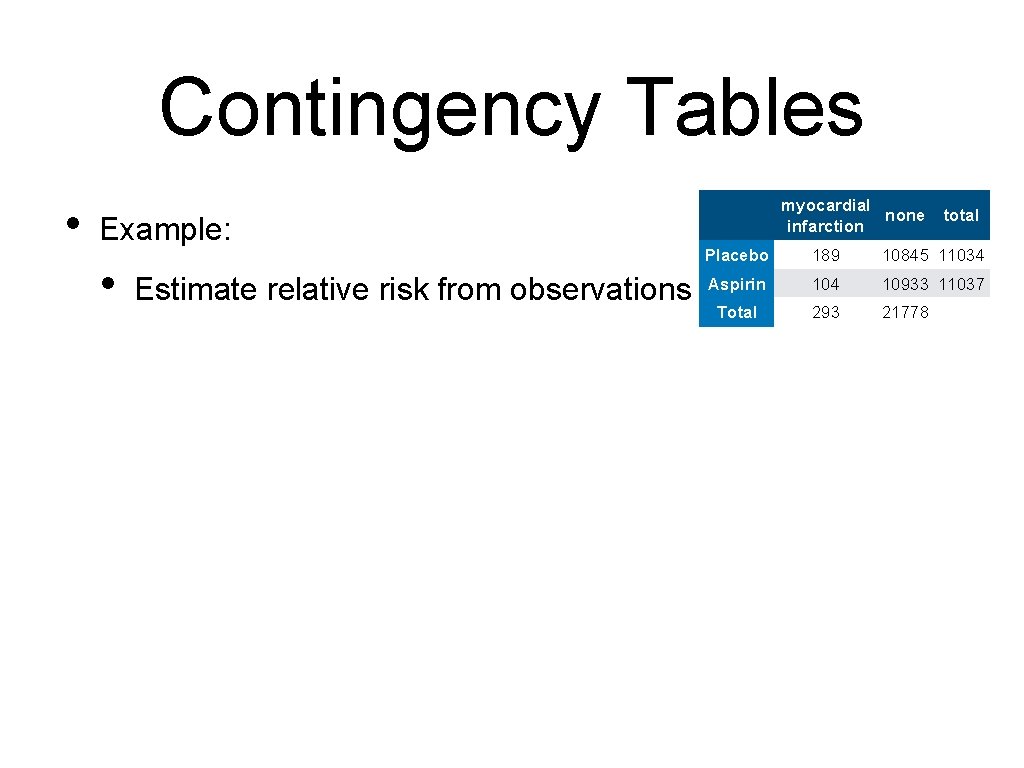
Contingency Tables • Example: • Estimate relative risk from observations myocardial none infarction total Placebo 189 10845 11034 Aspirin 104 10933 11037 Total 293 21778
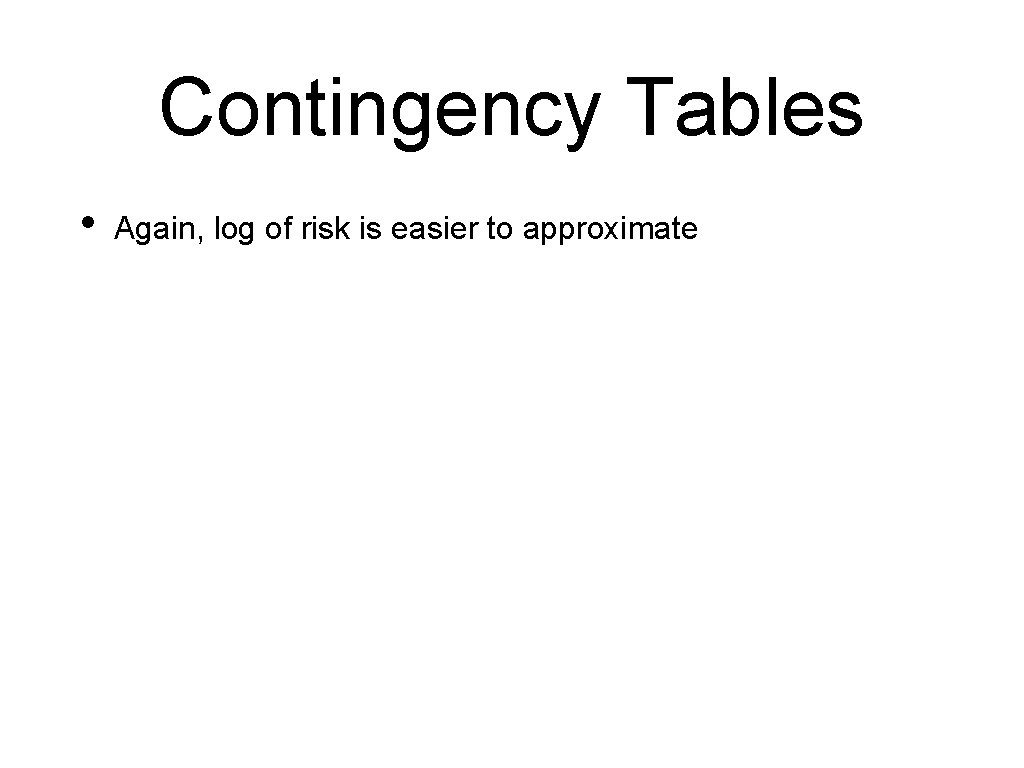
Contingency Tables • Again, log of risk is easier to approximate
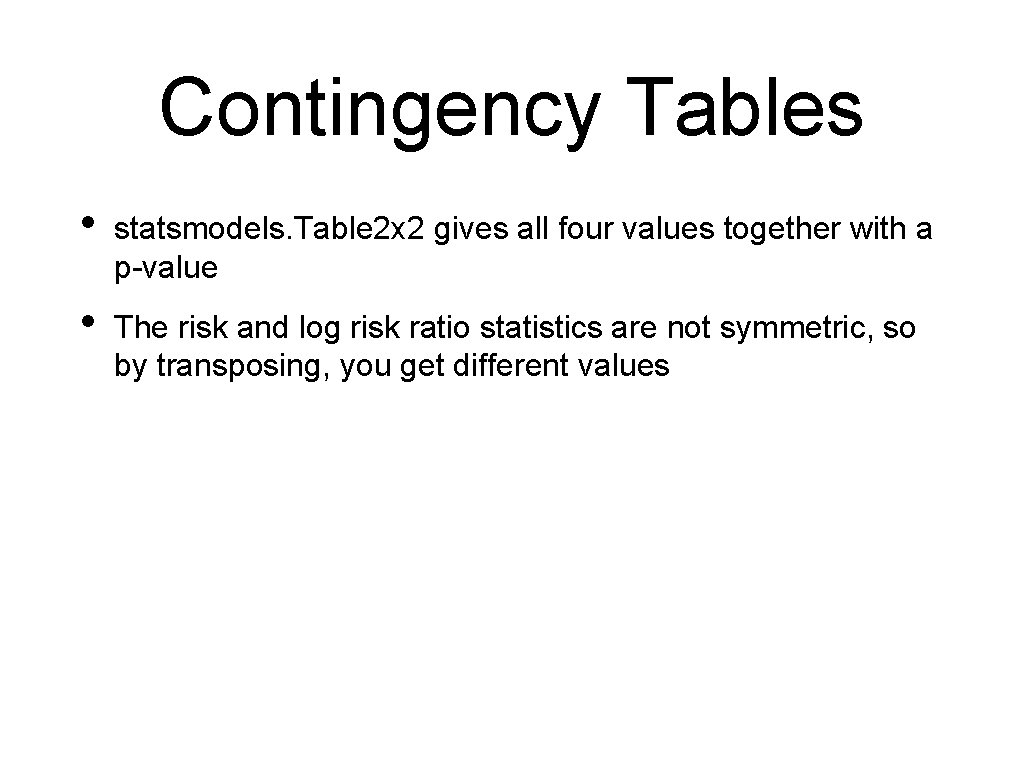
Contingency Tables • statsmodels. Table 2 x 2 gives all four values together with a p-value • The risk and log risk ratio statistics are not symmetric, so by transposing, you get different values
Contingency Tables • • For small samples, we should use Fisher's exact test • If there is no influence of the explanatory variables, then the numbers in the cells are distributed according to a hyper-geometric distribution • With Python, we can apply this even to larger samples Use fisher_exact in scipy. stats
Contingency Tables • Calling Fisher's exact method scipy. stats. fisher_exact(table)) • Output is value of the statistics and the p-value (1. 8320539419087136, 5. 032835599791868 e-07) • Again, we conclude that the difference between Aspirin and Placebo are unlikely to have happened by chance
Testing for Normality
Normality Tests • A large number of models assume that data is or close to normally distributed • If data comes from normal distribution: • • Lots of statistical tricks available If data comes from another distribution: • Maybe use "non-parametic" methods • Use tests to determine whether a given set of data is likely to come from a normal distribution • Step 1: • Use a histogram or scatter-plot of the data
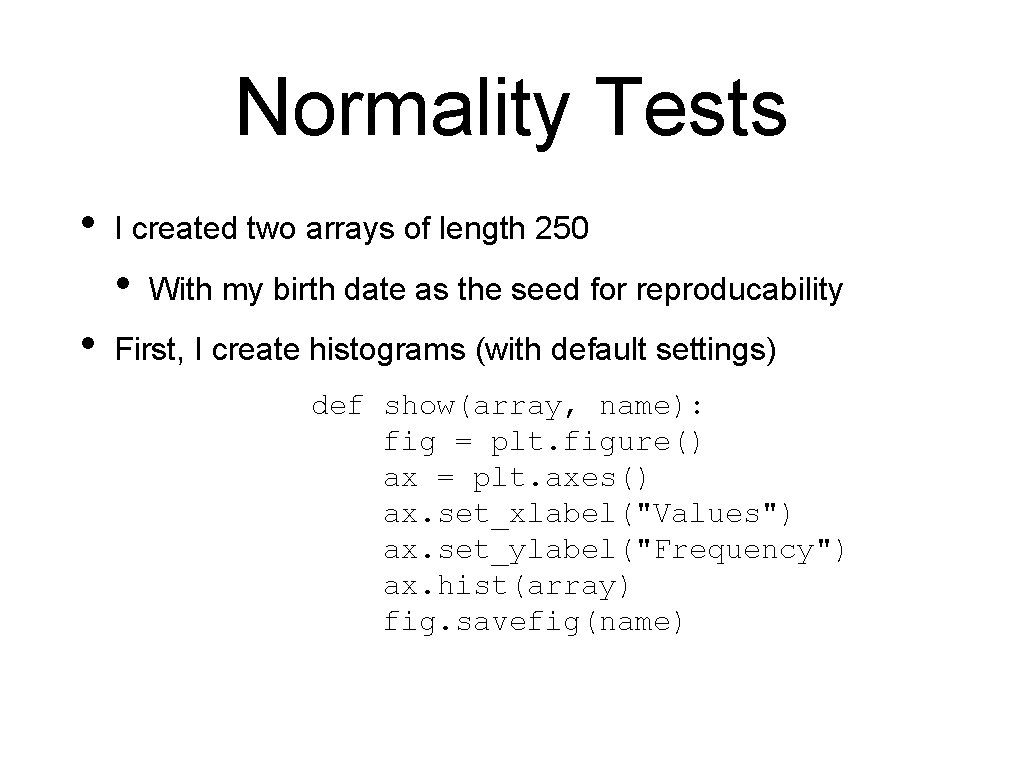
Normality Tests • I created two arrays of length 250 • • With my birth date as the seed for reproducability First, I create histograms (with default settings) def show(array, name): fig = plt. figure() ax = plt. axes() ax. set_xlabel("Values") ax. set_ylabel("Frequency") ax. hist(array) fig. savefig(name)
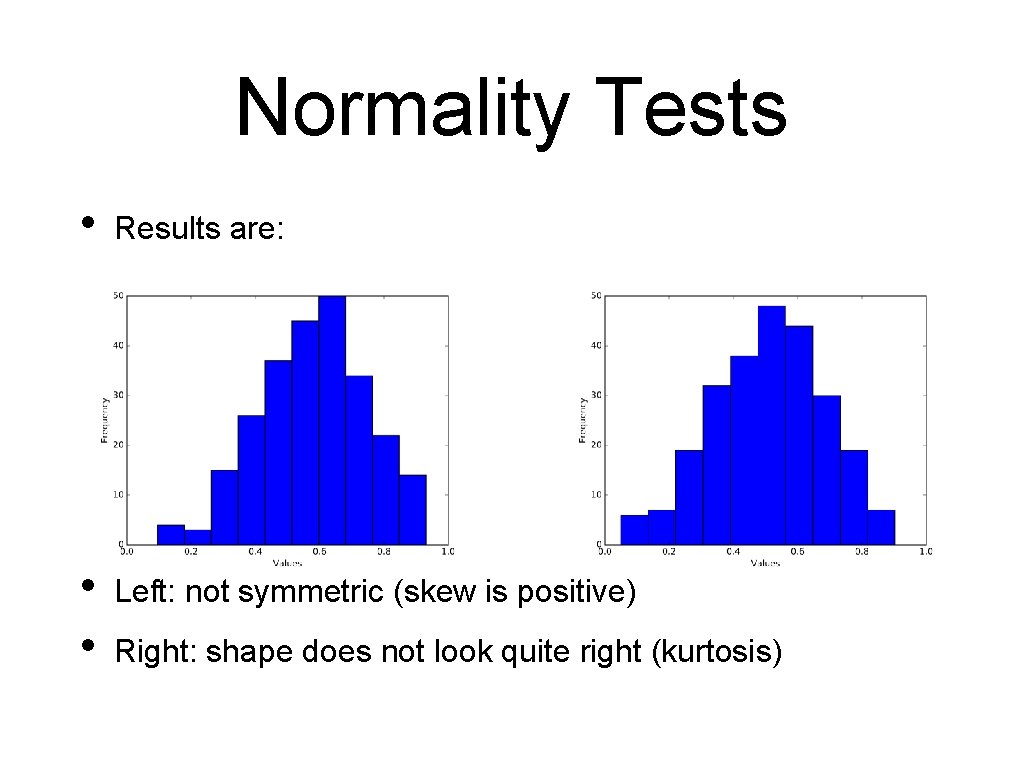
Normality Tests • Results are: • • Left: not symmetric (skew is positive) Right: shape does not look quite right (kurtosis)
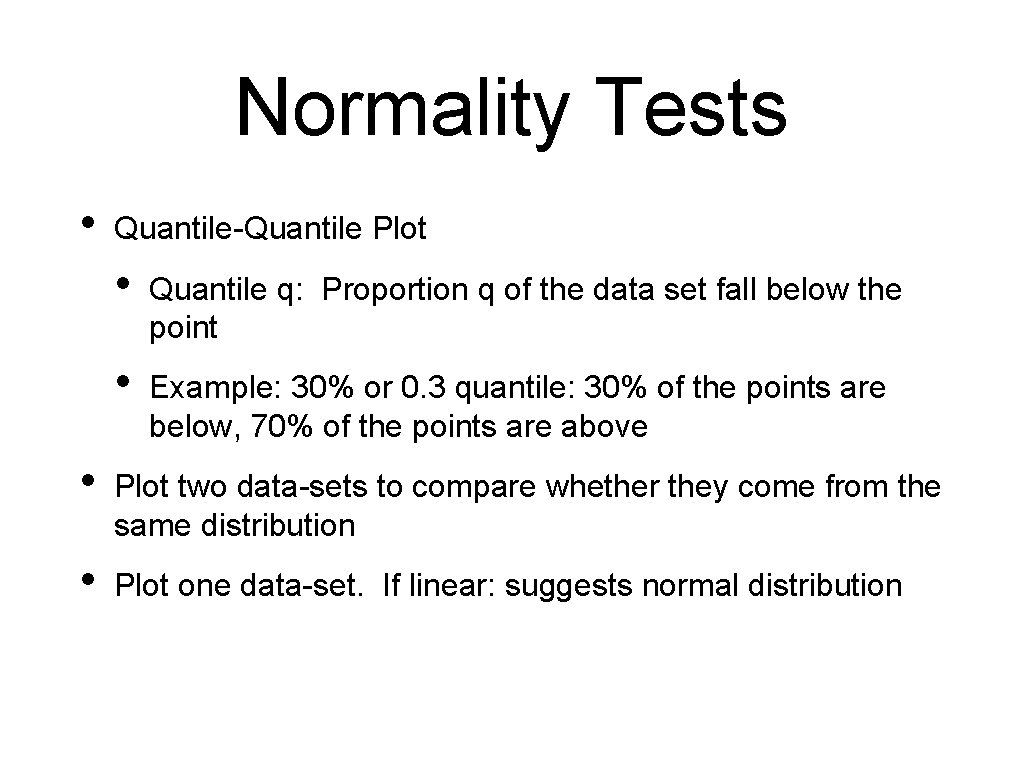
Normality Tests • Quantile-Quantile Plot • Quantile q: Proportion q of the data set fall below the point • Example: 30% or 0. 3 quantile: 30% of the points are below, 70% of the points are above • Plot two data-sets to compare whether they come from the same distribution • Plot one data-set. If linear: suggests normal distribution
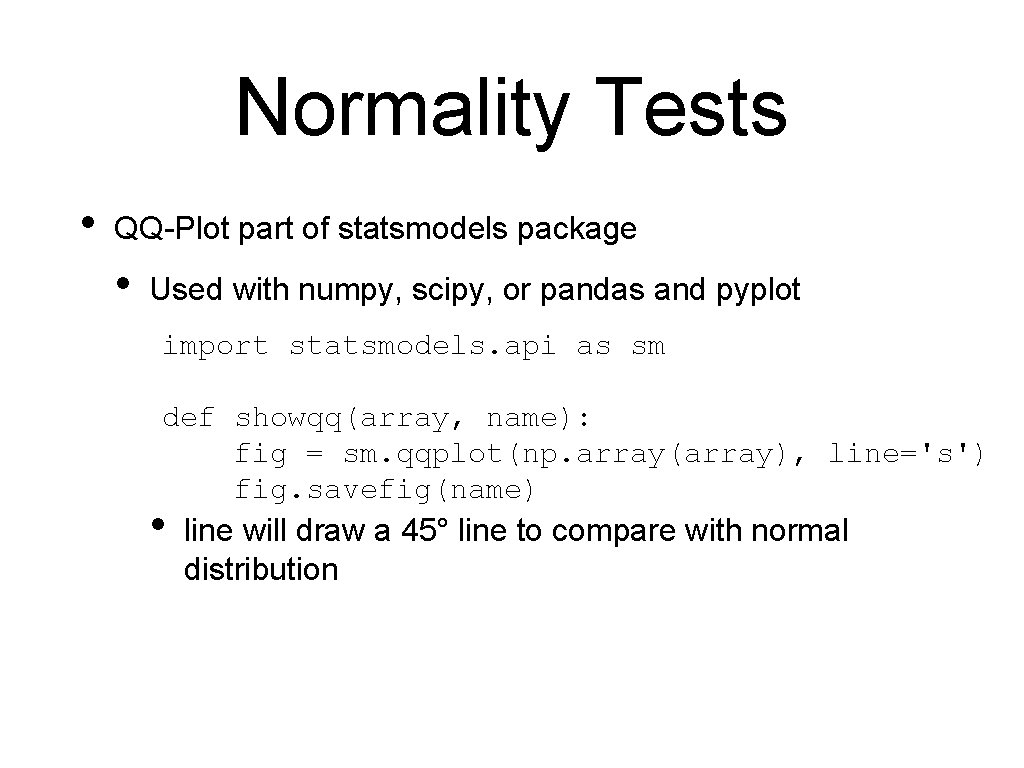
Normality Tests • QQ-Plot part of statsmodels package • Used with numpy, scipy, or pandas and pyplot import statsmodels. api as sm def showqq(array, name): fig = sm. qqplot(np. array(array), line='s') fig. savefig(name) • line will draw a 45° line to compare with normal distribution
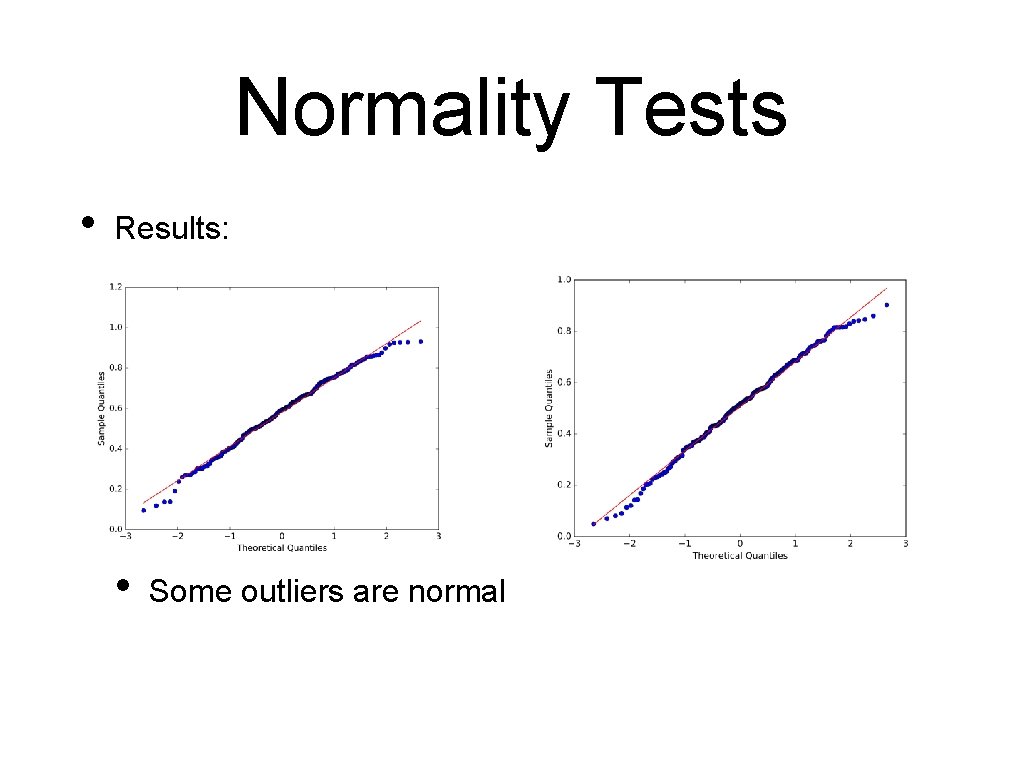
Normality Tests • Results: • Some outliers are normal
Normality Tests • Statistical tests: • • Takes data and calculates a test statistics • Calculates the probability of the test value assuming that a null hypothesis is true • If the probability is too small, concludes that the null hypothesis is false In Scipy: • • • Null hypothesis: "Distribution is normal" Returns a p-value If p-value is smaller than : reject the Null Hypothesis, otherwise see it supported by data
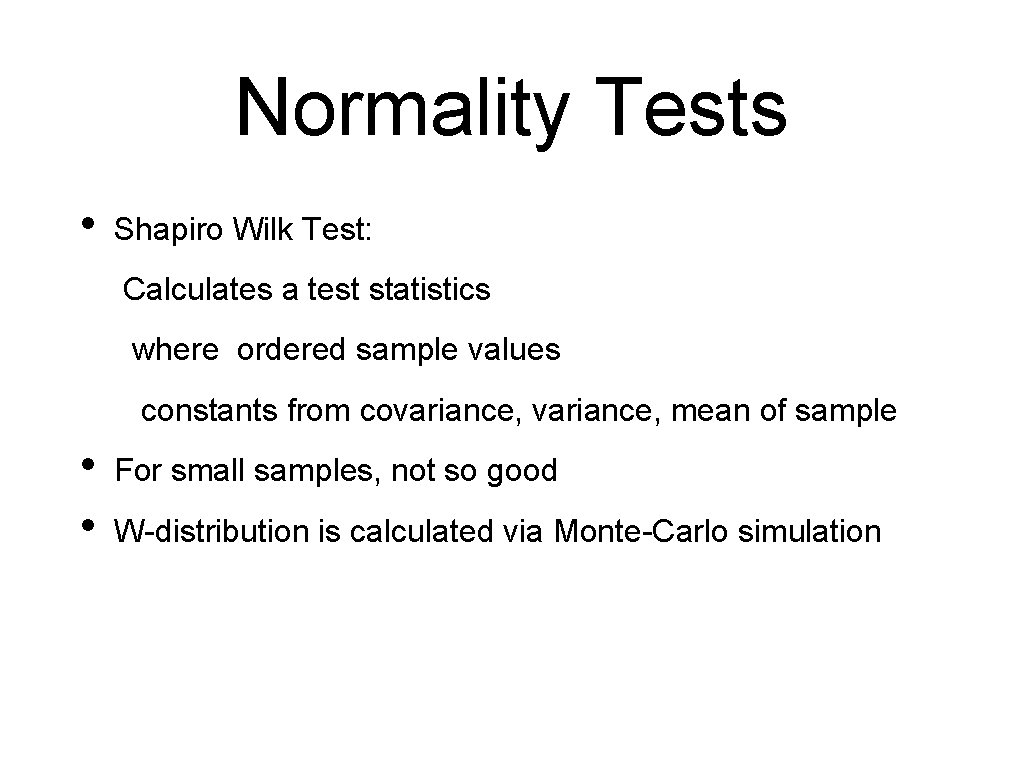
Normality Tests • Shapiro Wilk Test: Calculates a test statistics where ordered sample values constants from covariance, mean of sample • • For small samples, not so good W-distribution is calculated via Monte-Carlo simulation
Normality Tests • Use scipy. stats. shapiro • • Input is the data Output is the W-value and the p-value import scipy. stats def getshapiro(array): return scipy. stats. shapiro(array)
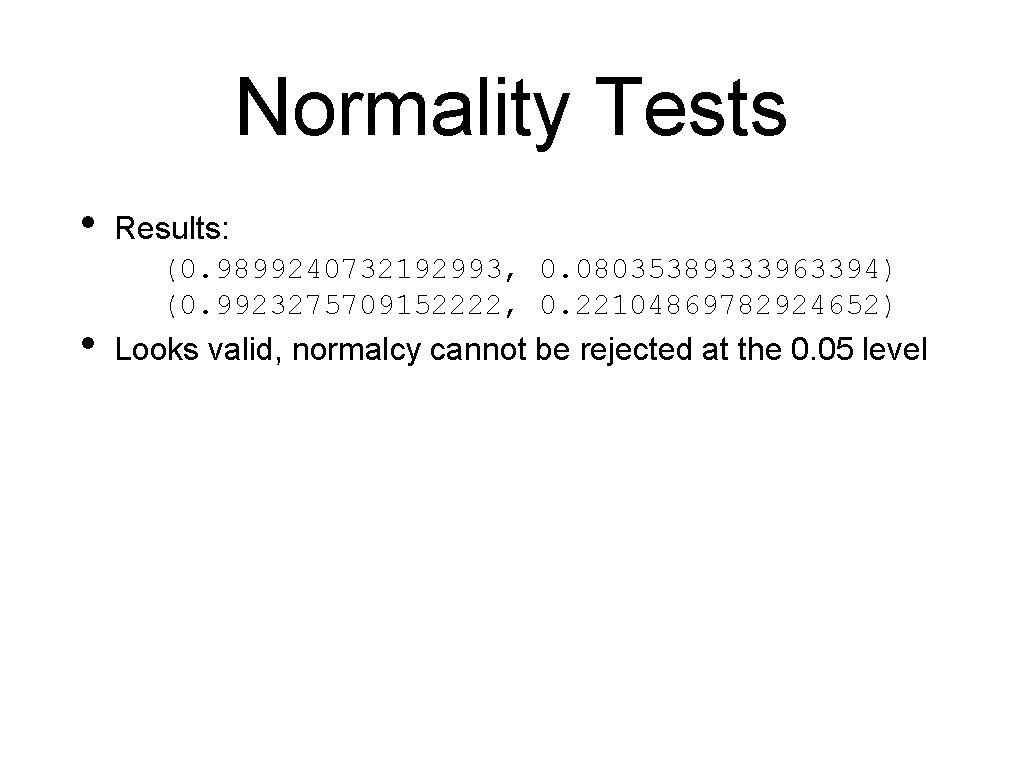
Normality Tests • • Results: (0. 9899240732192993, 0. 08035389333963394) (0. 9923275709152222, 0. 22104869782924652) Looks valid, normalcy cannot be rejected at the 0. 05 level
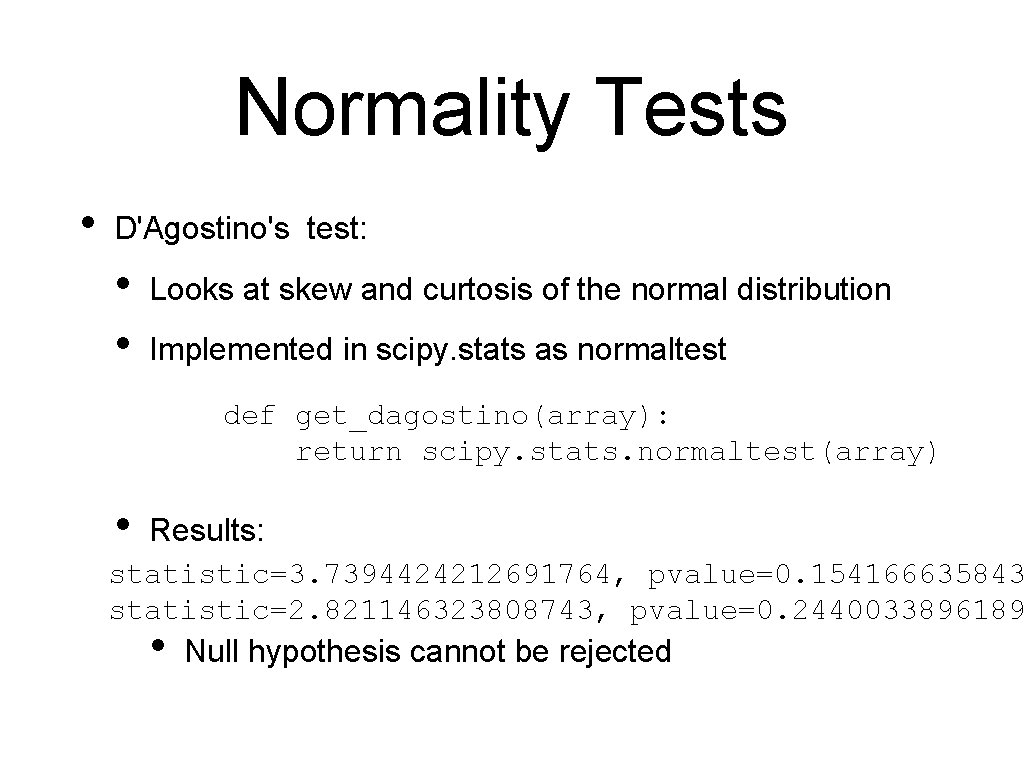
Normality Tests • D'Agostino's test: • • Looks at skew and curtosis of the normal distribution Implemented in scipy. stats as normaltest def get_dagostino(array): return scipy. stats. normaltest(array) • Results: statistic=3. 7394424212691764, pvalue=0. 154166635843 statistic=2. 821146323808743, pvalue=0. 2440033896189 • Null hypothesis cannot be rejected

Normality Tests • Anderson Darling • Comes from the Kolmogorov Smirnov test • KS tests for the distance between the cumulative probability of two samples or one sample with a reference distribution
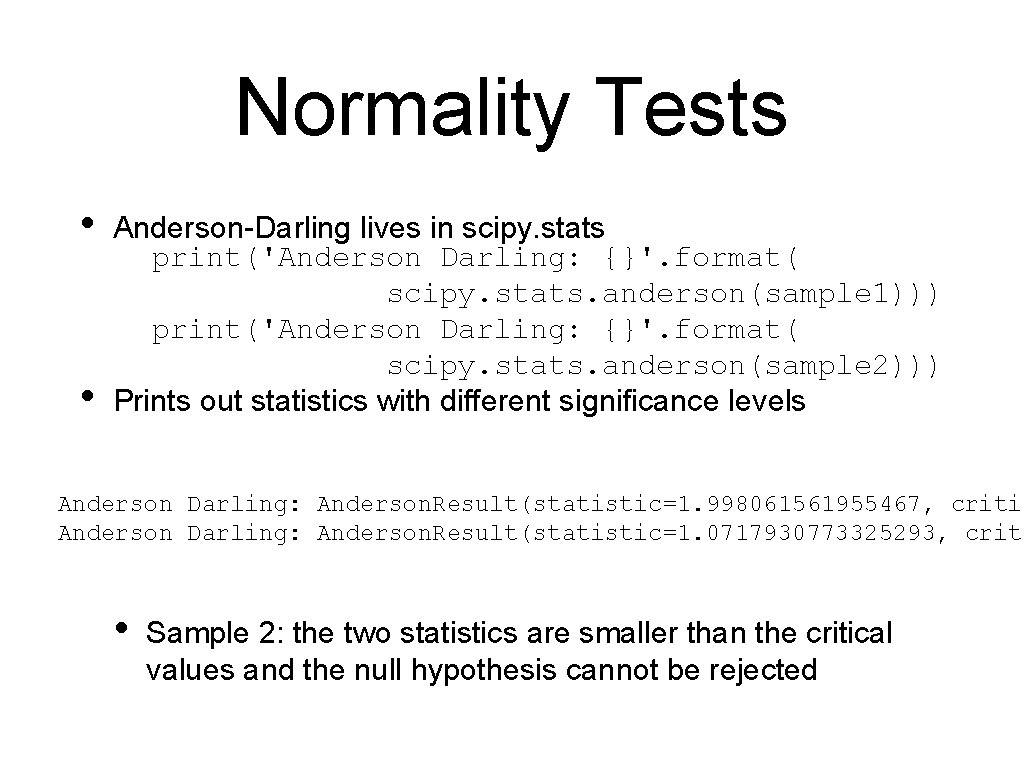
Normality Tests • • Anderson-Darling lives in scipy. stats print('Anderson Darling: {}'. format( scipy. stats. anderson(sample 1))) print('Anderson Darling: {}'. format( scipy. stats. anderson(sample 2))) Prints out statistics with different significance levels Anderson Darling: Anderson. Result(statistic=1. 998061561955467, critic Anderson Darling: Anderson. Result(statistic=1. 0717930773325293, criti • Sample 2: the two statistics are smaller than the critical values and the null hypothesis cannot be rejected
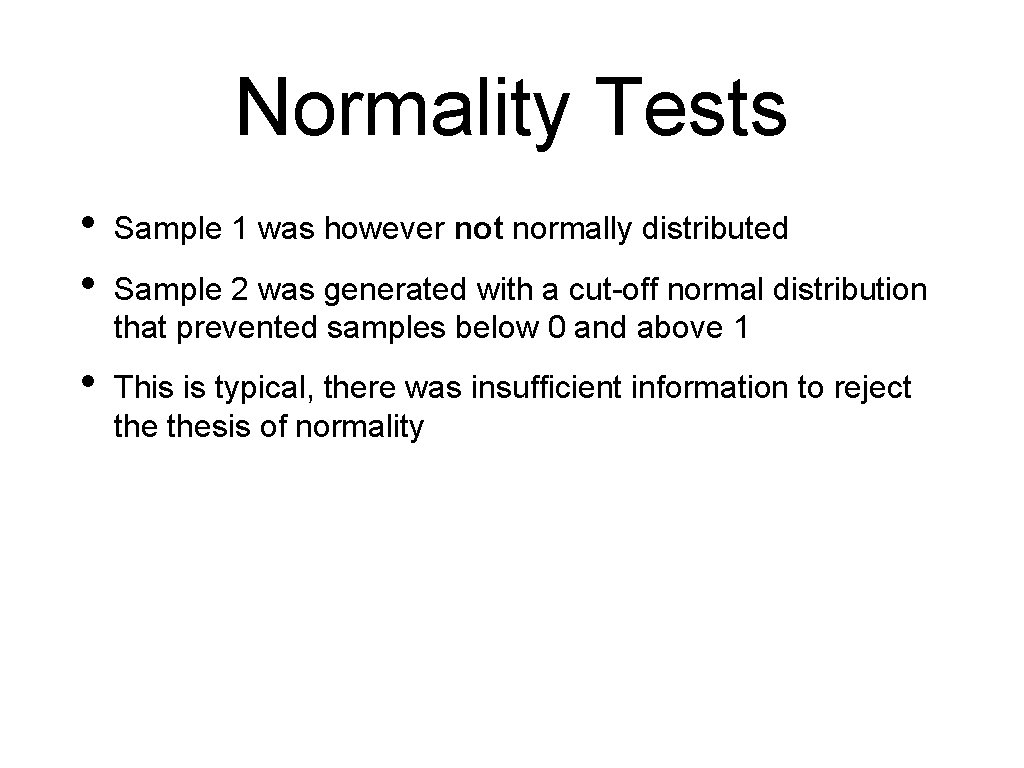
Normality Tests • • Sample 1 was however not normally distributed • This is typical, there was insufficient information to reject thesis of normality Sample 2 was generated with a cut-off normal distribution that prevented samples below 0 and above 1
Limitations
Limitations • With a p value of 0. 05, one in twenty tests is likely to give us a false positive • Rate of false negatives is also around that
Limitations • Not being able to reject the zero hypothesis does not mean that the hypothesis is wrong
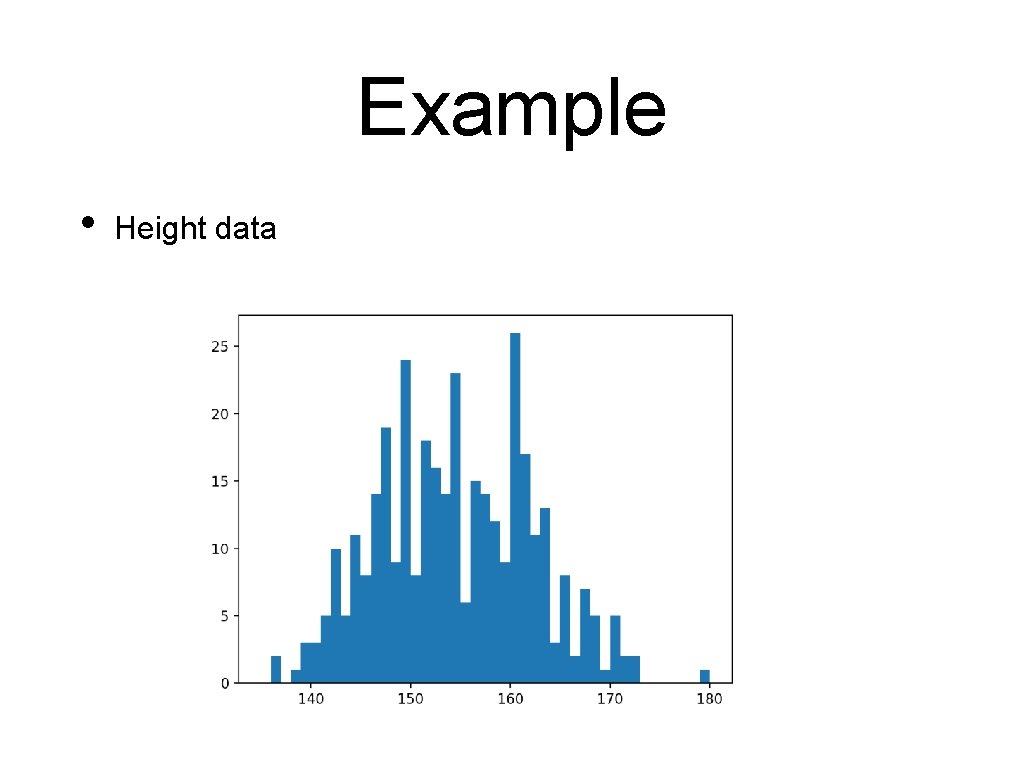
Example • Height data
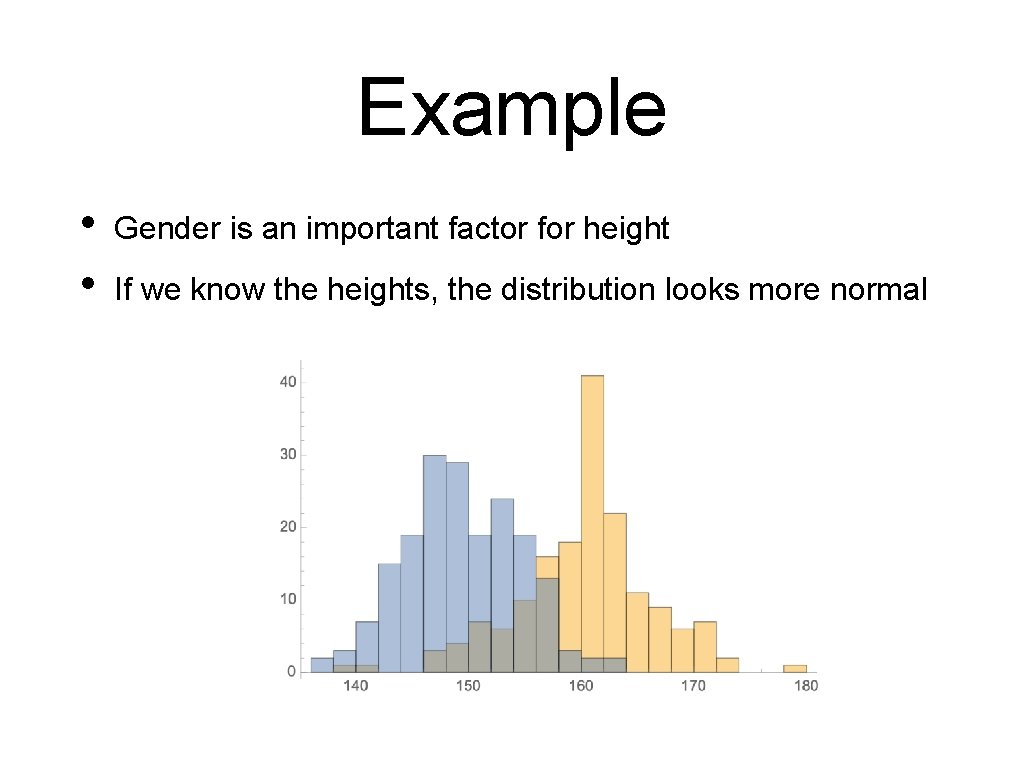
Example • • Gender is an important factor for height If we know the heights, the distribution looks more normal
Example • When we apply normality tests: • • • Female is normally distributed Male is not normally distributed according to Anderson Complete population is normally distributed
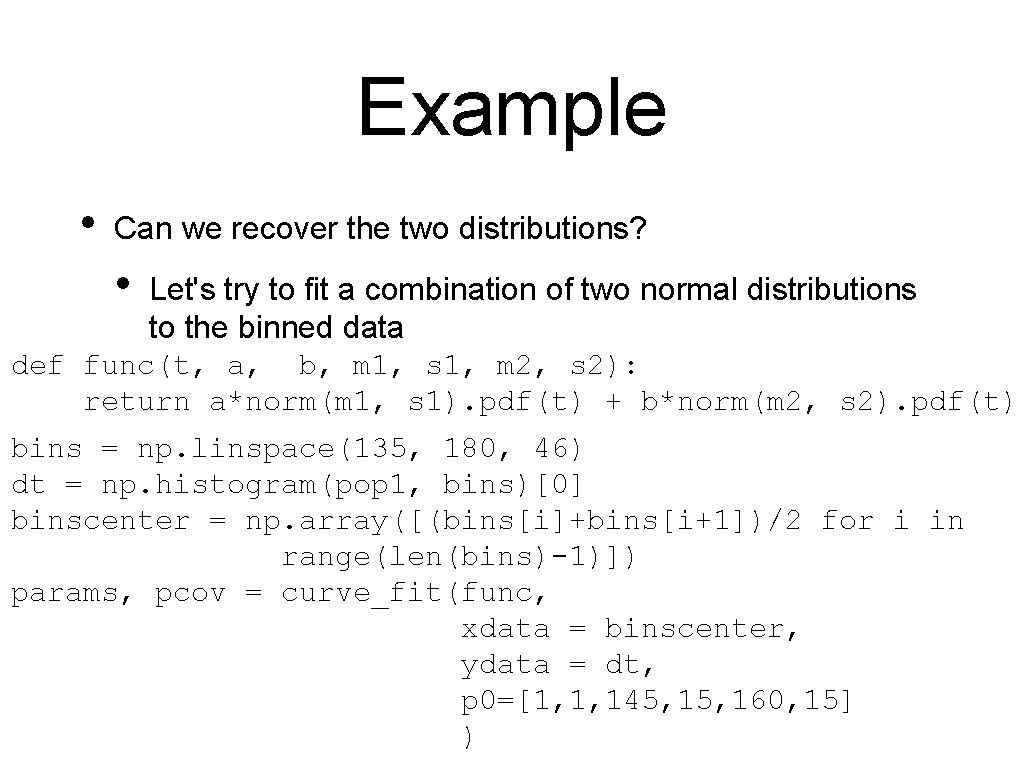
Example • Can we recover the two distributions? • Let's try to fit a combination of two normal distributions to the binned data def func(t, a, b, m 1, s 1, m 2, s 2): return a*norm(m 1, s 1). pdf(t) + b*norm(m 2, s 2). pdf(t) bins = np. linspace(135, 180, 46) dt = np. histogram(pop 1, bins)[0] binscenter = np. array([(bins[i]+bins[i+1])/2 for i in range(len(bins)-1)]) params, pcov = curve_fit(func, xdata = binscenter, ydata = dt, p 0=[1, 1, 145, 160, 15] )
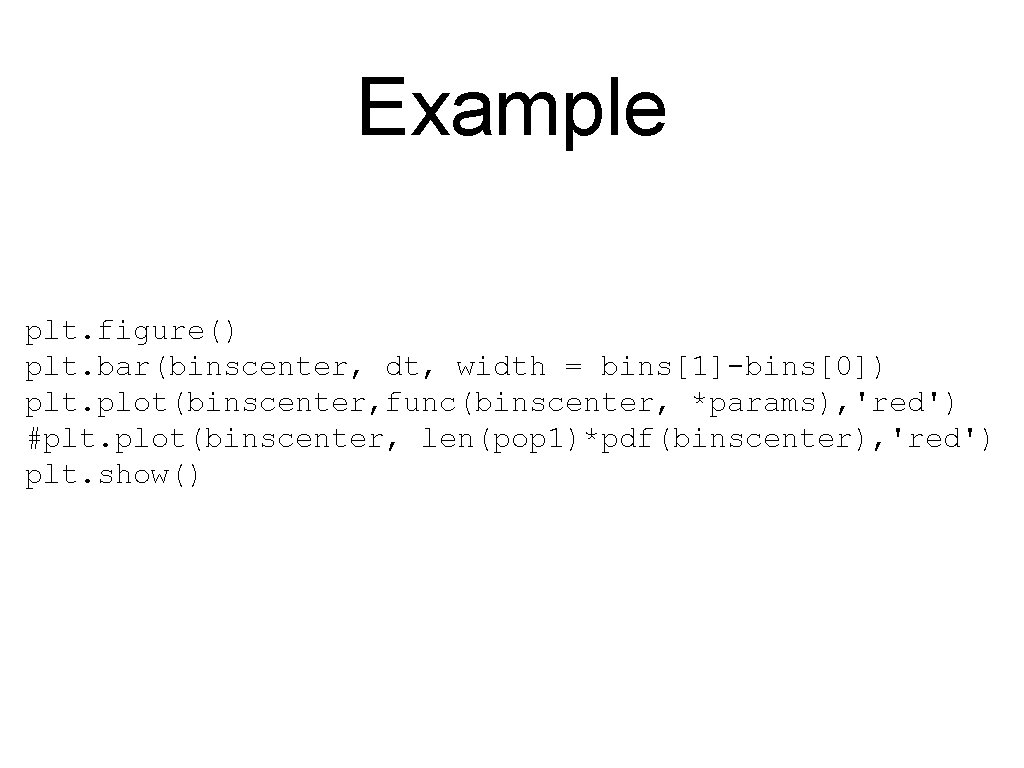
Example plt. figure() plt. bar(binscenter, dt, width = bins[1]-bins[0]) plt. plot(binscenter, func(binscenter, *params), 'red') #plt. plot(binscenter, len(pop 1)*pdf(binscenter), 'red') plt. show()
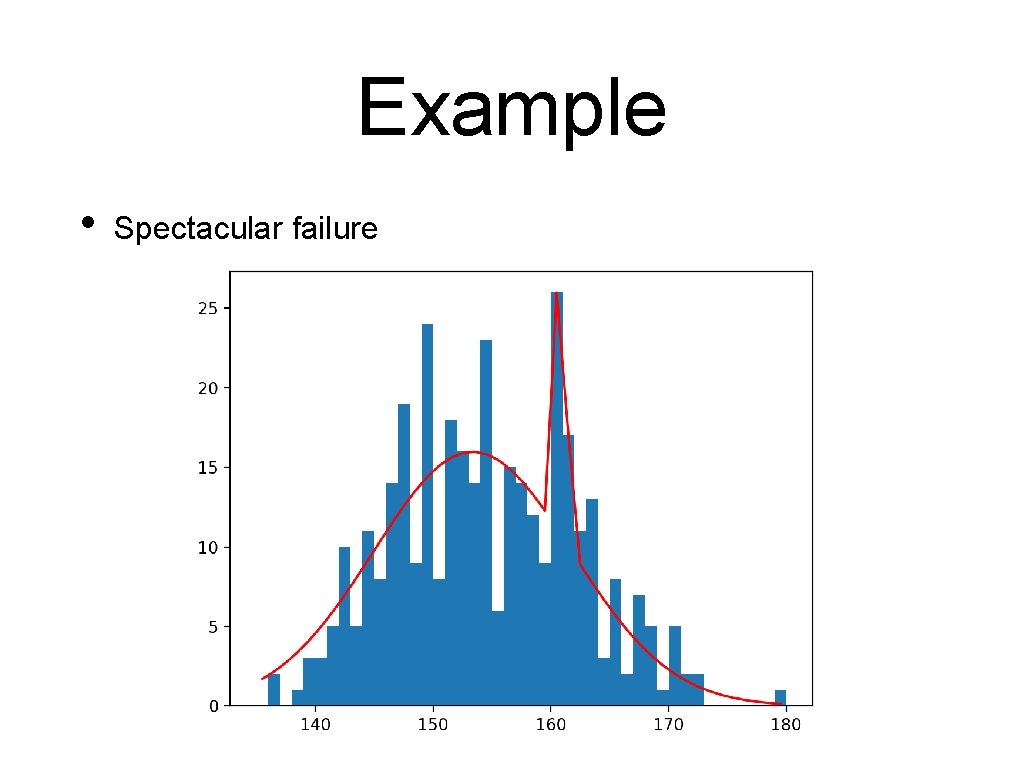
Example • Spectacular failure
Conclusions • Numpy has a very broad selection of random number generators • Scipy. stats has a very good set of implementations for many standard statistical tests • Which cannot overcome limitations in the data
Readings • Scipy Lecture notes p. 195 ff
- Slides: 82