PROBABILITY Chapter 9 Section 9 1 Review Percents

PROBABILITY Chapter 9

Section 9 -1 Review Percents and Probability

Experiment n. An activity that is used to produce data that can be observed and recorded n. Example – rolling a die n. Example - tossing a coin n. Example – drawing a card

Outcome n. The result of each trial of an experiment.

Event n. Any one of the possible outcomes or combination of possible outcomes of an experiment

Experimental Probability n. Represents an estimate of the likelihood of an event, E, or desired outcome n. P(E)= # of observations of E total # of observations
 = # of favorable outcomes # of possible outcomes")
Theoretical Probability n. P(E) = # of favorable outcomes # of possible outcomes

Sample Space n. The set of all possible outcomes of the experiment n. Tossing a coin – S = {H, T} n. Rolling a dice – S = {1, 2, 3, 4, 5, 6}

Tree Diagram n. A diagram that lists one part of an event and then adds branches to show all the outcomes involving that part of the event

Example n. In an experiment, a coin is tossed and a number cube is rolled. n Make a tree diagram beginning with the possible outcomes of the coin toss

Relative Frequency n. Compares the number of times the outcome occurs to the total number of observations

Example n. The more often you toss a coin, the closer you will come to tossing an equal number of heads and tails.

Section 9 -2 Problem Solving Skills: Simulations

Section 9 -3 Compound Events

Compound Event n. Made up of two or more simpler events n. Probability of a compound event is the probability of one event and/or another occurring
")
Probability n. The probability of a compound event is represented by P(A ∩ B) n. The probability of one event or another occurring is written P(A B)

MUTUALLY EXCLUSIVE EVENTS n. Events that cannot occur at the same time n. Example – A die is rolled. The events, getting an even number and getting an odd number are mutually exclusive.

MUTUALLY EXCLUSIVE EVENTS If two events A and B are mutually exclusive then A B=Ø and
 = P(A) + P(B)")
Mutually Exclusive Events For mutually exclusive events only: P(A B) = P(A) + P(B)

EXAMPLE – MUTUALLY EXCLUSIVE EVENTS • Suppose a die is tossed. • Let A be the event that an even number turns up • Let B be the event that an odd number turns up, then

Mutually Exclusive Events A = {2, 4, 6}, and B = {1, 3, 5} A B=Ø
 =")
THEOREM If A and B are not mutually exclusive events, then P(A B) = P(A) + P(B) – P(A B)

Example n. A card is drawn at random from a deck of 52 playing cards. Find the probability that the card is a heart or an ace. n. A = card is a heart n. B = card is an ace n. P(A B) = P(A) + P(B) – P(A B)

Section 9 -4 Independent and Dependent Events

INDEPENDENT EVENTS n. Two events are independent if the result of the second event is not affected by the result of the first event.

INDEPENDENT EVENTS The events A and B are independent if, and only if P(A B) = P(A) • P(B)

Example n. A bag contains 3 red marbles, 4 green marbles and 5 blue marbles. One marble is taken at random and then replaced. Then another marble is taken at random. n. Find the probability that the 1 st marble is red and the 2 nd is blue.

DEPENDENT EVENTS n. Two events are dependent if the result of one event is affected by the result of another event
 = P(A)")
DEPENDENT EVENTS The result of event A affects event B P(A B) = P(A) • P(B, given that A occurred) P(A) • P(B|A)

Example n. A bag contains 3 red marbles, 4 green marbles and 5 blue marbles. One marble is taken at random and is not replaced. Then another marble is taken at random. n Find the probability that the 1 st marble is red and the 2 nd is blue.

Section 9 -5 Permutations and Combinations

Fundamental Counting Principle n. If there are two or more stages of an activity, the total number of possible outcomes is the product of the number of possible outcomes for each stage
.")
Example n. At a pizza place there are three sizes (Large, Medium, and Small). There also five choices of toppings (cheese, pepperoni, sausage, onions, peppers).

n. How many different pizzas with one topping could a customer order? n. What is the probability that a customer will order a Medium pizza with sausage?

Example n. A store sells shirts in 8 sizes. For each size, there is a choice of 5 colors. For each color, there is a choice of 6 patterns. How many different shirts does the store have?

n. What is the probability that a customer will buy a large shirt that is blue with stripes?
 n(n-1)(n-2)…(2)(1)")
PERMUTATION An arrangement of items in a particular order. n! (n factorial) n(n-1)(n-2)…(2)(1)

FACTORIAL 5! = 5 x 4 x 3 x 2 x 1 0! = 1

EXAMPLE PERMUTATIONS How many different “ways” can the letters a, b, and c be arranged if all the letters are used? 3! (a, b, c), (a, c, b), (b, c, a), (b, a, c), (c, a, b), (c, b, a)

PERMUTATIONS NO REPETITIONS Uses only a part of the set without repetitions n. Pr = n!__ (n-r)! n = number of items r = number of items taken at a time

EXAMPLE PERMUTATIONS How many different “ways” can the letters a, b, c, and d be arranged if only three different letters are used? 4!__ (4 - 3)!

ANSWER How many different “ways” can the letters a, b, c, and d be arranged if only three different letters are used? 4! = 24

COMBINATION An arrangement of items in which order is not important. n. Cr = n!__ (n-r)!r!
!r! nn = number of different items nr")
COMBINATION n. C r = n!__ (n-r)!r! nn = number of different items nr = number of items taken at a time

EXAMPLE COMBINATIONS How many different ways can a 2 -person committee be chosen from 8 people if there are no restrictions? 8!____ (8 - 2)!2!

EXAMPLE COMBINATIONS n. A random drawing is held to determine which 2 of the 6 members of the math club will be sent to a regional math contest. n. How many different pairs of two could be sent to the contest?

EXAMPLE COMBINATIONS n. How many combinations of three letters could you make out of the letters a, b, c, d, e, and f?

EXAMPLE COMBINATIONS n. A popular touring band has 20 songs. How many combinations of songs can the band play in their opening 3 -song set?

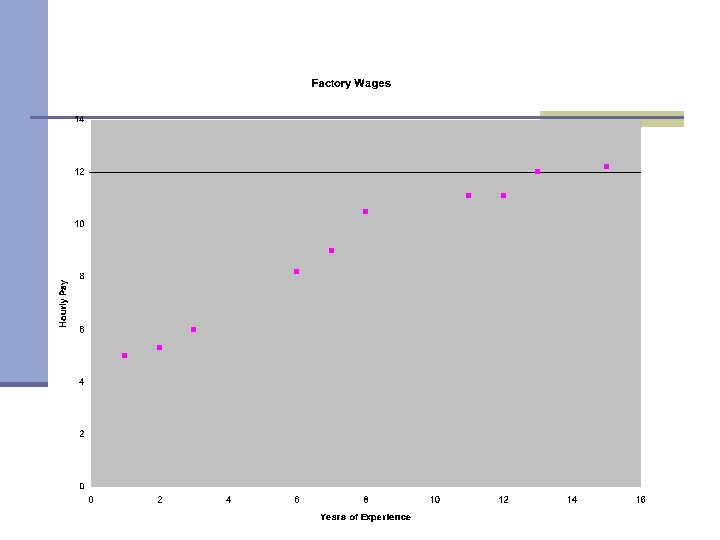
Section 9 -6 Scatter Plots and Boxplots

SCATTER PLOT A type of visual display showing a relationship between two sets of data, represented by unconnected points on a grid.

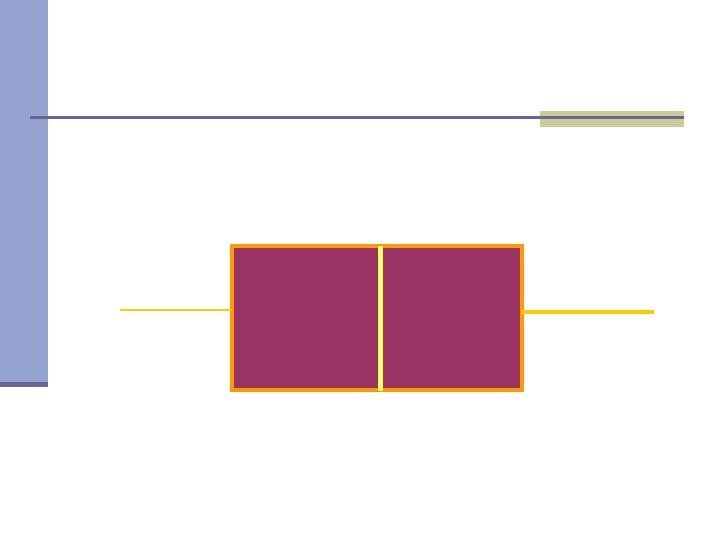
BOX-AND-WHISKER PLOT A type of visual display showing how data are dispersed around a median. It does not show specific items in the data. but

BOX-AND-WHISKER PLOT It shows the median and the extremes of a set of data. The lower half of the data, called the lower quartile, and the median of the upper half called the upper quartile.

END
- Slides: 55