Probability Chapter 5 Chapter Outline The Normal Curve

Probability Chapter 5

Chapter Outline The Normal Curve Sample and Population Probability Normal Curves, Samples and Populations

Imgredients for Inferential Statistics Ch. 4 Inferential Statistics: Allow us to draw conclusions about theoretical principles that go beyond the group of participants in a particular study Make inferences decisions about research findings employing probability Sample vs. Populations
: Entire set of things of interest")
Sample vs. Population A population (µ, �� ): Entire set of things of interest -All students at TAMIU -Entire population of Laredo -Entire piggy bank of pennies A sample (x , s): Subset of population from which you actually have information -25 students chosen at random answer questionnaire -100 people from Laredo answering questionnaire -A handful of pennies

Sample vs. Population: The larger Group from which sample is drawn Sample: Relatively Small number of instances are studied to make inferences about a larger group from which they were drawn

Why Samples Instead of Populations Are Studied More practical to obtain information from a sample than from the entire population. The goal of research is to make generalizations or predictions about populations or events in general. Much of social and behavioral research is conducted by evaluating a sample of individuals who are representative of a population of interest.

Methods of Sampling Random Selection method of choosing a sample in which each individual in the population has an equal chance of being selected e. g. , using a random number table, =rand()*any number Haphazard Selection method of selecting a sample of individuals to study by taking whoever is available or happens to be first on a list This method of selection can result in a sample that is not representative of the population.

Sample vs. Populations Population Parameters μ, σ2, σ, of a population Usually unknown: Can be estimated from sample of the population Sample Statistics M, S 2, S computed from sample calculated from known information

Probability
 proportion of successful events for a FINITE")
Probability Ø Relative frequency: Observed (a sample) proportion of successful events for a FINITE sample of trials (what you get)! Toss a coin 50 times: Outcome: 27 heads & 23 tails. Relative Frequency of heads is: 27/50 = 54% Ø Long-run relative-frequency: The proportion of a particular outcome that you would get if the experiment were repeated infinite number of times (In theory 50 -50)

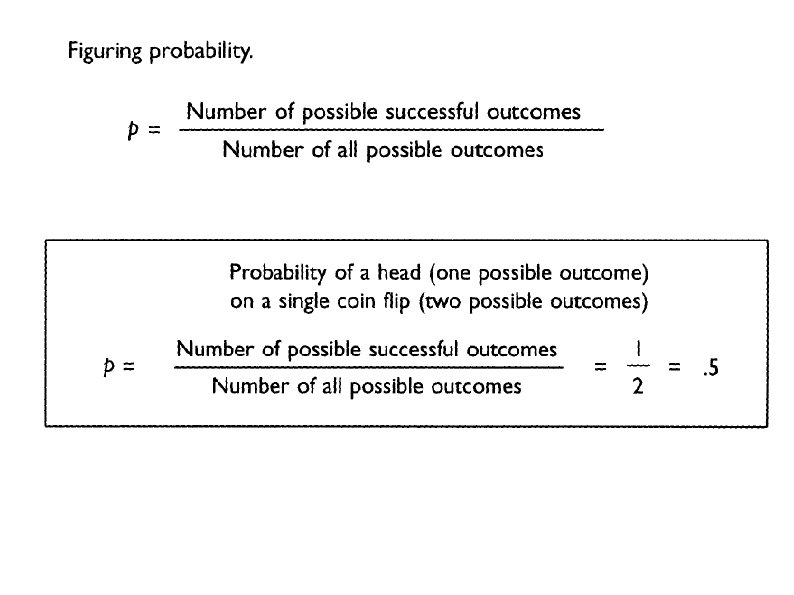
Probability p symbol for probability Fraction: ½ = There is a one out of two chances that a coin turns up heads Proportion: . 5 = The probability of a coin turning up heads is. 50. Percentage: (Proportion*100) = There is 50% chance that a coin lands tails Chance level: There is a 50% chance that you will obtain a C in this class (or 50 times out of 100).

Range of Probabilities Probabilites: between 0 and +1 Event with p = 0 has no chance of happening. Event with p = 1 has a 100% chance of happening

Probability: How likely it is to happen p = 0 unlikely to happen p = 1(100%) will always happen p =. 8 likely to happen 80% of the times p =. 01 likely to happen 1% of the times p =. 05 likely to happen 5% of the times


Probability as p <. 01 Probability as p <. 0001 Less than 1 in 1000 Less than 1 in 10, 0000 Probability as p <. 000001 Less than 1 in 1000, 000

Probability and Significance p <. 05 This result is so extreme or so unusual (top 5%) that chance cannot explain it

Probability and the Normal Distribution The normal distribution can also be thought of as a probability distribution The percentage of scores between two Z scores is the same as the probability of selecting a score between those two Z scores.

Figuring Probability You have a jar that contains 100 jelly beans. 9 of the jelly beans are green. The probability of picking a green jelly bean would be 9 (# of successful outcomes) = 9% 100 (# of possible outcomes)

x

Probability Problems A statistics class has 500 students. 150 of these students are seniors. If you were to choose a student at random from this class, what is the probability of choosing one senior student? 150/500 = p =. 3 or 30% probability What is the probability of drawing an ace from a deck of 52 playing cards? p = 4/52 = 1/13 or. 077 or 8%

Probability Problems A child has the following coins in his pocket: 2 dimes, 1 nickel, 1 quarter, ½ dollar, & 1 dollar coin What is the probability of choosing a dime? 2/6 = p =. 33 or 33% chance

Probability Problems A child has the following coins in his pocket: 1 dime, 1 nickel, 1 quarter, ½ dollar, & 1 dollar coin Probability of choosing a dime OR a nickel? 2/5 = p =. 4 or 40% Probability of choosing a dime, a nickel OR a quarter? 3/5 = p =. 6 or 60% probability

Probability Problems During the 1 st quarter of the year, in a certain city there were born: 145 boys and 135 girls in January 142 boys and 136 girls in February 152 boys and 140 girls in March Probability that a boy is born, for the month of: January February March

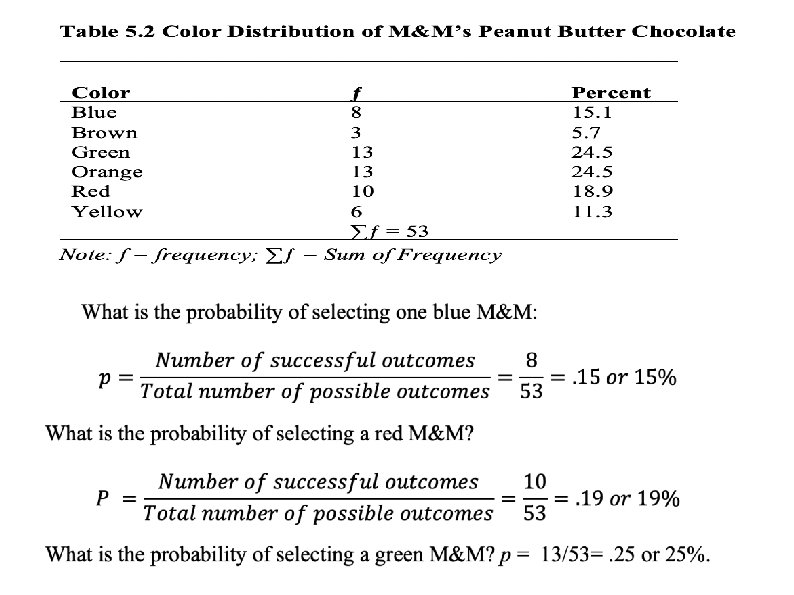
Probability of obtaining a blue OR brown M&Ms? p =. 151 +. 057 =. 21 or 21% chance Probability of obtaining a blue AND a yellow M&Ms? p =. 151*. 113 =. 017 or 1. 7% chance

Probability of randomly selecting an IQ greater than 117? 1. Z-score for the IQ of 117 = 117– 100/16 = 17/16 = +1. 06. 2. Table A. 1, cut-off z-score of +1. 06 = 35. 54% or. 3554. There is a 14. 46% curve area left to the right of that z-score 3. Probability of selecting an IQ greater than 117 is. 14 or 14% of the time.

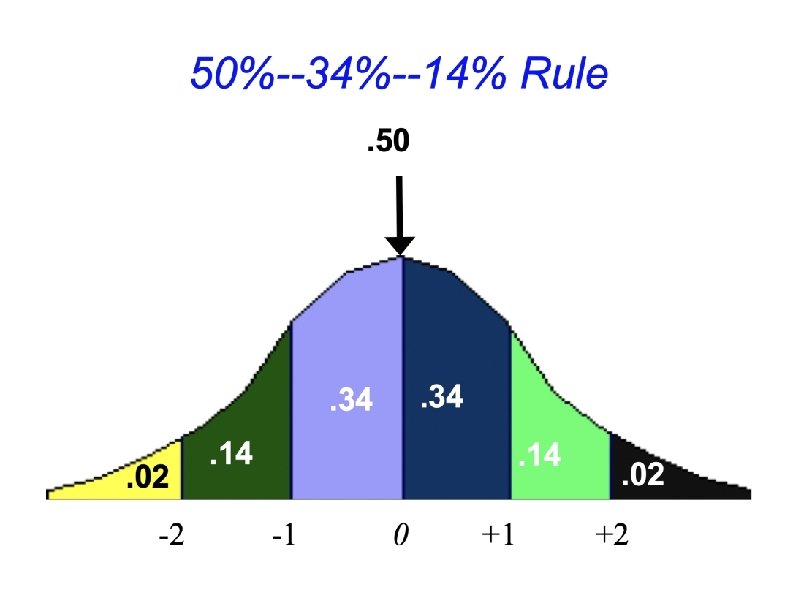
KEY POINTS In behavioral and social science research, scores on many variables approximately follow a normal curve which is a bell-shaped, symmetrical, and unimodal distribution. 50% of the scores on a normal curve are above the mean, 34% of the scores are between the mean and 1 standard deviation above the mean, and 14% of the scores are between 1 standard deviation above the mean and 2 standard deviations above the mean. A normal curve table is used to determine the percentage of scores between the mean and any particular Z score and the percentage of scores in the tail for any particular Z score. This table can also be used to find the percentage of scores above or below any Z score and to find the Z score for the point where a particular percentage of scores begins or ends. A population is a group of interest that cannot usually be studied in its entirety and a sample is a subgroup that is studied as representative of this larger group. Population parameters are the mean, variance, and standard deviation of a population, and sample statistics are the mean, variance, and standard deviation of a sample. Probability (p) is figured as the proportion of successful outcomes to total possible outcomes. It ranges from 0 (no chance of occurrence) to 1 (100% chance of occurrence). The normal curve can be used to determine the probability of scores falling within a particular range of values.
- Slides: 30