
Probabilistic Predictions Prateek Singh Singhpr Things We Will
Probabilistic Predictions Prateek Singh @Singhpr
Things We Will Not Talk About* § Scrum § Kanban § XP § Velocity § Stand Ups and Retrospectives § Continuous Integration/Continuous Delivery § Le. SS/DAD/SAFE etc § Anything that is traditionally considered “Agile” *Unless there is a direct question about it. @Singhpr
Things We Will Talk About § Weather (Hurricanes in particular) § Led Zeppelin § Commuting to work § Football § And if all that does not sound like enough fun, we will be rolling dice… @Singhpr
Probabilistic World View § These examples will (hopefully) show that our world is not deterministic. § Once we agree on the probabilistic nature of the world, we will try to tackle the problem of making predictions. § Is my wife going to buy at least one thing from Amazon today? (66% Yes) @Singhpr
Led Zeppelin • If I played a random Led Zeppelin song – How long will the song last? • How would you go about answering that question? • What data would you need? @Singhpr
Total Number of catalogued songs = 107 Total Playtime For 107 songs = 19 hrs, 53 minutes Average Song Length = 5 mins, 7 Seconds @Singhpr
Commuting To Work @Singhpr
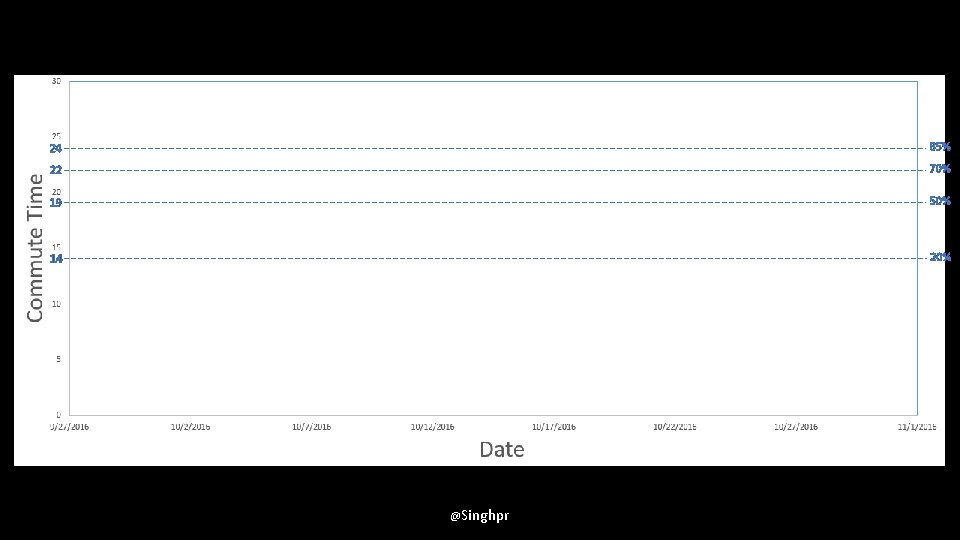
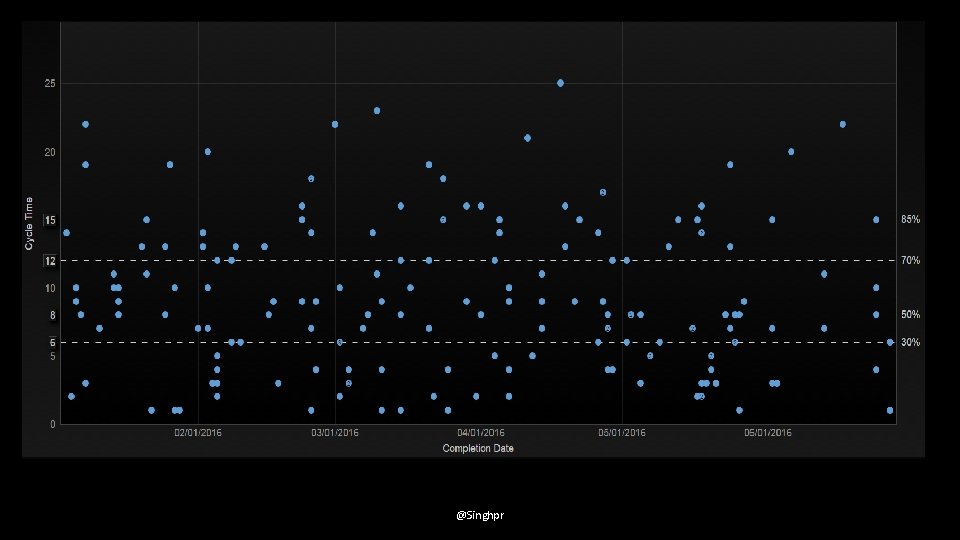
24 85% 22 70% 19 50% 14 20% @Singhpr
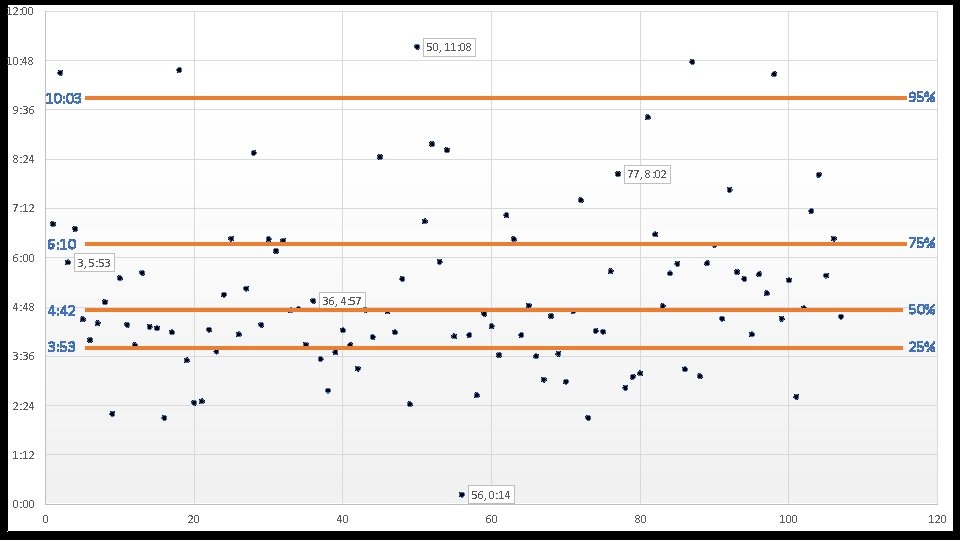
12: 00 50, 11: 08 10: 48 9: 36 95% 10: 03 8: 24 77, 8: 02 7: 12 6: 00 4: 48 3: 36 75% 6: 10 3, 5: 53 36, 4: 57 4: 42 50% 3: 53 25% 2: 24 1: 12 56, 0: 14 0: 00 0 20 40 60 80 100 120
@Singhpr
All That Is Well And Good But… § We are often asked to predict multiple items. § My feature/project/product is made up of 10100 work items. When will that be done? § How many work-items/stories/tasks can I get done in the next month? @Singhpr
Is This Where We Talk About Football? @Singhpr
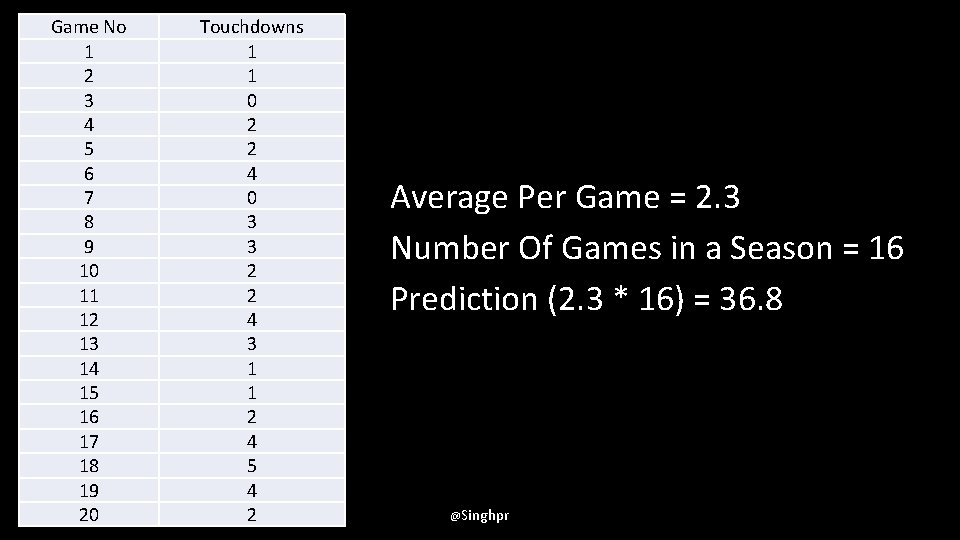
Game No 1 2 3 4 5 6 7 8 9 10 11 12 13 14 15 16 17 18 19 20 Touchdowns 1 1 0 2 2 4 0 3 3 2 2 4 3 1 1 2 4 5 4 2 Average Per Game = 2. 3 Number Of Games in a Season = 16 Prediction (2. 3 * 16) = 36. 8 @Singhpr
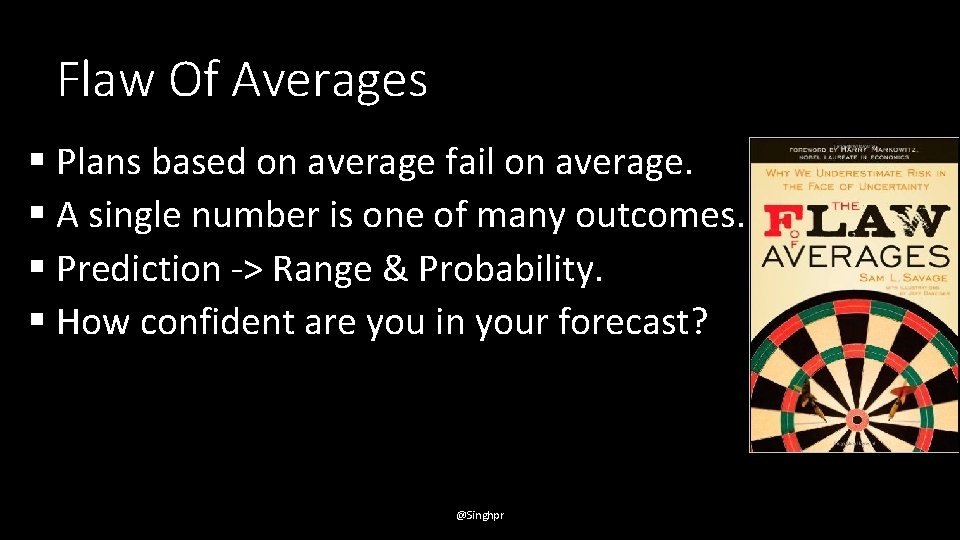
Flaw Of Averages § Plans based on average fail on average. § A single number is one of many outcomes. § Prediction -> Range & Probability. § How confident are you in your forecast? @Singhpr

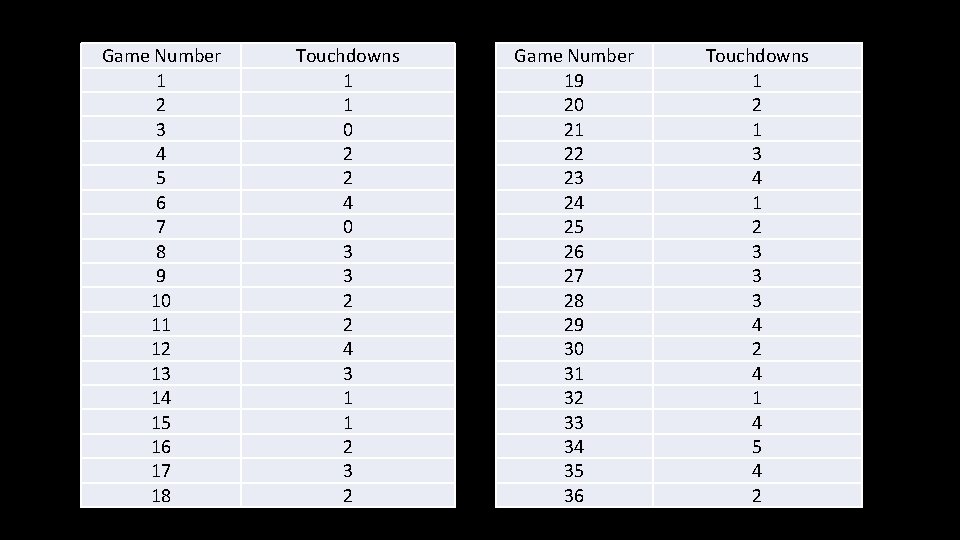
Game Number 1 2 3 4 5 6 7 8 9 10 11 12 13 14 15 16 17 18 Touchdowns 1 1 0 2 2 4 0 3 3 2 2 4 3 1 1 2 3 2 Game Number 19 20 21 22 23 24 25 26 27 28 29 30 31 32 33 34 35 36 Touchdowns 1 2 1 3 4 1 2 3 3 3 4 2 4 1 4 5 4 2
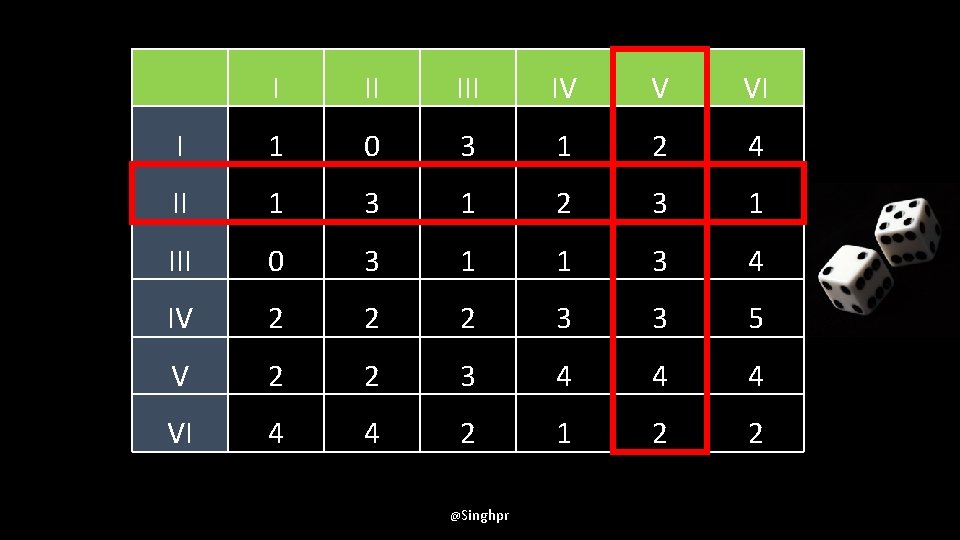
I II IV V VI I 1 0 3 1 2 4 II 1 3 1 2 3 1 III 0 3 1 1 3 4 IV 2 2 2 3 3 5 V 2 2 3 4 4 4 VI 4 4 2 1 2 2 @Singhpr
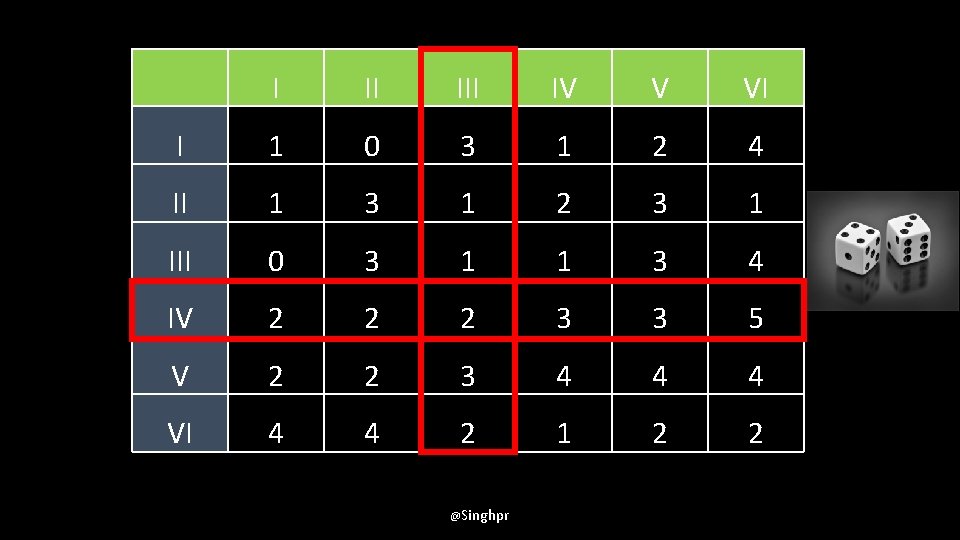
I II IV V VI I 1 0 3 1 2 4 II 1 3 1 2 3 1 III 0 3 1 1 3 4 IV 2 2 2 3 3 5 V 2 2 3 4 4 4 VI 4 4 2 1 2 2 @Singhpr
Monte Carlo Exercise § Assign one die to the horizontal and the other to the vertical axis. § Roll and note down the result from the grid. § Repeat for 16 rolls (1 for each game in the season) § Sum up the 16 results from the grid to get the prediction. @Singhpr
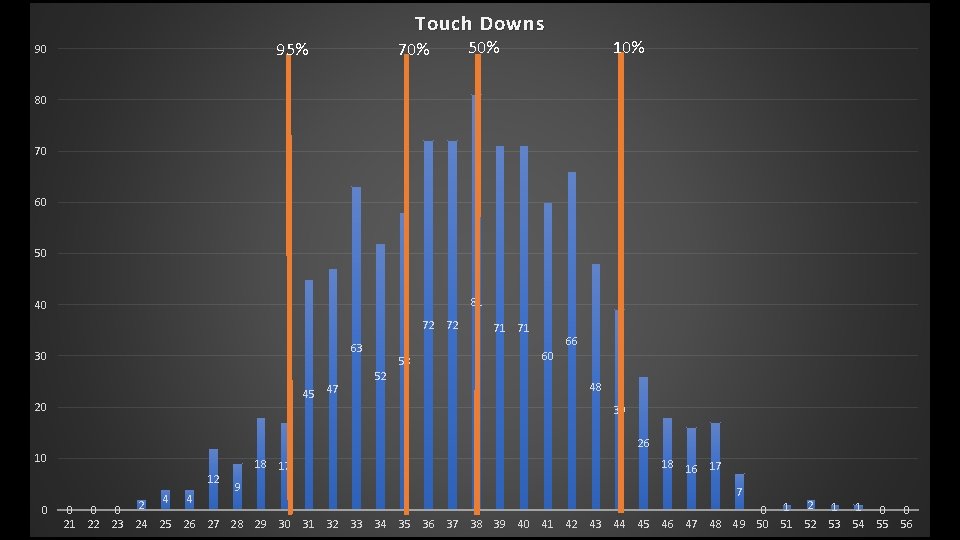
Touch Downs 95% 90 70% 50% 10% 80 70 60 50 81 40 72 72 63 30 45 47 20 58 52 71 71 66 60 48 39 26 10 12 0 4 4 18 17 9 18 16 17 7 0 0 0 2 0 1 2 1 1 0 0 21 22 23 24 25 26 27 28 29 30 31 32 33 34 35 36 37 38 39 40 41 42 43 44 45 46 47 48 49 50 51 52 53 54 55 56
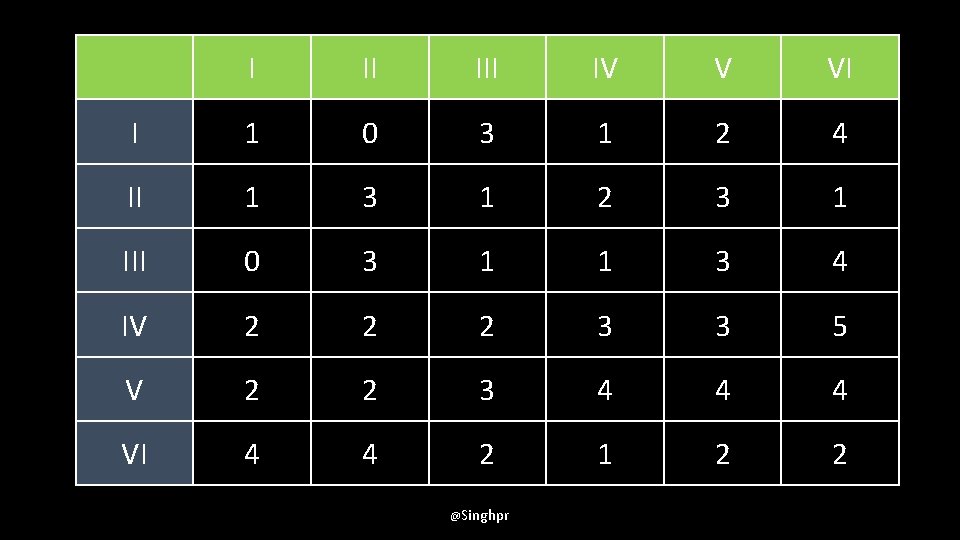
I II IV V VI I 1 0 3 1 2 4 II 1 3 1 2 3 1 III 0 3 1 1 3 4 IV 2 2 2 3 3 5 V 2 2 3 4 4 4 VI 4 4 2 1 2 2 @Singhpr
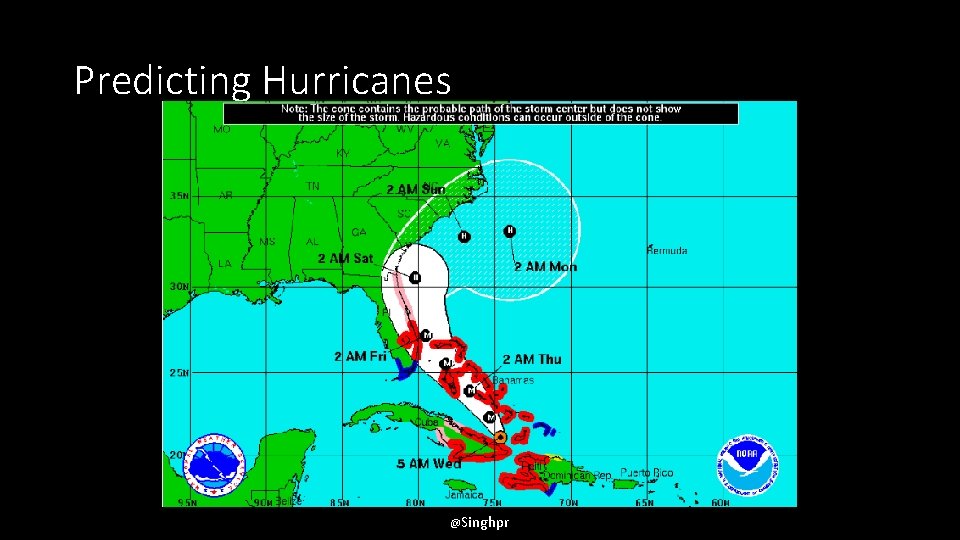
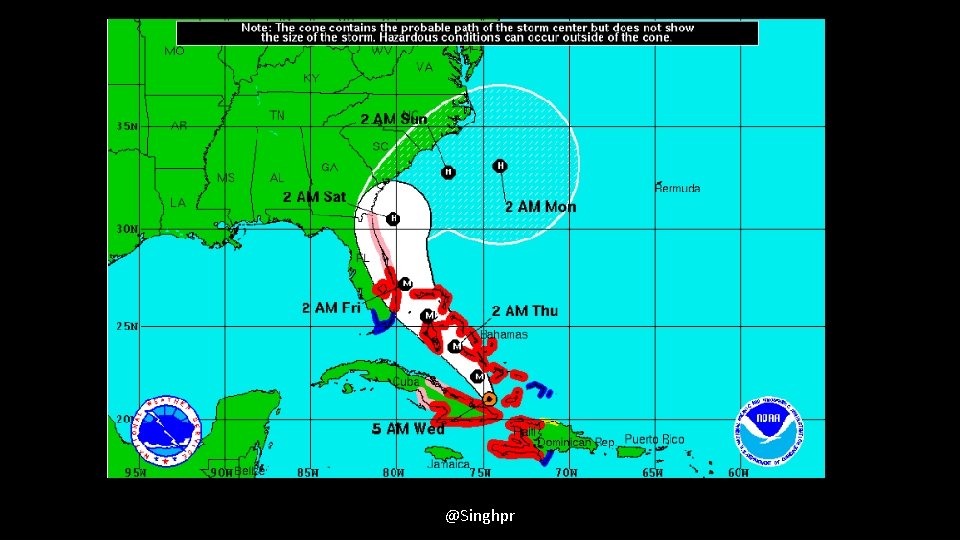
Predicting Hurricanes @Singhpr
@Singhpr
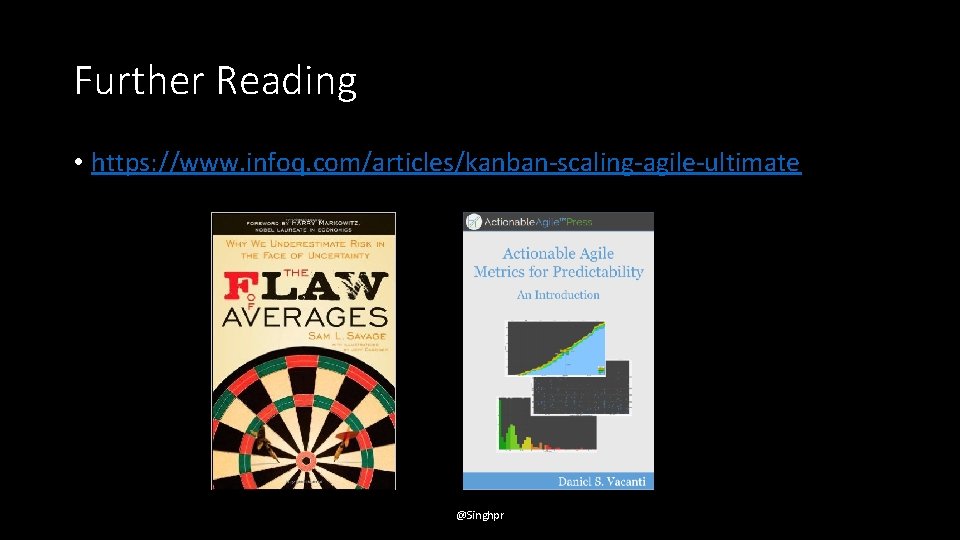
Further Reading • https: //www. infoq. com/articles/kanban-scaling-agile-ultimate @Singhpr
Thank You! @Singhpr
- Slides: 25