Prior Appropriation WR Envisions Water Right Input data

")
 HRUs (comprised of stream reaches) Stream Reach Discharge")


- Slides: 10
Prior Appropriation WR
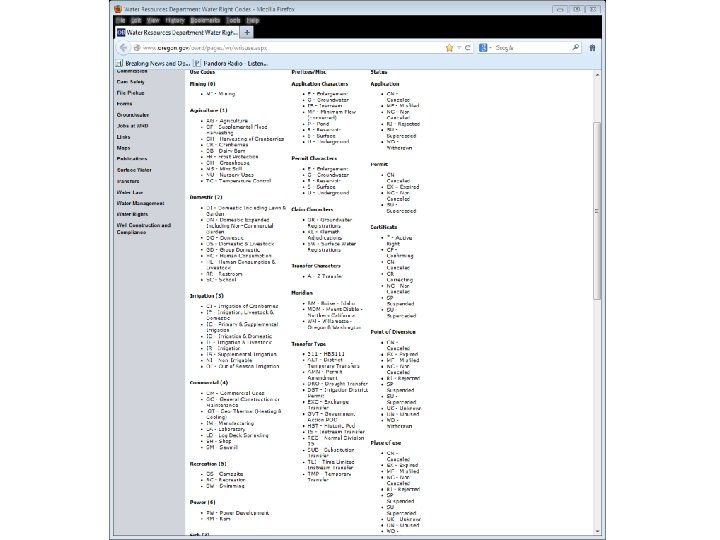
Envision’s Water Right Input data 1. Spatial Data a. OWRD Point of Use (POU) layer b. OWRD Point of Diversion (POD) layer c. WW 2100 IDU layer d. WW 2100 Stream layer 2. Text file (columns and Rows) a. POD table i. POUID number PODID ii. Coordinates iii. Diversion rate (cfs) iv. Diversion type (ground, surface, etc) vi. Use codes (Muni. , irrigation, etc) iv. Priority date (>1839) vii. Relates to Envision Reach viii. Begin and End dates for diversions a. POU table i. POUID number ii. Relates to Envision IDUs iii. Areal Percentage of WR per IDU
Flow Model (daily time step loop) HRUs (comprised of stream reaches) Stream Reach Discharge (SRD)m 3/day Water Right loop ( begin with Senior WR ) IDU loop ( A Point Of Use can have multiple IDUs) Calculate Available Reach Discharge (ARD) m 3/day. Aggregate SRD to HRU Is ARD ≥ IDU water demand ARD = SRD – ISU - OSU Log Conflict Metrics yes no Is the Use an “In Stream” Use (ISU) Consider next junior WR yes no IDU Water Demand (m 3/day) Add Demand rate to ISU Have all IDUs been considered? no Consider next IDU yes Consider next WR no Have all WR been considered Add Demand rate to “Out Stream” Use (OSU) Subtract Out Stream Use from Stream Reach Discharge SRD = SRD - OSU yes
Narrative of Water. Master steps for irrigation 1. Each OWRD POD for the WW 2100 study area are listed in the Water. Master POD input file 2. The POD input file is sorted from Senior to Junior. Diversion can be from a ground or surface source. 3. Each day of the year Water. Master begins with the most senior POD input file. 4. This POD might be one of many PODs in an OWRD paper water right 5. Each POD is associated with a POU which is represented by a POUID in the POD input data file. 6. Each POU intersects one, or many IDUs. 7. Using the POU input data file and the POUID, a list of intersecting IDU_INDEXS are returned. 8. For each IDU_INDEX the POU must intersect the IDU by 60% or more. 9. If true in step 8 then this POD will satisfy the demand in the IDU. 10. The water diverted is equal to, Demand * OWRD POD rate / sum of all OWRD POD rates for this IDU 11. Consider next IDU in from the list returned in step 7. 12. considered the next junior POD in the POD input data file. This POD may or may not be part of the same OWRD Water Right as the POD before. This POD, may or may not, contribute to satisfying the demand in any of the previously irrigated IDUs. This POD may have a different seasonal pumping schedule. This POD’s beneficial use could be municipal. This POD could be for ground water for surface water. Or, any combination of the aforementioned in this step. There are 23, 751 unique irrigation PODs in the POD input data file.
Case 1 – Single Water Right Point of Use. Could be one of many for a single water right IDUINDEX 2 IDUINDEX 1 IDUINDEX 6 A IDUINDEX 0 B C N D G H I J IDUINDEX 3 IDUINDEX 4 E IDUINDEX 5 Irrigation POU for single water right Pou. Index POUID 0 1 3 4 IDUINDEX 1827 POU_AREA 0 1 3 4 IDUINDEX 7 IDU PERCENT of POU G H I J F IDU_AREA G / H+I+J H / G+I+J I / G+H+J J / G+H+I A B D E PERCENT of IDU (G / A) * 100 (H / B) * 100 (I / D) *100 (J / E) *100 O
Case 2 – Single Water Right Point of Use. Could be one of many for a single water right IDUINDEX 2 IDUINDEX 1 IDUINDEX 6 A IDUINDEX 0 B C N G H I J K L M D IDUINDEX 3 IDUINDEX 4 E Irrigation POU for single water right Pou. Index POUID 0 1 2 3 4 5 6 IDUINDEX 117093 117093 POU_AREA 0 1 2 3 4 5 7 IDUINDEX 5 P F IDUINDEX 7 If irrigation polygon P were greater than IDU polygon O, and encased polygon O, then percent of IDU would be greater than 100 IDU PERCENT of POU IDU_AREA G G / H+I+J+K+L+M+P H+K H + K / G+I+J+L+M+P L L / G+H+I+J+K+M+P I I / G+H+J+K+L+M+P J J / G+H+I+K+L+M+P M M / G+H+I+J+K+L+P P P / G+H+I+J+K+L+M O PERCENT of IDU A (G / A) * 100 B (H+K / B) * 100 C (L /C) *100 D (I / D) *100 E (J / E) *100 F (M / F) * 100 O (P / O) * 100
This histogram plots the number of IDUs when the “percent of IDU” (as defined in previous slides) Is greater than 60%.
POU Place Of Use Point Of Diversion Reach ie nz e K c M POD
POU Point Of Diversion Place Of Use POD