Principles of Real Time PCR Ameer Effat M

 of PCR contains 3 steps: 1 - Denaturation")
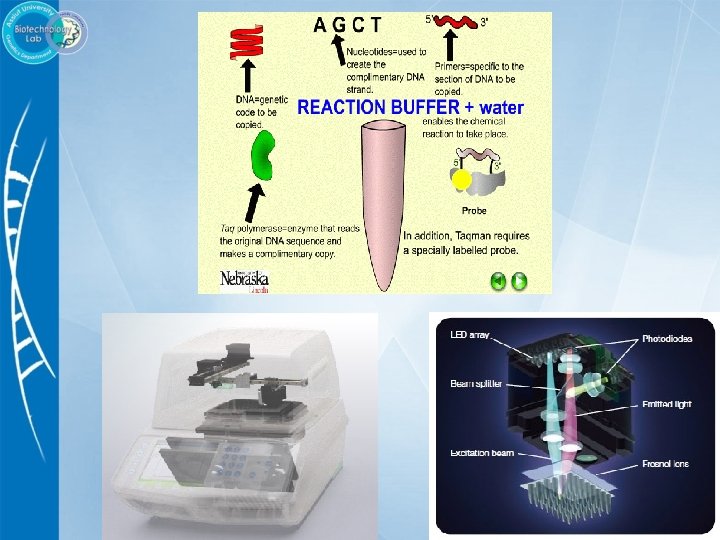
 DNA Polymeras e d. NTPs Primers")
 l RT-PCR (Reverse Transcriptase PCR) l")


- Slides: 33
Principles of Real Time PCR Ameer Effat M. Elfarash Dept. of Genetics Fac. of Agriculture, Assiut Univ. aelfarash@aun. edu. eg
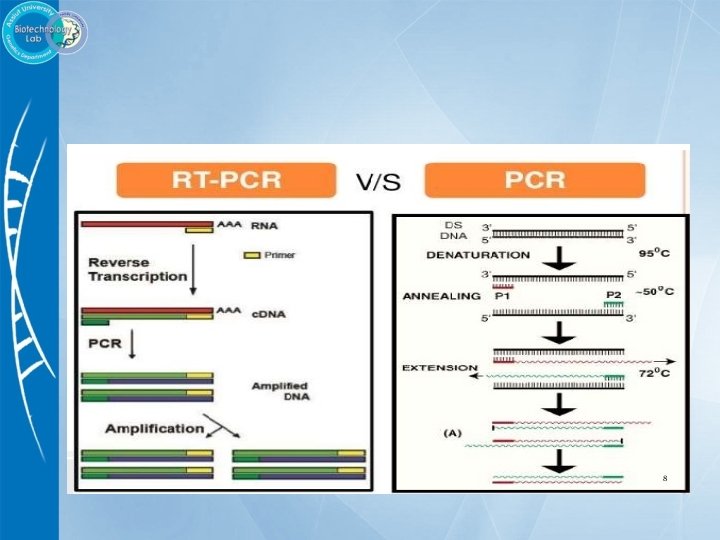
Conventional PCR l Each cycle (Round) of PCR contains 3 steps: 1 - Denaturation 2 - Primer annealing 3 - Primer extension l The cycle usually repeated for 25 – 40 times.
PCR Procedure Template DNA salts (ions) DNA Polymeras e d. NTPs Primers
Types of PCR l Standard PCR (conventional ) l RT-PCR (Reverse Transcriptase PCR) l Real Time PCR (q. RT-PCR)
RT-PCR?
How does PCR work? Theoretical Log Target DNA Actual Cycle Number
Conventional PCR problem Log Target Agarose gel electrophoresis following PCR Cycle Number
Real-Time PCR a specialized technique that allows a PCR reaction to be visualized “in real time” as the reaction progresses. Quantitative PCR relies on the principal that the quantity of target at the start of the reaction is proportional to amount of product produced during the exponential phase ∆ Fluorescence Greater starting target Less starting target CT < CT
How to measure the PCR product? Initial DNA strand First PCR cycle Second PCR cycle Third PCR cycle Fourth PCR cycle
Any increase in fluorescence level can be plotted onto a graph and easily interpreted Virus present No virus
Denaturation Extension Quantitate A n n ea l i n g M e l t i n g c u r ve
We describe the position of the lines with a value that represents the cycle number where the trace crosses a threshold. This is called the cycle threshold “Ct Value”. Ct values are directly related to the starting quantity of DNA, by way of the formula: Ct Values: 23 25 28
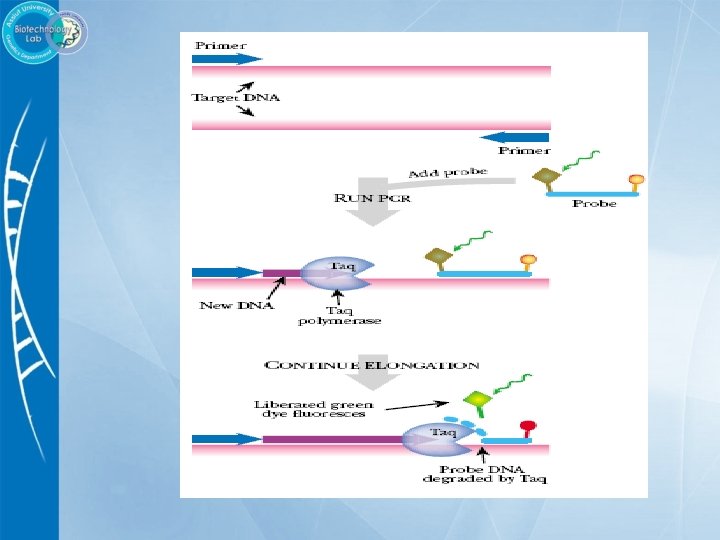
Quantitative PCR – in depth Major assay types Hydrolysis probes Basis of Taq. Man® chemistry Uses two primers and an internal hydrolysis probe Most commonly used for fish health diagnostics SYBR ® green dye Increased fluorescence when bound to ds. DNA Slightly lower specificity Costs less May not be as sensitive as the 5’ nuclease assays
SYBRGreen
5’ 3’ 3’ 5’ 5’ 3’ PCR makes more doublestranded DNA Taq 3’ 5’ 5’ 5’ 3’ 5’ Taq SYBR Green dye binds to ds. DNA l l l Taq 3’ 5’ 5’ 5’ Taq 3’ l l When illuminated with light at 490 nm, the SYBR+DNA complex fluoresces at 520 nm.
Back. Man vs Taq. Man
Taq. Man
Probe hydrolysis
Taqman vs. SYBR Green Taq. Man Probe l SYBR Green Advantages: Increased specificity Use when the most accurate quantitation of PCR product accumulation is desired. Option of detecting multiple genes in the same well (multiplexing). l l l Advantages: Relative low cost of primers. No fluorescent-labeled probes required. Disadvantages: Relative high cost of labeled probe. Disadvantages: Less specific – only primers determine specificity. l Specific and non-specific double-stranded PCR products generate the same fluorescence signal upon binding SYBR Green I dye. l Not possible to multiplex multiple gene targets. l l
Normalization: corrects for variation in template quantity and/or template quality
Standard Curves Ct Log copies l Use at least 5 concentrations for a standard curve l Use serial dilutions that are one order of magnitude apart _ 1: 10, 1: 1000, . . .
What is a Housekeeping Gene? Highly conserved genes that must be continually expressed in all tissues of organisms to maintain essential cellular functions. 27
Housekeeping Genes Gene Genomic structure / pseudogenes Regulation e. g. ß-actin : hormones of tyroid gland : stomach tumor 5. 8 S, 18 S, 28 S RNA ß 2 -microglobulin multigene family; > 20 genes; 1 active locus 20 pseudogenes multigene family; 10 -30 genes; > 200 in mouse mostly pseudogenes no pseudogenes G 6 PDH no pseudogenes PBGD aldolase HPRT U 3, U 8, . . . ornithin decarboxylase. . . no pseudogenes Pseudogenes g-actin GAPDH : lung, pancreatic, colon cancer : insulin, EGF : Non-Hodgkin lymhoma abnormal expression in tumors : kidney, stomach tumor : hormones, oxidant stress, growth factors : tumors
Denaturation Extension Quantitate A n n ea l i n g M e l t i n g c u r ve
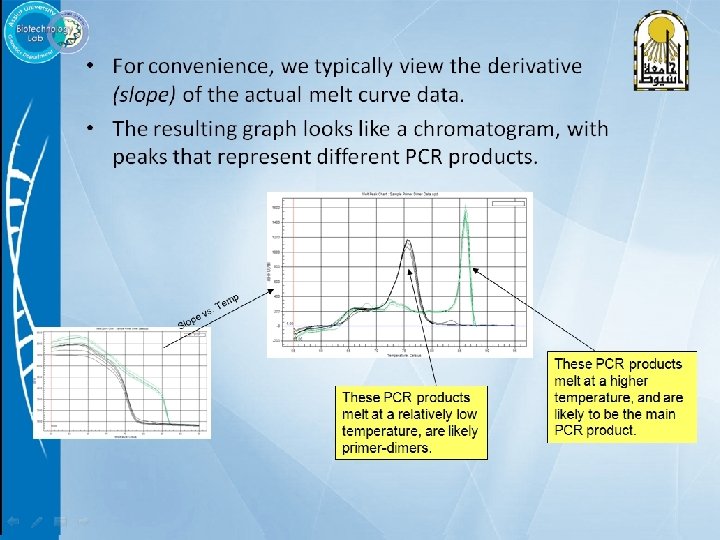
l l l Melt curves can tell us what products are in a reaction. PCR products that are shorter will melt at lower temperatures. Different PCR products will therefore have different shaped curves. 3’ 5’ ID ID 5’ 3’