
Principles of haemodynamic measurements Pressure and flow measurements



- Slides: 111
Principles of haemodynamic measurements: Pressure and flow measurements calculation of cardiac output Calculation of shunts valve area DEEPAK NANDAN
Definition of Hemodynamics is concerned with the physical and physiological principles governing the movement of blood through the circulatory system. • The forces involved with the movement of blood throughout the human circulatory system include: 1. Kinetic and potential energy provided by the cardiac pump 2. Gravity 3. Hydrostatic Pressure 4. Pressure gradients, or differences, between two any points
• Properties of blood itself that affect its flow: 1. Viscosity 2. Inertial mass 3. Volume of blood to be moved • Factors that affect the motion of blood through the vascular conduits include: 1. Size of blood vessel 2. Condition of blood vessel 3. Smoothness of lumen 4. Elasticity of muscular layer (tunica media) 5. Destination of blood (distal vascular bed)
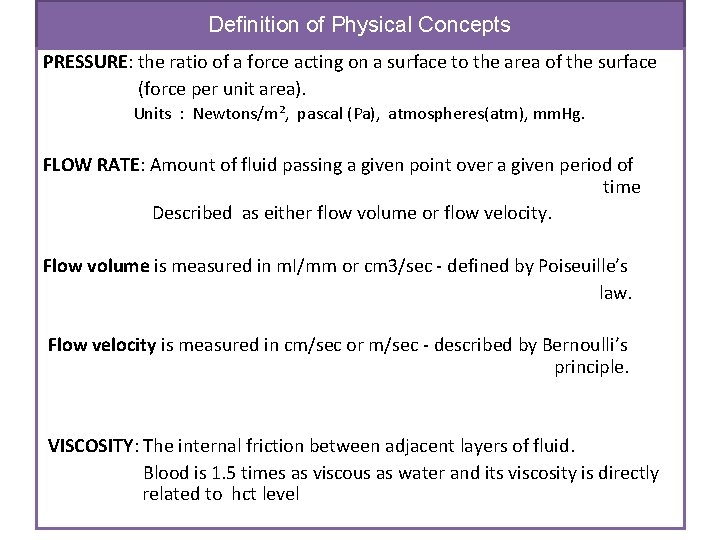
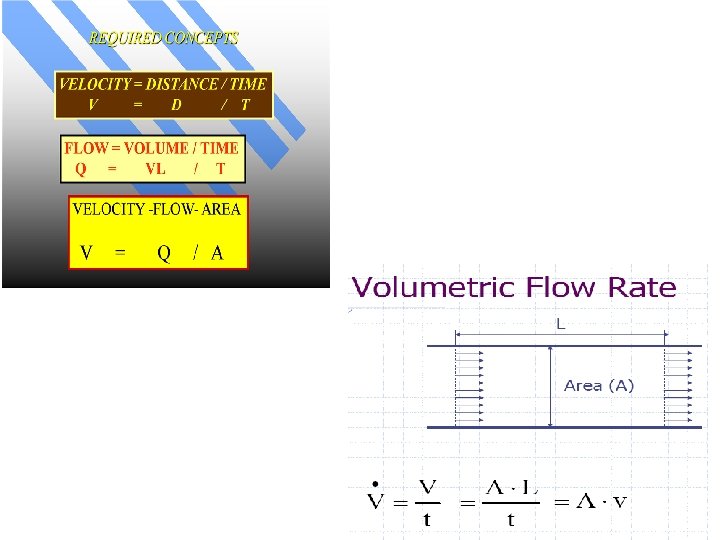
Definition of Physical Concepts PRESSURE: the ratio of a force acting on a surface to the area of the surface (force per unit area). Units : Newtons/m², pascal (Pa), atmospheres(atm), mm. Hg. FLOW RATE: Amount of fluid passing a given point over a given period of time Described as either flow volume or flow velocity. Flow volume is measured in m. I/mm or cm 3/sec - defined by Poiseuille’s law. Flow velocity is measured in cm/sec or m/sec - described by Bernoulli’s principle. VISCOSITY: The internal friction between adjacent layers of fluid. Blood is 1. 5 times as viscous as water and its viscosity is directly related to hct level
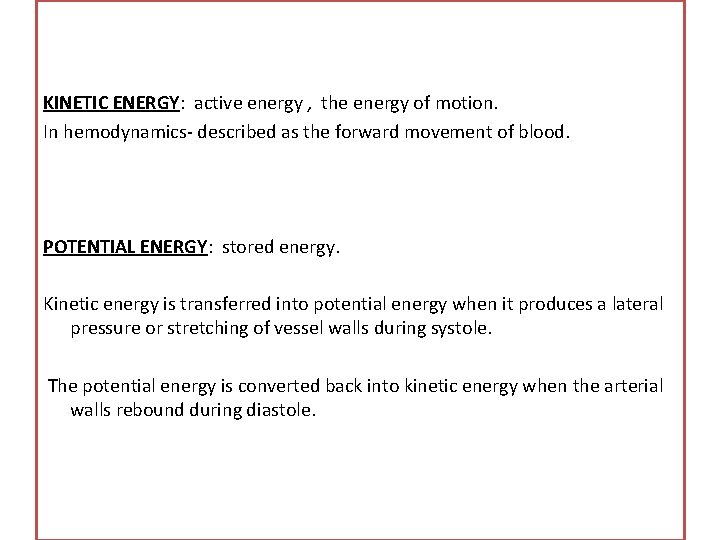
KINETIC ENERGY: active energy , the energy of motion. In hemodynamics- described as the forward movement of blood. POTENTIAL ENERGY: stored energy. Kinetic energy is transferred into potential energy when it produces a lateral pressure or stretching of vessel walls during systole. The potential energy is converted back into kinetic energy when the arterial walls rebound during diastole.
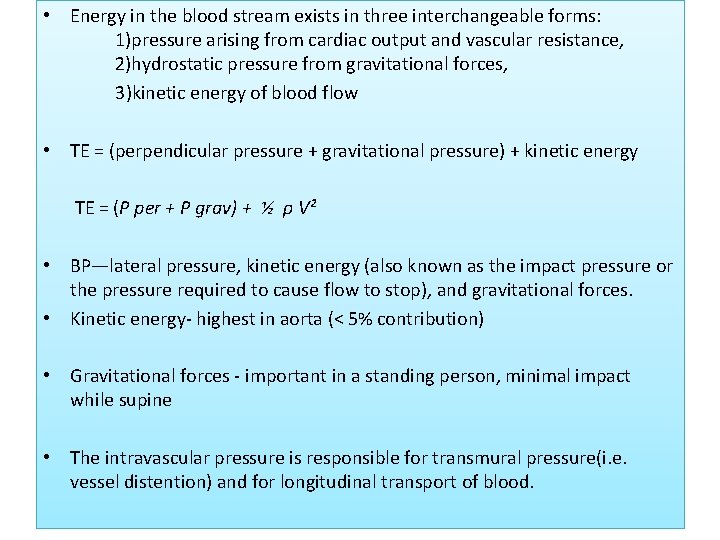
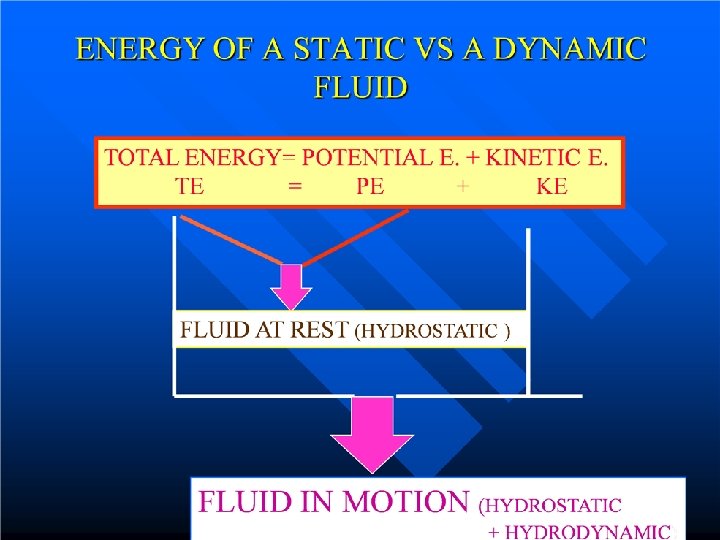
• Energy in the blood stream exists in three interchangeable forms: 1)pressure arising from cardiac output and vascular resistance, 2)hydrostatic pressure from gravitational forces, 3)kinetic energy of blood flow • TE = (perpendicular pressure + gravitational pressure) + kinetic energy TE = (P per + P grav) + ½ ρ V² • BP—lateral pressure, kinetic energy (also known as the impact pressure or the pressure required to cause flow to stop), and gravitational forces. • Kinetic energy- highest in aorta (< 5% contribution) • Gravitational forces - important in a standing person, minimal impact while supine • The intravascular pressure is responsible for transmural pressure(i. e. vessel distention) and for longitudinal transport of blood.
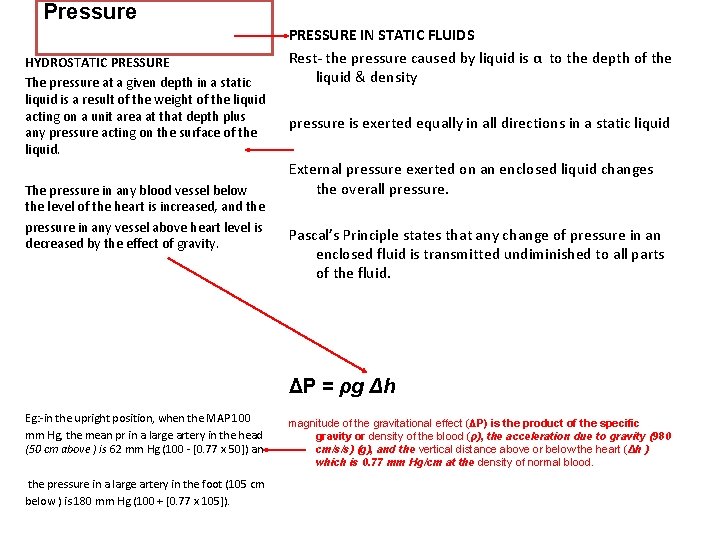
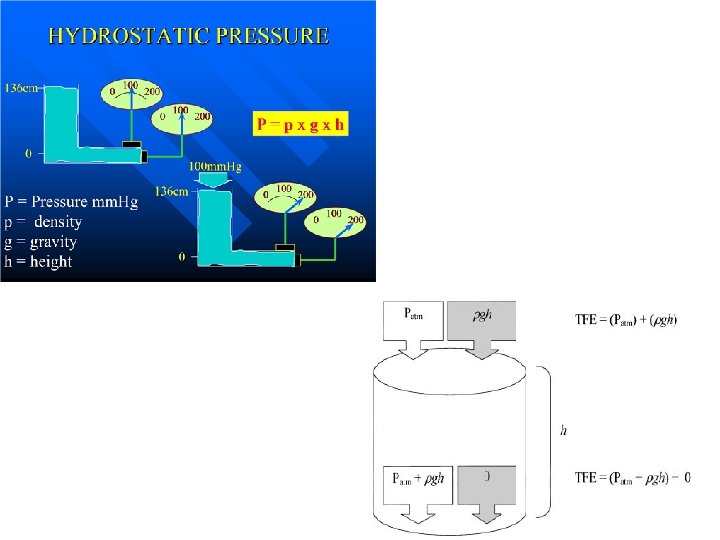
Pressure HYDROSTATIC PRESSURE The pressure at a given depth in a static liquid is a result of the weight of the liquid acting on a unit area at that depth plus any pressure acting on the surface of the liquid. The pressure in any blood vessel below the level of the heart is increased, and the pressure in any vessel above heart level is decreased by the effect of gravity. PRESSURE IN STATIC FLUIDS Rest- the pressure caused by liquid is α to the depth of the liquid & density pressure is exerted equally in all directions in a static liquid External pressure exerted on an enclosed liquid changes the overall pressure. Pascal’s Principle states that any change of pressure in an enclosed fluid is transmitted undiminished to all parts of the fluid. ΔP = ρg Δh Eg: -in the upright position, when the MAP 100 mm Hg, the mean pr in a large artery in the head (50 cm above ) is 62 mm Hg (100 - [0. 77 x 50]) an the pressure in a large artery in the foot (105 cm below ) is 180 mm Hg (100 + [0. 77 x 105]). magnitude of the gravitational effect (ΔP) is the product of the specific gravity or density of the blood (ρ), the acceleration due to gravity (980 cm/s/s) (g), and the vertical distance above or below the heart (Δh ) which is 0. 77 mm Hg/cm at the density of normal blood.
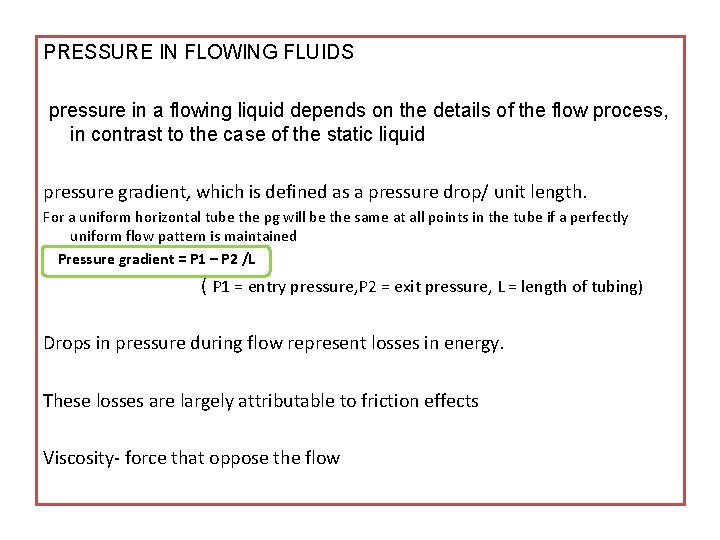
PRESSURE IN FLOWING FLUIDS pressure in a flowing liquid depends on the details of the flow process, in contrast to the case of the static liquid pressure gradient, which is defined as a pressure drop/ unit length. For a uniform horizontal tube the pg will be the same at all points in the tube if a perfectly uniform flow pattern is maintained Pressure gradient = P 1 – P 2 /L ( P 1 = entry pressure, P 2 = exit pressure, L = length of tubing) Drops in pressure during flow represent losses in energy. These losses are largely attributable to friction effects Viscosity- force that oppose the flow
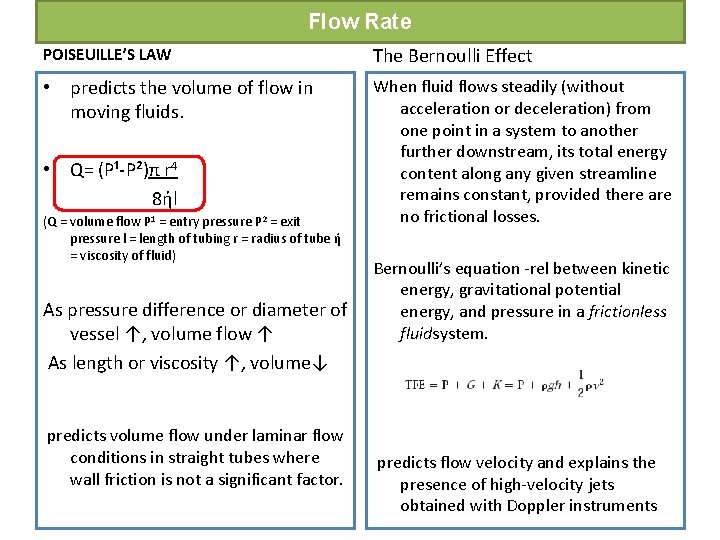
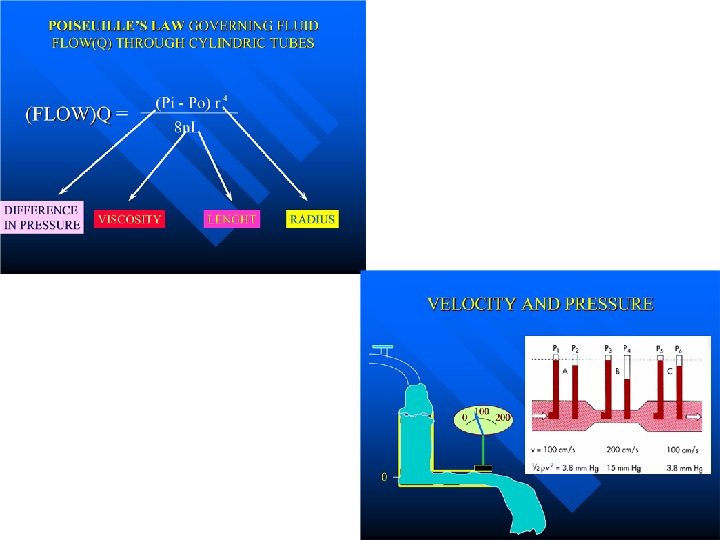
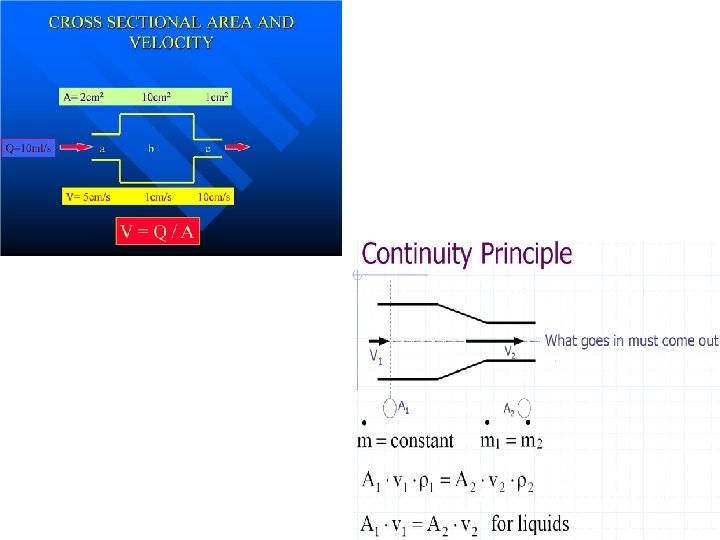
Flow Rate POISEUILLE’S LAW The Bernoulli Effect • predicts the volume of flow in moving fluids. When fluid flows steadily (without acceleration or deceleration) from one point in a system to another further downstream, its total energy content along any given streamline remains constant, provided there are no frictional losses. • Q= (P¹-P²)π r 4 8ήl (Q = volume flow P 1 = entry pressure P 2 = exit pressure l = length of tubing r = radius of tube ή = viscosity of fluid) As pressure difference or diameter of vessel ↑, volume flow ↑ As length or viscosity ↑, volume↓ predicts volume flow under laminar flow conditions in straight tubes where wall friction is not a significant factor. Bernoulli’s equation -rel between kinetic energy, gravitational potential energy, and pressure in a frictionless fluidsystem. predicts flow velocity and explains the presence of high-velocity jets obtained with Doppler instruments
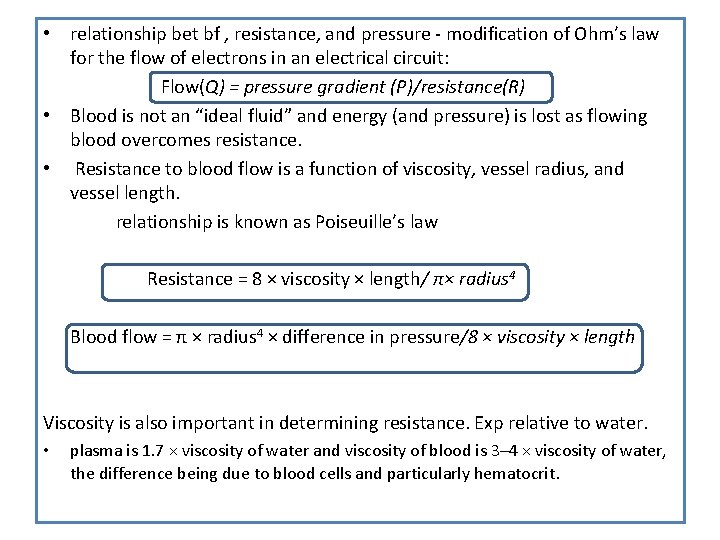
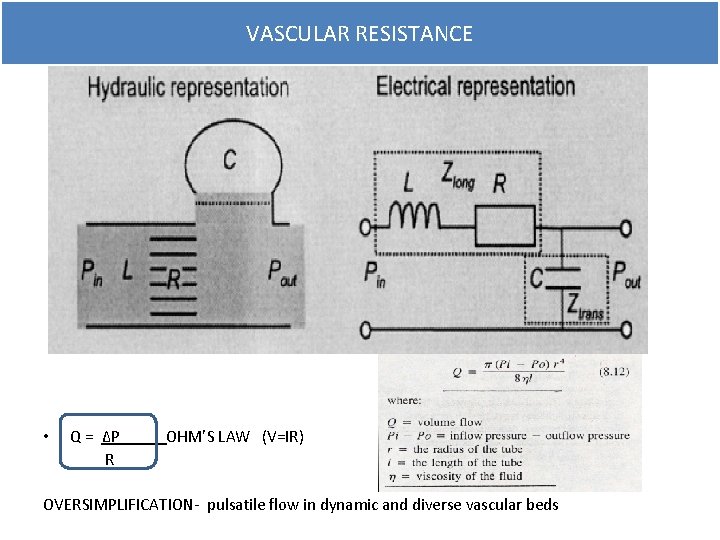
• relationship bet bf , resistance, and pressure - modification of Ohm’s law for the flow of electrons in an electrical circuit: Flow(Q) = pressure gradient (P)/resistance(R) • Blood is not an “ideal fluid” and energy (and pressure) is lost as flowing blood overcomes resistance. • Resistance to blood flow is a function of viscosity, vessel radius, and vessel length. relationship is known as Poiseuille’s law Resistance = 8 × viscosity × length/ π× radius 4 Blood flow = π × radius 4 × difference in pressure/8 × viscosity × length Viscosity is also important in determining resistance. Exp relative to water. • plasma is 1. 7 × viscosity of water and viscosity of blood is 3– 4 × viscosity of water, the difference being due to blood cells and particularly hematocrit.
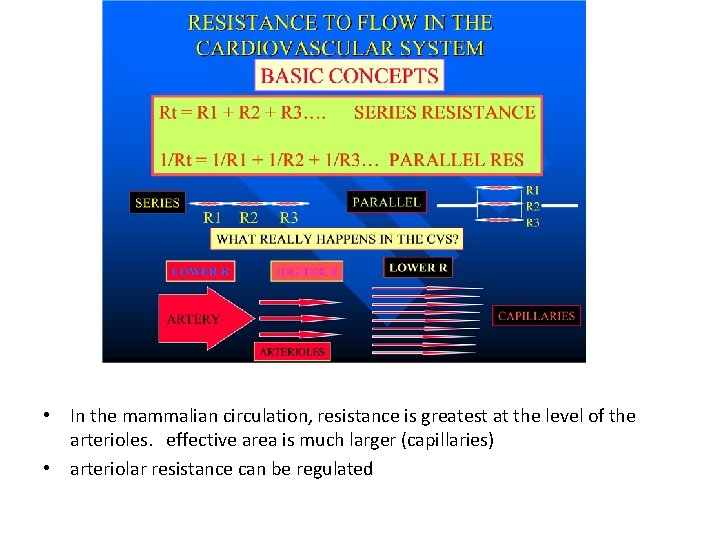
• In the mammalian circulation, resistance is greatest at the level of the arterioles. effective area is much larger (capillaries) • arteriolar resistance can be regulated
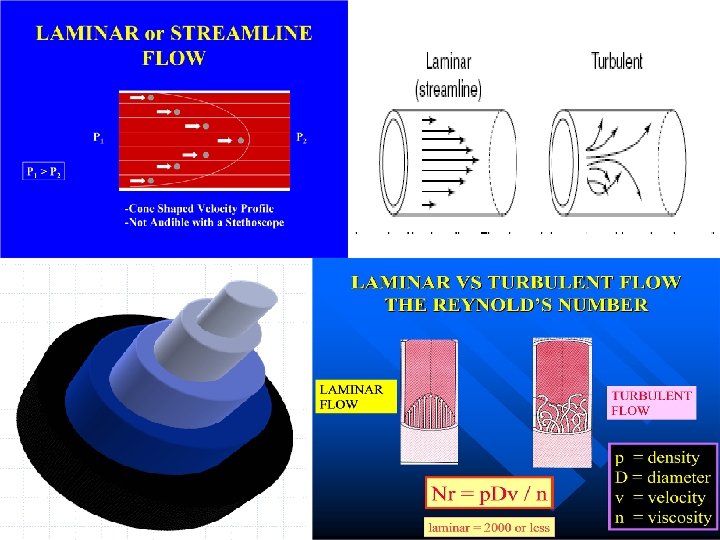
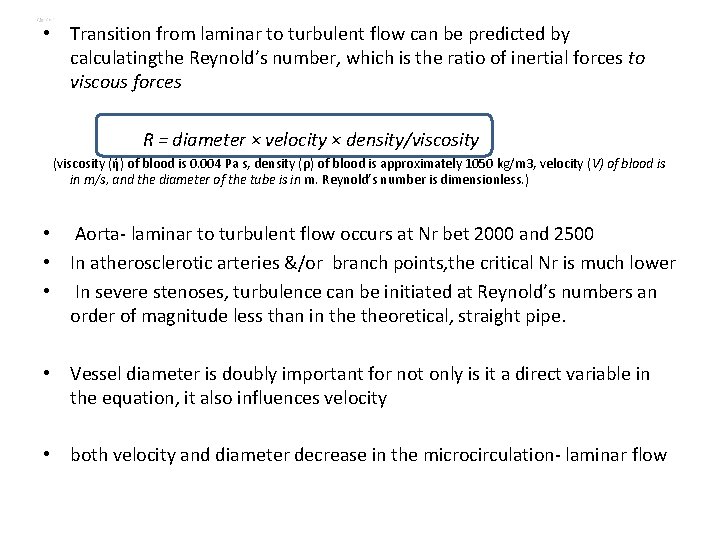
• Transition from laminar to turbulent flow can be predicted by calculatingthe Reynold’s number, which is the ratio of inertial forces to viscous forces R = diameter × velocity × density/viscosity (ή) of blood is 0. 004 Pa s, density (ρ) of blood is approximately 1050 kg/m 3, velocity (V) of blood is in m/s, and the diameter of the tube is in m. Reynold’s number is dimensionless. ) • Aorta- laminar to turbulent flow occurs at Nr bet 2000 and 2500 • In atherosclerotic arteries &/or branch points, the critical Nr is much lower • In severe stenoses, turbulence can be initiated at Reynold’s numbers an order of magnitude less than in theoretical, straight pipe. • Vessel diameter is doubly important for not only is it a direct variable in the equation, it also influences velocity • both velocity and diameter decrease in the microcirculation- laminar flow
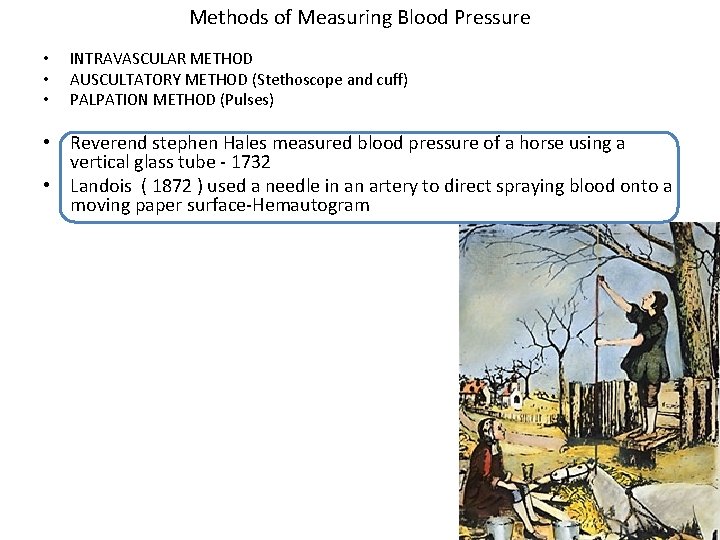
Methods of Measuring Blood Pressure • • • INTRAVASCULAR METHOD AUSCULTATORY METHOD (Stethoscope and cuff) PALPATION METHOD (Pulses) • Reverend stephen Hales measured blood pressure of a horse using a vertical glass tube - 1732 • Landois ( 1872 ) used a needle in an artery to direct spraying blood onto a moving paper surface-Hemautogram
Pressure wave • A complex periodic fluctuation in force per unit area • A pressure wave is the cyclical force generated by cardiac muscle contraction • Its amplitude and duration are influenced by various mechanical and physiological parameters 1. force of the contracting chamber 2. surrounding structures - contiguous chambers of the heart pericardium, lungs, vasculature 3. Physiological variables - heart rate, respiratory cycle
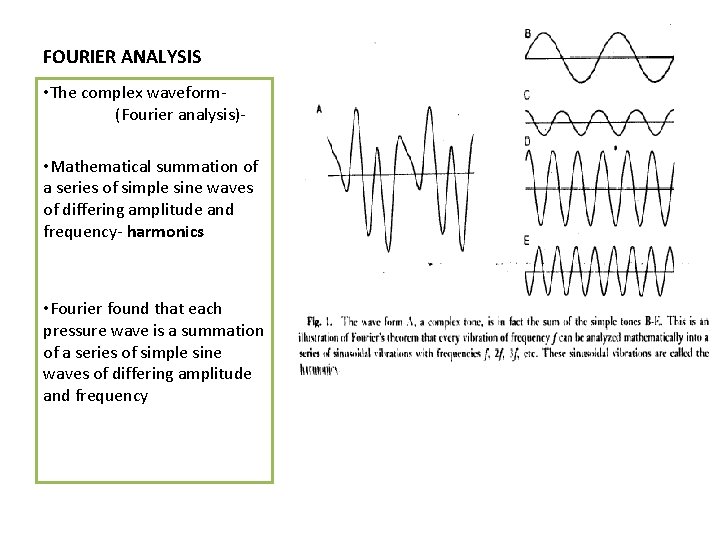
FOURIER ANALYSIS • The complex waveform(Fourier analysis) • Mathematical summation of a series of simple sine waves of differing amplitude and frequency- harmonics • Fourier found that each pressure wave is a summation of a series of simple sine waves of differing amplitude and frequency
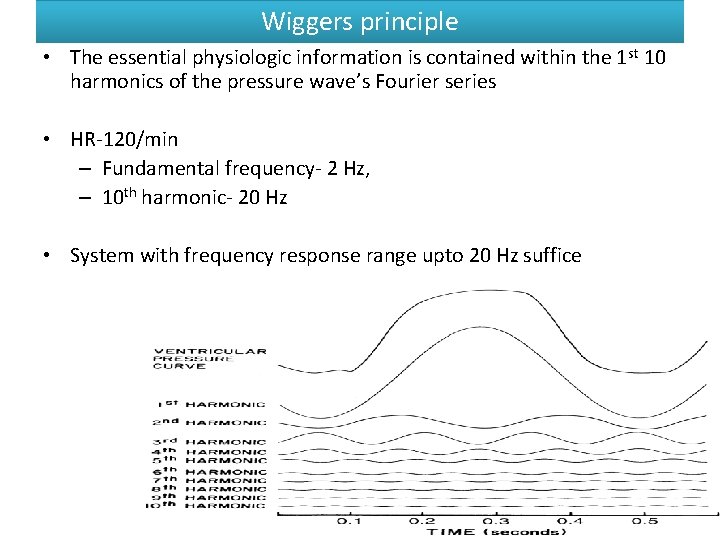
Wiggers principle • The essential physiologic information is contained within the 1 st 10 harmonics of the pressure wave’s Fourier series • HR-120/min – Fundamental frequency- 2 Hz, – 10 th harmonic- 20 Hz • System with frequency response range upto 20 Hz suffice
• To record pressure accurately, a system must respond with equal amplitude for a given input throughout the range of frequencies contained within the pressure wave • If components in a particular frequency range are either suppressed or exaggerated by the transducer system, the recorded signal will be a grossly distorted version of the original physiologic waveform
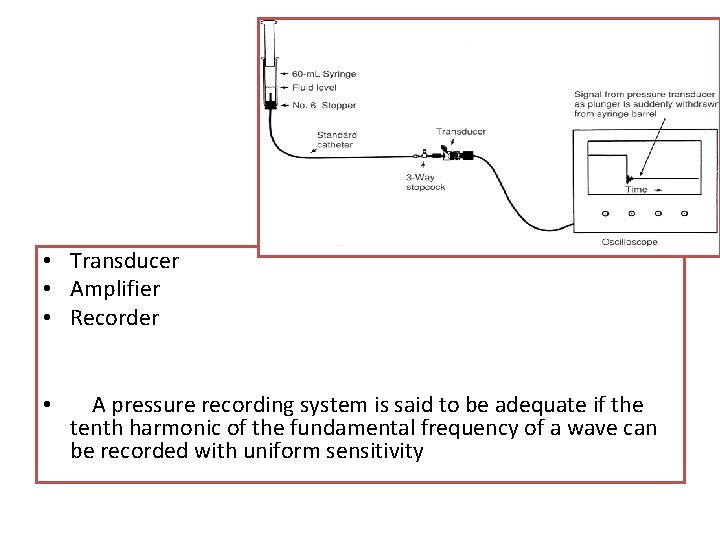
• Transducer • Amplifier • Recorder • A pressure recording system is said to be adequate if the tenth harmonic of the fundamental frequency of a wave can be recorded with uniform sensitivity
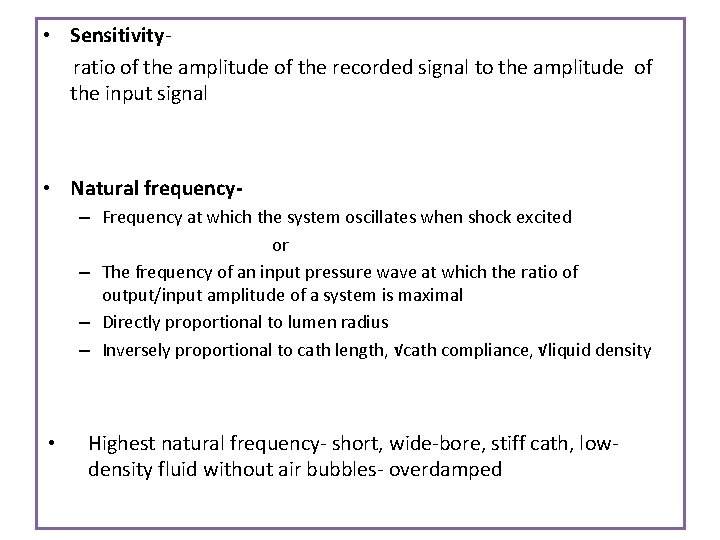
• Sensitivityratio of the amplitude of the recorded signal to the amplitude of the input signal • Natural frequency– Frequency at which the system oscillates when shock excited or – The frequency of an input pressure wave at which the ratio of output/input amplitude of a system is maximal – Directly proportional to lumen radius – Inversely proportional to cath length, √cath compliance, √liquid density • Highest natural frequency- short, wide-bore, stiff cath, lowdensity fluid without air bubbles- overdamped
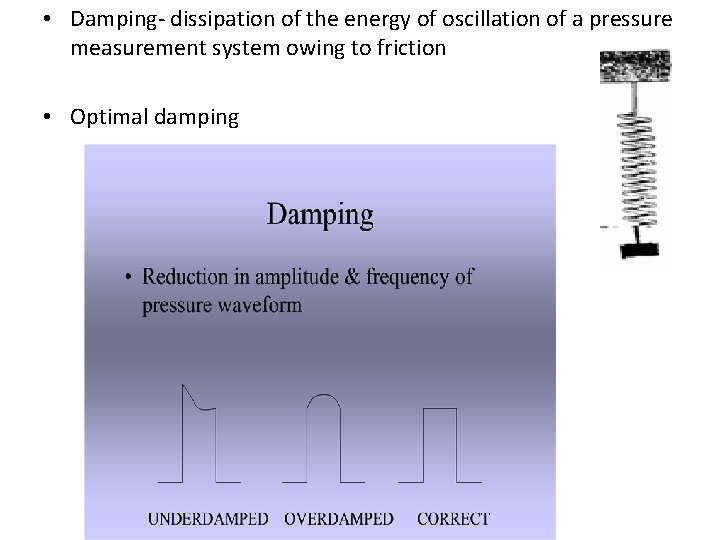
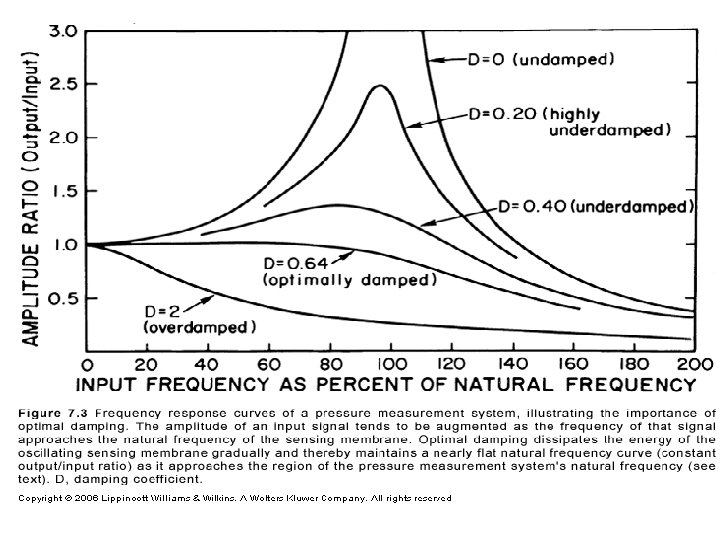
• Damping- dissipation of the energy of oscillation of a pressure measurement system owing to friction • Optimal damping
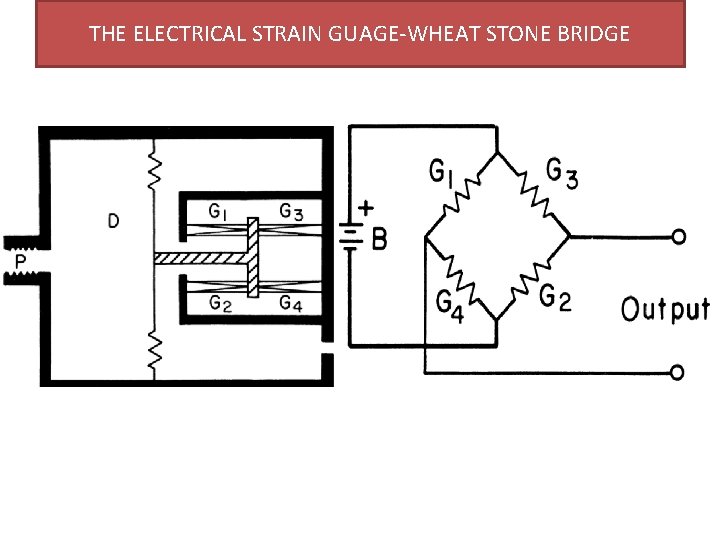
THE ELECTRICAL STRAIN GUAGE-WHEAT STONE BRIDGE
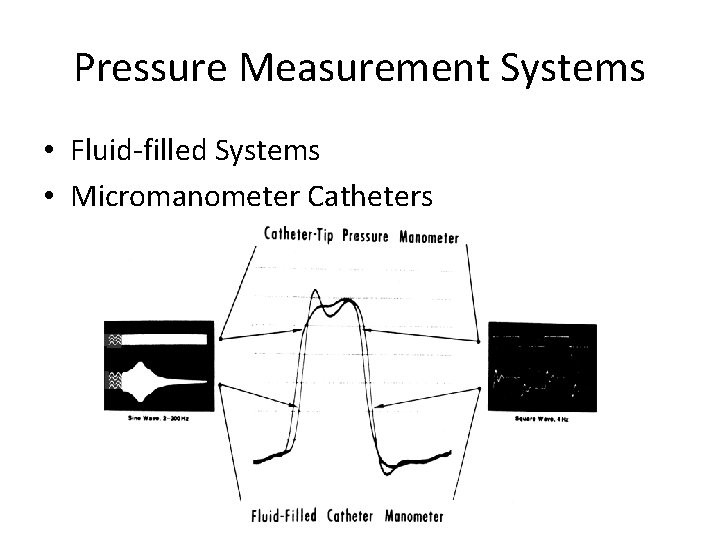
Pressure Measurement Systems • Fluid-filled Systems • Micromanometer Catheters
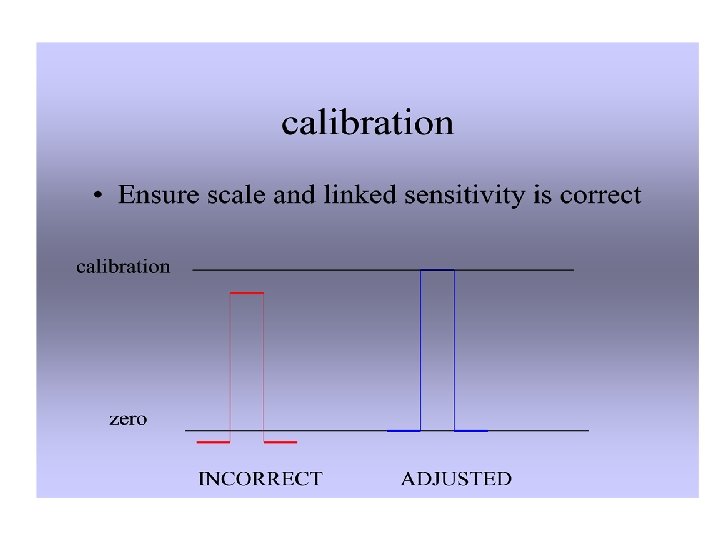
Fluid-filled Systems • fluid-filled catheter attached to a pressure transducer • pressure wave is transmitted by the fluid column within the catheter • Pressure measurement system should have the highest possible natural frequency and optimal damping • Data should be collected , with the patient in steady state, in close proximity to one another and before introduction of radiographic contrast. • Accurate ‘zero’ reference is essential • Transducers must be caliberated frequently (before each rec)
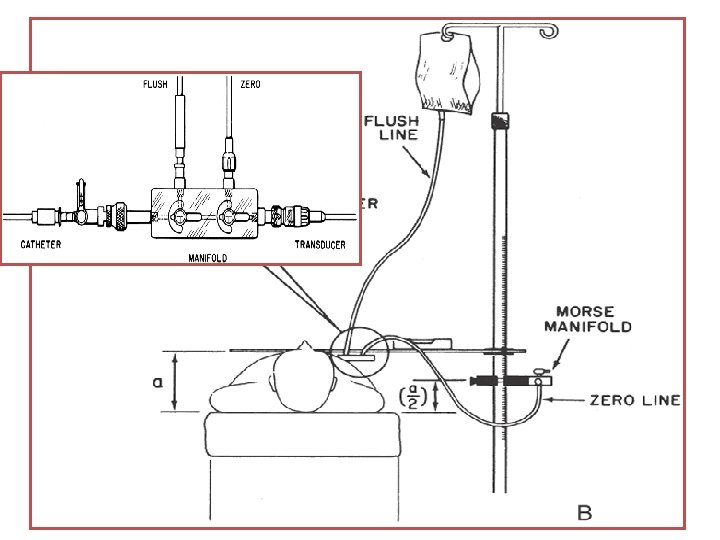
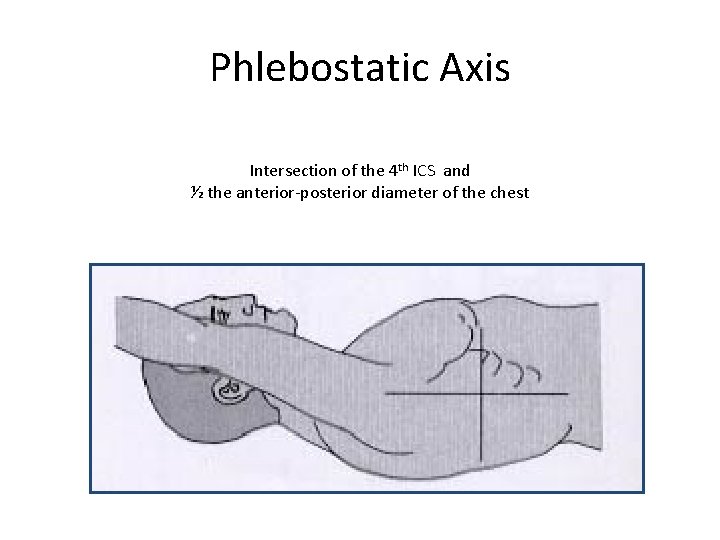
• The pressure transducer -calibrated against a known pressure, and the establishment of a zero reference undertaken at the start of the catheterization procedure • To “zero” the transducer, the transducer is placed at the level of the atria, which is approximately midchest • If the transducer is attached to the manifold and is therefore at variable positions during the procedure, a second fluidfilled catheter system should be attached to the transducer and positioned at the level of the midchest
Phlebostatic Axis Intersection of the 4 th ICS and ½ the anterior-posterior diameter of the chest
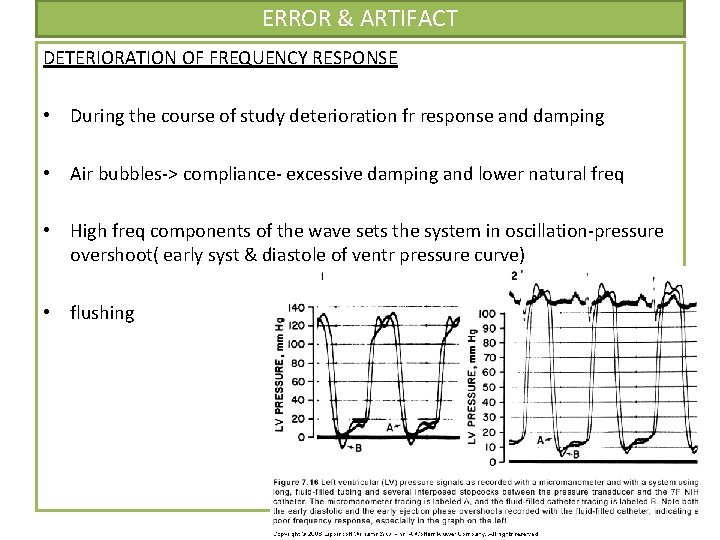
ERROR & ARTIFACT DETERIORATION OF FREQUENCY RESPONSE • During the course of study deterioration fr response and damping • Air bubbles-> compliance- excessive damping and lower natural freq • High freq components of the wave sets the system in oscillation-pressure overshoot( early syst & diastole of ventr pressure curve) • flushing
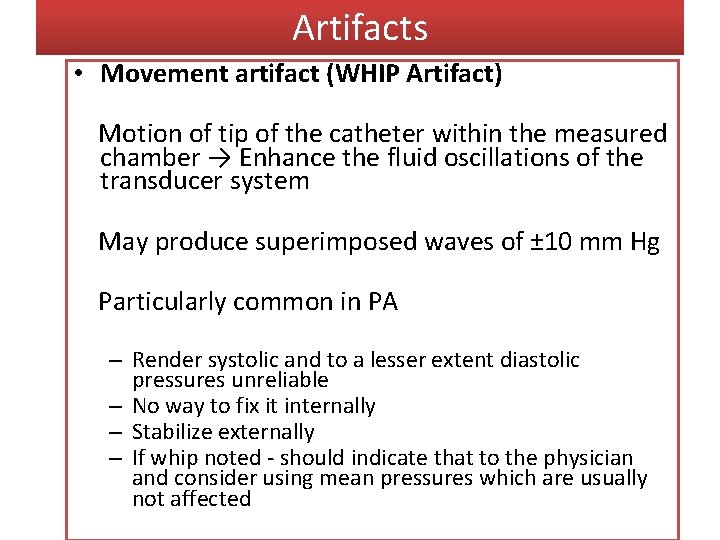
Artifacts • Movement artifact (WHIP Artifact) Motion of tip of the catheter within the measured chamber → Enhance the fluid oscillations of the transducer system May produce superimposed waves of ± 10 mm Hg Particularly common in PA – Render systolic and to a lesser extent diastolic pressures unreliable – No way to fix it internally – Stabilize externally – If whip noted - should indicate that to the physician and consider using mean pressures which are usually not affected
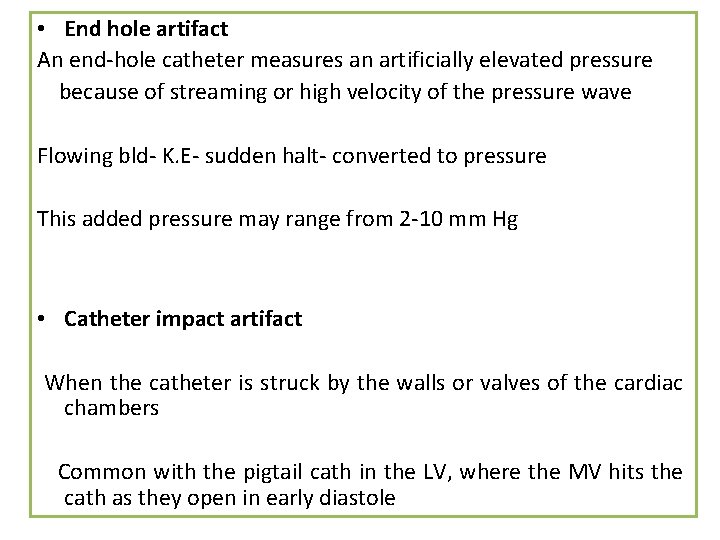
• End hole artifact An end-hole catheter measures an artificially elevated pressure because of streaming or high velocity of the pressure wave Flowing bld- K. E- sudden halt- converted to pressure This added pressure may range from 2 -10 mm Hg • Catheter impact artifact When the catheter is struck by the walls or valves of the cardiac chambers Common with the pigtail cath in the LV, where the MV hits the cath as they open in early diastole
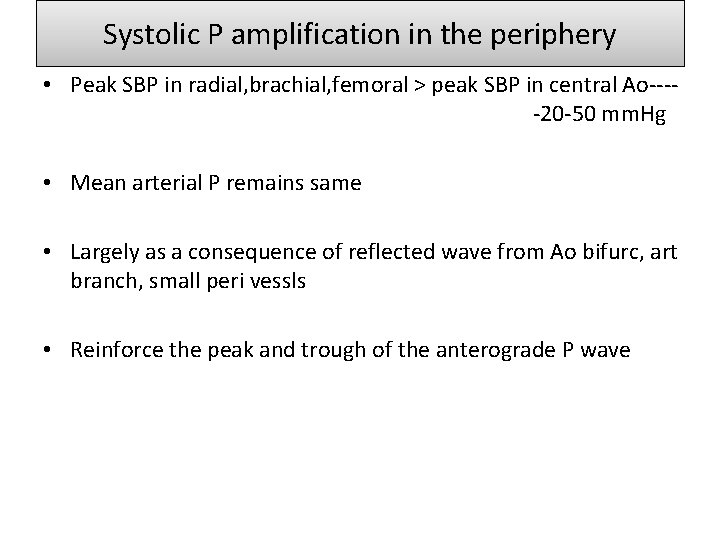
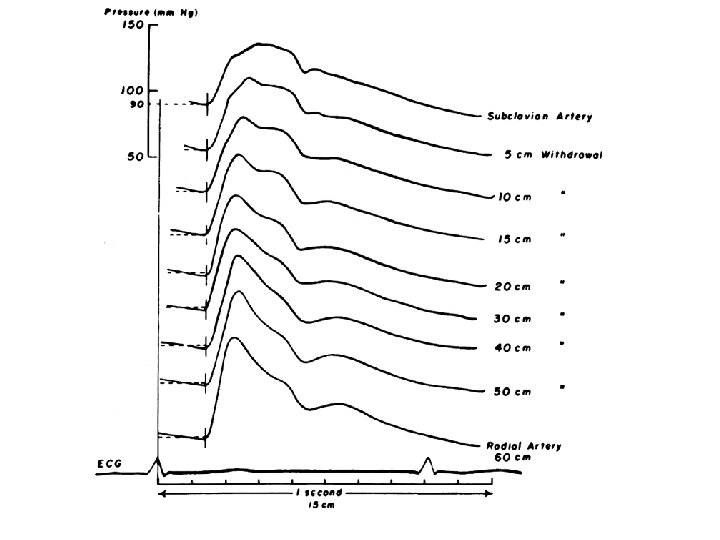
Systolic P amplification in the periphery • Peak SBP in radial, brachial, femoral > peak SBP in central Ao----20 -50 mm. Hg • Mean arterial P remains same • Largely as a consequence of reflected wave from Ao bifurc, art branch, small peri vessls • Reinforce the peak and trough of the anterograde P wave
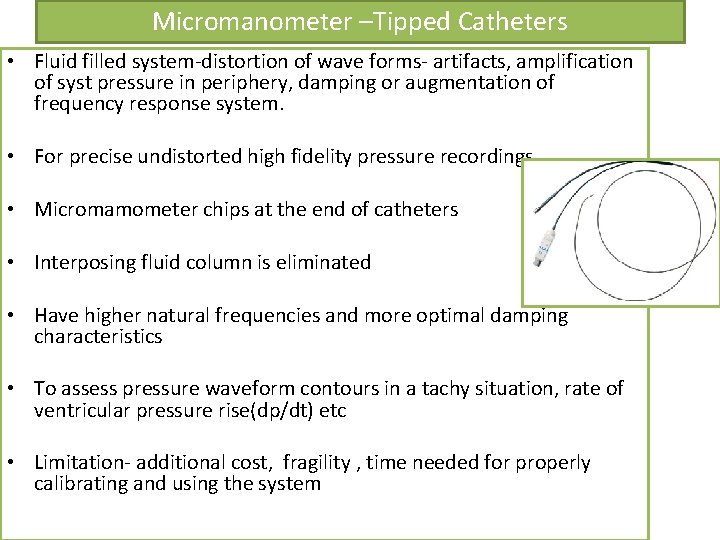
Micromanometer –Tipped Catheters • Fluid filled system-distortion of wave forms- artifacts, amplification of syst pressure in periphery, damping or augmentation of frequency response system. • For precise undistorted high fidelity pressure recordings • Micromamometer chips at the end of catheters • Interposing fluid column is eliminated • Have higher natural frequencies and more optimal damping characteristics • To assess pressure waveform contours in a tachy situation, rate of ventricular pressure rise(dp/dt) etc • Limitation- additional cost, fragility , time needed for properly calibrating and using the system
Techniques for determination of cardiac output • • Fick Oxygen technique Indicator dilution technique Thermodilution technique Angiographic technique
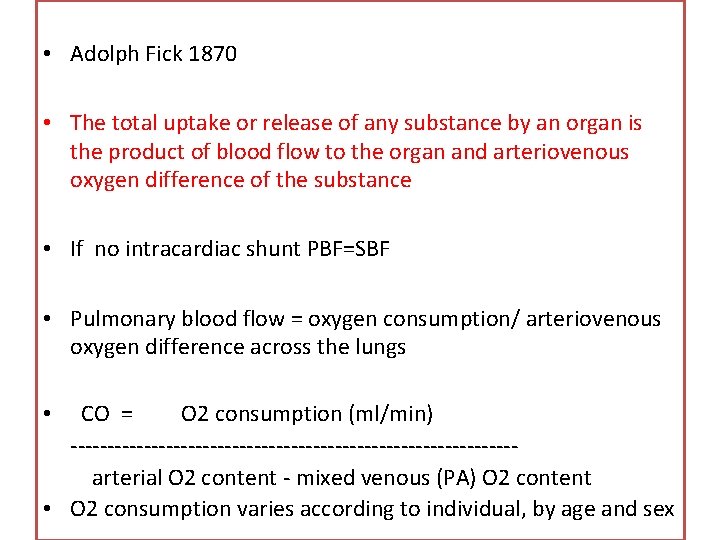
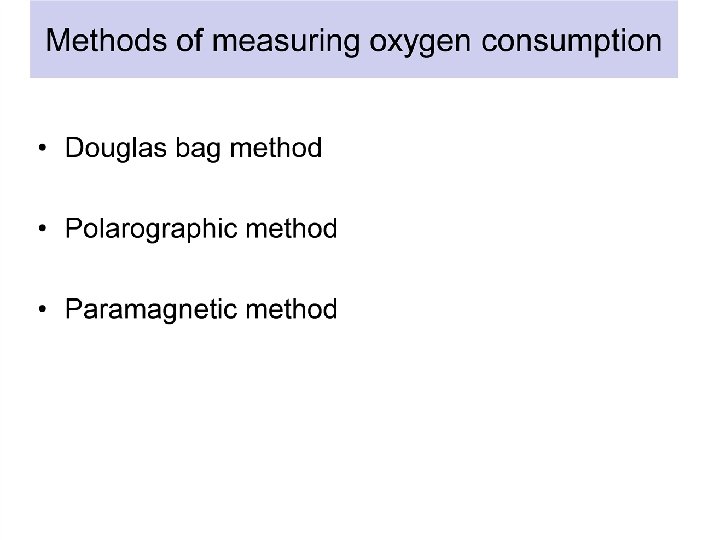
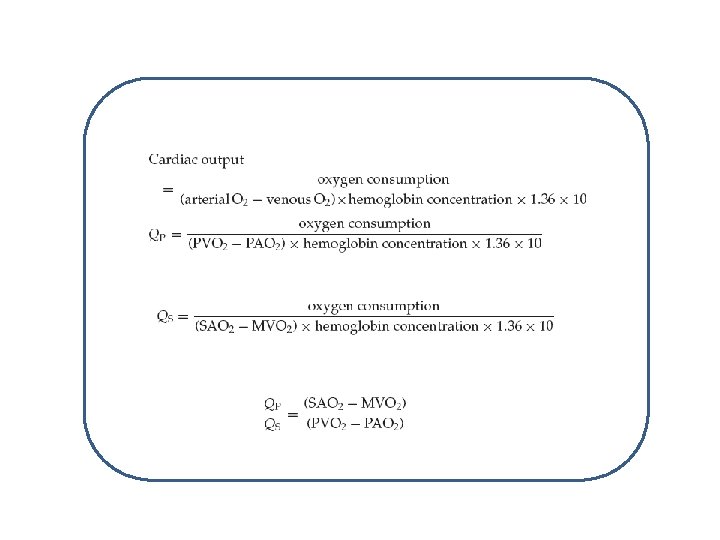
• Adolph Fick 1870 • The total uptake or release of any substance by an organ is the product of blood flow to the organ and arteriovenous oxygen difference of the substance • If no intracardiac shunt PBF=SBF • Pulmonary blood flow = oxygen consumption/ arteriovenous oxygen difference across the lungs CO = O 2 consumption (ml/min) ------------------------------arterial O 2 content - mixed venous (PA) O 2 content • O 2 consumption varies according to individual, by age and sex •
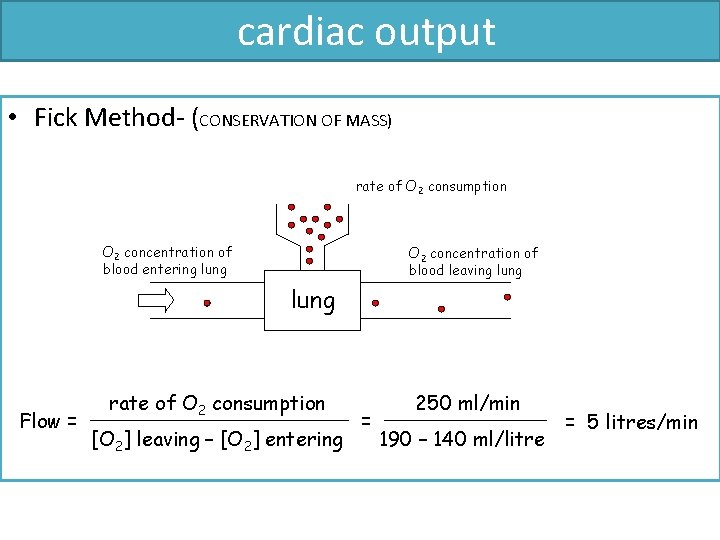
cardiac output • Fick Method- (CONSERVATION OF MASS) rate of O 2 consumption O 2 concentration of blood entering lung O 2 concentration of blood leaving lung Flow = rate of O 2 consumption [O 2] leaving – [O 2] entering = 250 ml/min 190 – 140 ml/litre = 5 litres/min
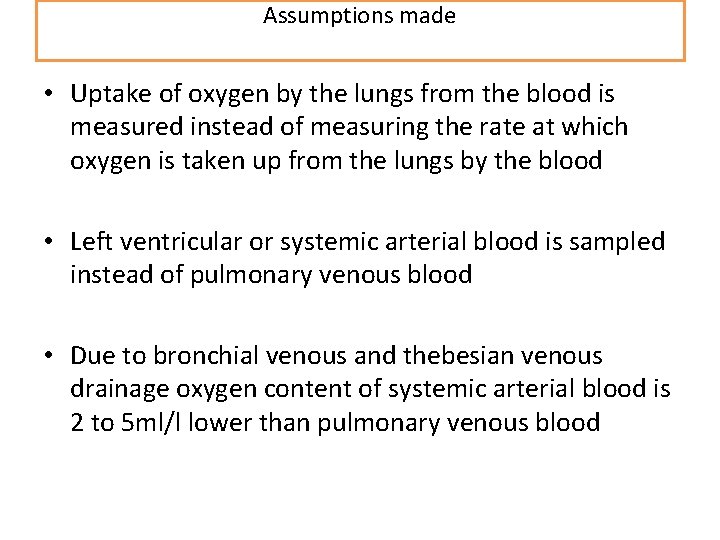
Assumptions made • Uptake of oxygen by the lungs from the blood is measured instead of measuring the rate at which oxygen is taken up from the lungs by the blood • Left ventricular or systemic arterial blood is sampled instead of pulmonary venous blood • Due to bronchial venous and thebesian venous drainage oxygen content of systemic arterial blood is 2 to 5 ml/l lower than pulmonary venous blood
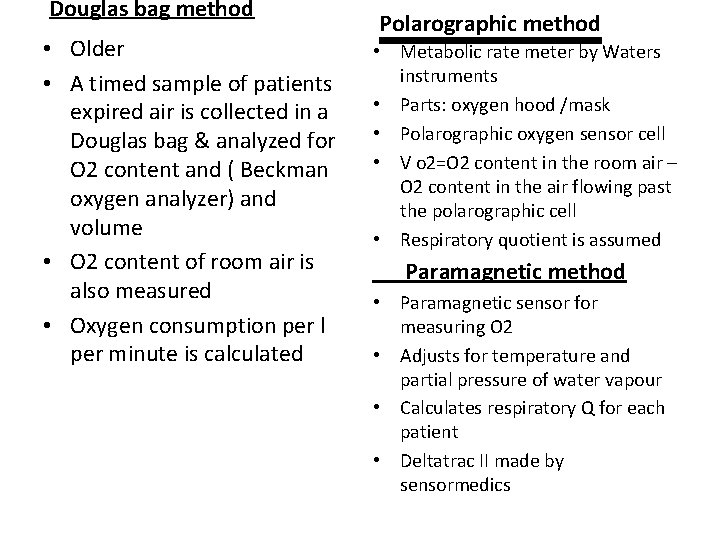
Douglas bag method • Older • A timed sample of patients expired air is collected in a Douglas bag & analyzed for O 2 content and ( Beckman oxygen analyzer) and volume • O 2 content of room air is also measured • Oxygen consumption per l per minute is calculated Polarographic method • Metabolic rate meter by Waters instruments • Parts: oxygen hood /mask • Polarographic oxygen sensor cell • V o 2=O 2 content in the room air – O 2 content in the air flowing past the polarographic cell • Respiratory quotient is assumed Paramagnetic method • Paramagnetic sensor for measuring O 2 • Adjusts for temperature and partial pressure of water vapour • Calculates respiratory Q for each patient • Deltatrac II made by sensormedics
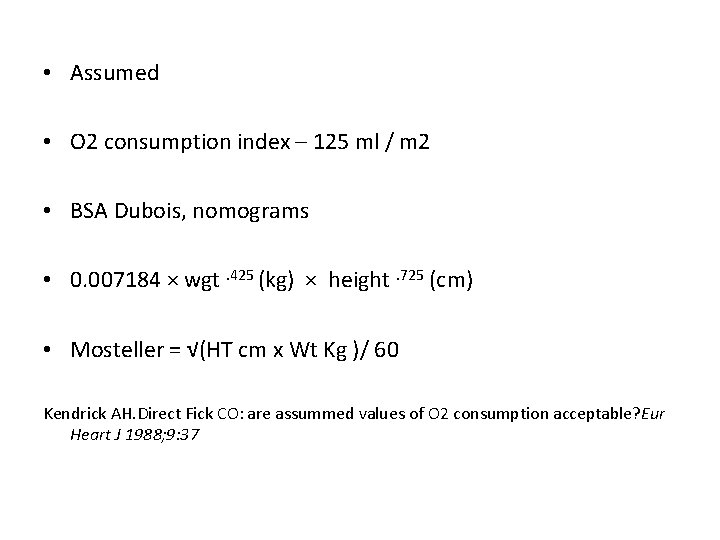
• Assumed • O 2 consumption index – 125 ml / m 2 • BSA Dubois, nomograms • 0. 007184 × wgt. 425 (kg) × height. 725 (cm) • Mosteller = √(HT cm x Wt Kg )/ 60 Kendrick AH. Direct Fick CO: are assummed values of O 2 consumption acceptable? Eur Heart J 1988; 9: 37
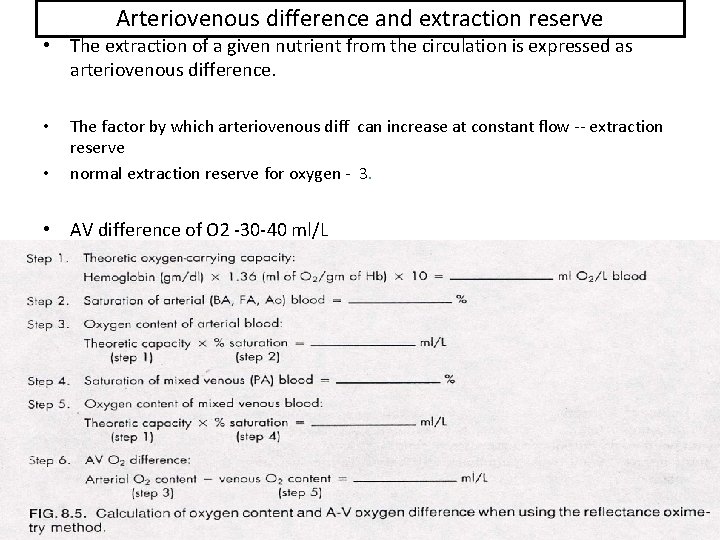
Arteriovenous difference and extraction reserve • The extraction of a given nutrient from the circulation is expressed as arteriovenous difference. • • The factor by which arteriovenous diff can increase at constant flow -- extraction reserve normal extraction reserve for oxygen - 3. • AV difference of O 2 -30 -40 ml/L
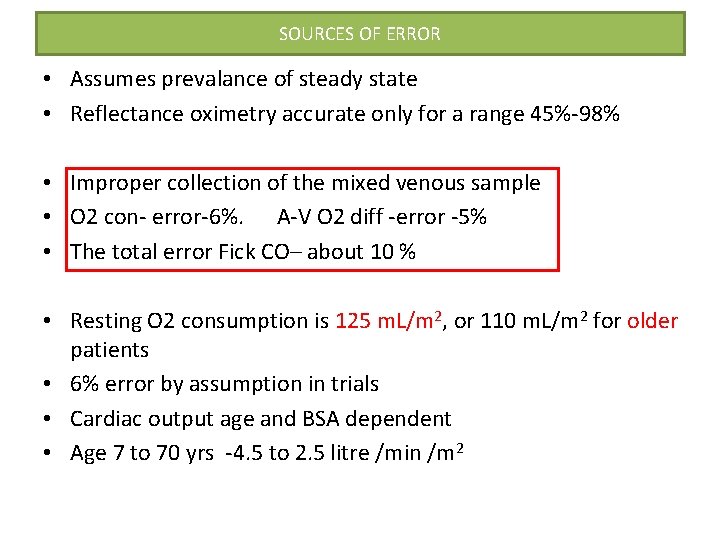
SOURCES OF ERROR • Assumes prevalance of steady state • Reflectance oximetry accurate only for a range 45%-98% • Improper collection of the mixed venous sample • O 2 con- error-6%. A-V O 2 diff -error -5% • The total error Fick CO– about 10 % • Resting O 2 consumption is 125 m. L/m 2, or 110 m. L/m 2 for older patients • 6% error by assumption in trials • Cardiac output age and BSA dependent • Age 7 to 70 yrs -4. 5 to 2. 5 litre /min /m 2
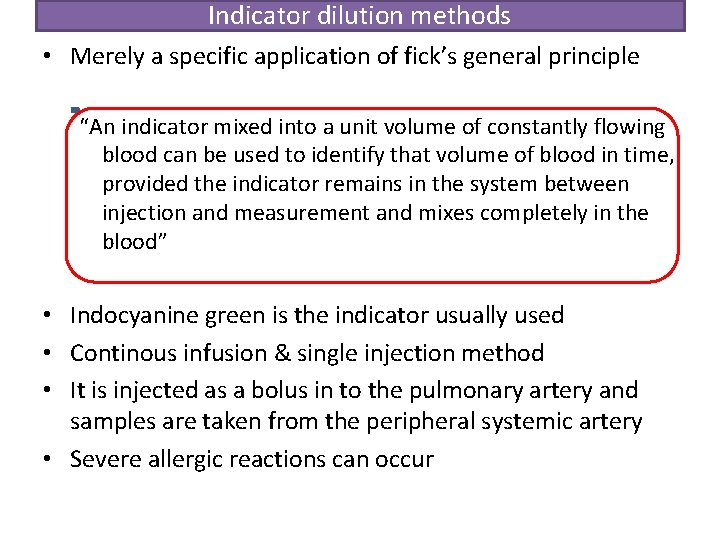
Indicator dilution methods • Merely a specific application of fick’s general principle “An indicator mixed into a unit volume of constantly flowing blood can be used to identify that volume of blood in time, provided the indicator remains in the system between injection and measurement and mixes completely in the blood” • Indocyanine green is the indicator usually used • Continous infusion & single injection method • It is injected as a bolus in to the pulmonary artery and samples are taken from the peripheral systemic artery • Severe allergic reactions can occur
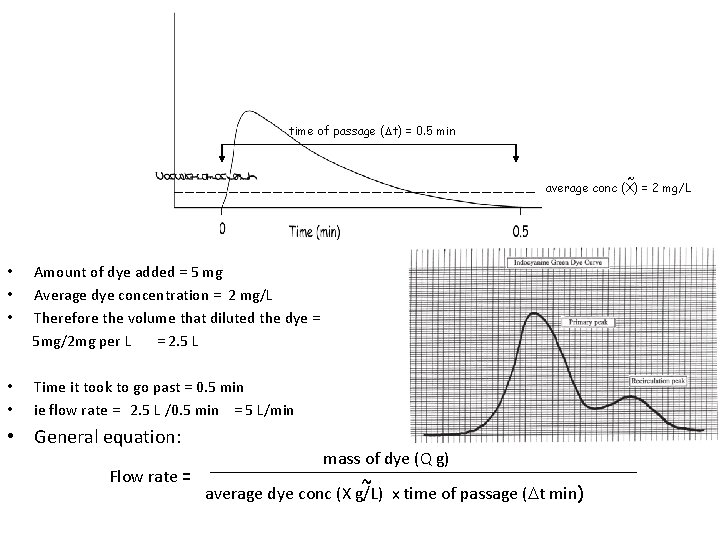
time of passage ( t) = 0. 5 min ~ average conc (X) = 2 mg/L • • • Amount of dye added = 5 mg Average dye concentration = 2 mg/L Therefore the volume that diluted the dye = 5 mg/2 mg per L = 2. 5 L • • Time it took to go past = 0. 5 min ie flow rate = 2. 5 L /0. 5 min = 5 L/min • General equation: mass of dye (Q g) Flow rate = ~ average dye conc (X g/L) x time of passage ( t min)
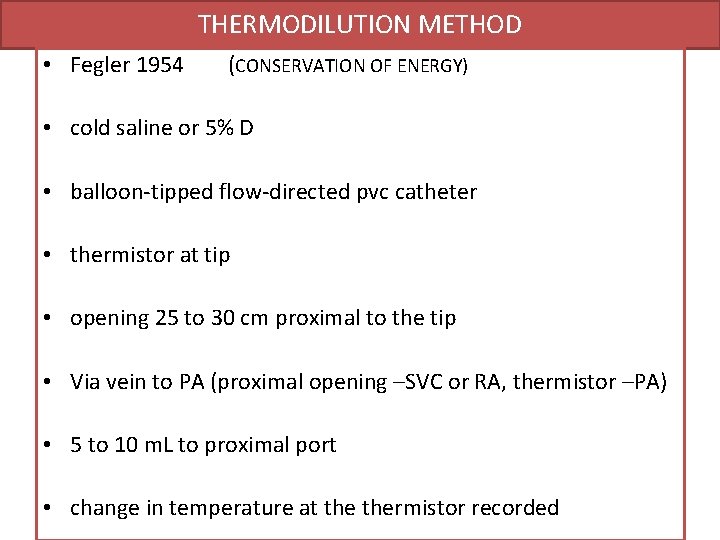
THERMODILUTION METHOD • Fegler 1954 (CONSERVATION OF ENERGY) • cold saline or 5% D • balloon-tipped flow-directed pvc catheter • thermistor at tip • opening 25 to 30 cm proximal to the tip • Via vein to PA (proximal opening –SVC or RA, thermistor –PA) • 5 to 10 m. L to proximal port • change in temperature at thermistor recorded
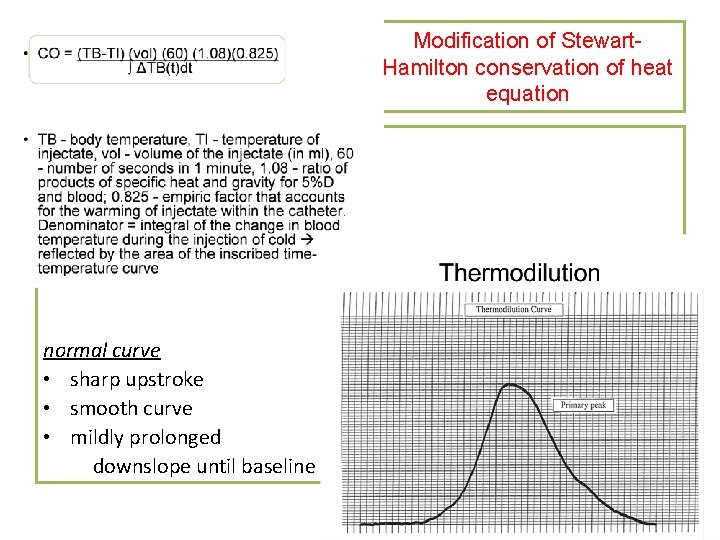
Modification of Stewart. Hamilton conservation of heat equation normal curve • sharp upstroke • smooth curve • mildly prolonged downslope until baseline
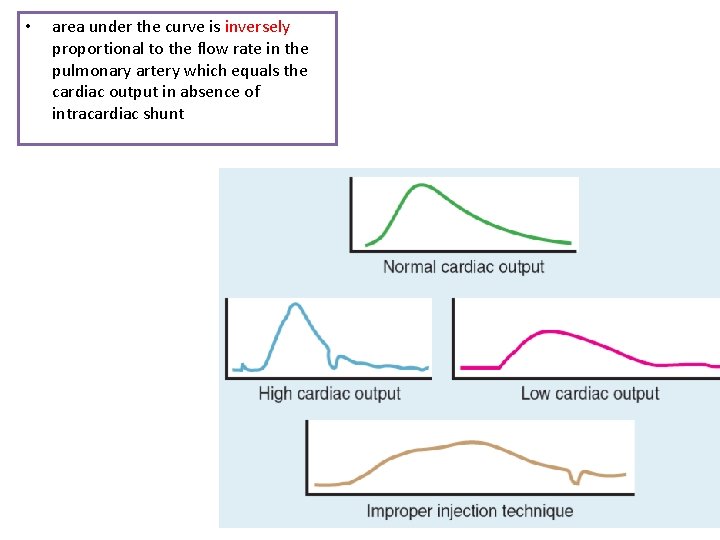
• area under the curve is inversely proportional to the flow rate in the pulmonary artery which equals the cardiac output in absence of intracardiac shunt
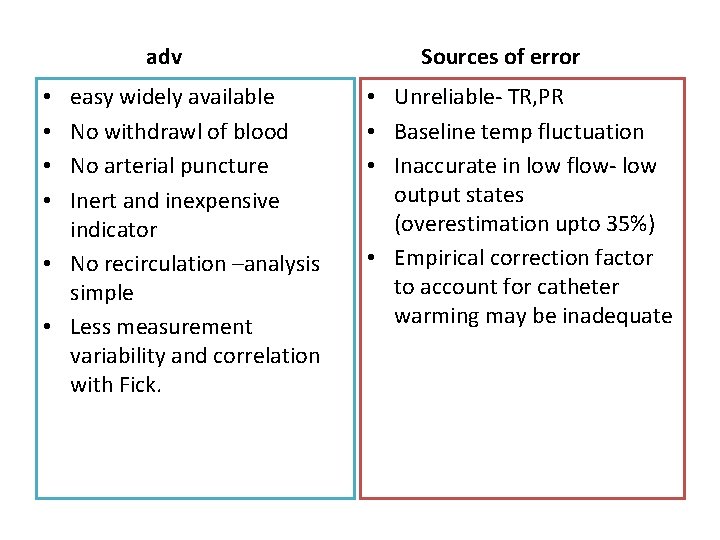
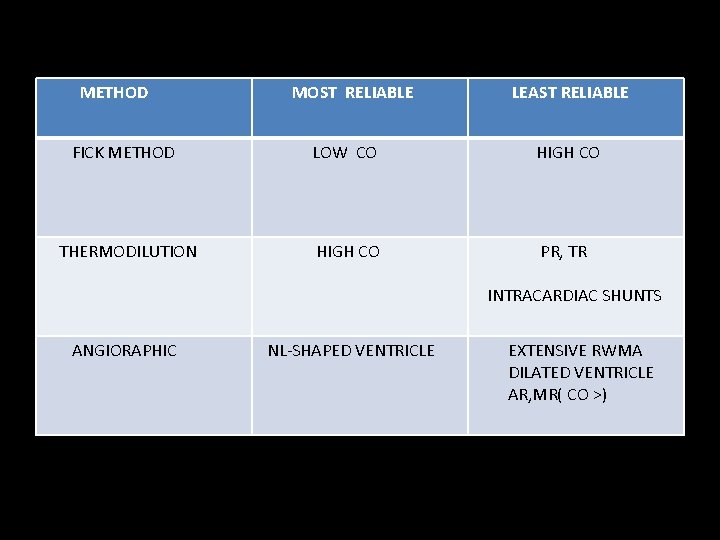
adv easy widely available No withdrawl of blood No arterial puncture Inert and inexpensive indicator • No recirculation –analysis simple • Less measurement variability and correlation with Fick. • • Sources of error • Unreliable- TR, PR • Baseline temp fluctuation • Inaccurate in low flow- low output states (overestimation upto 35%) • Empirical correction factor to account for catheter warming may be inadequate
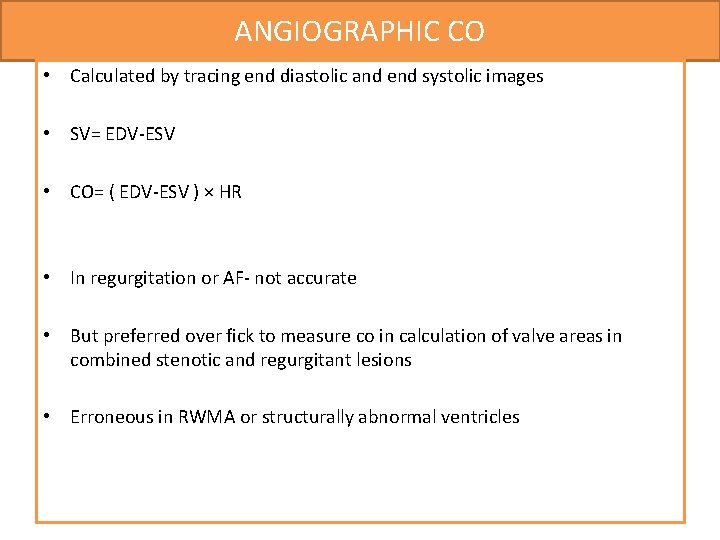
ANGIOGRAPHIC CO • Calculated by tracing end diastolic and end systolic images • SV= EDV-ESV • CO= ( EDV-ESV ) × HR • In regurgitation or AF- not accurate • But preferred over fick to measure co in calculation of valve areas in combined stenotic and regurgitant lesions • Erroneous in RWMA or structurally abnormal ventricles
METHOD MOST RELIABLE LEAST RELIABLE FICK METHOD LOW CO HIGH CO THERMODILUTION HIGH CO PR, TR INTRACARDIAC SHUNTS ANGIORAPHIC NL-SHAPED VENTRICLE EXTENSIVE RWMA DILATED VENTRICLE AR, MR( CO >)
VASCULAR RESISTANCE • Q = ΔP R OHM’S LAW (V=IR) OVERSIMPLIFICATION- pulsatile flow in dynamic and diverse vascular beds
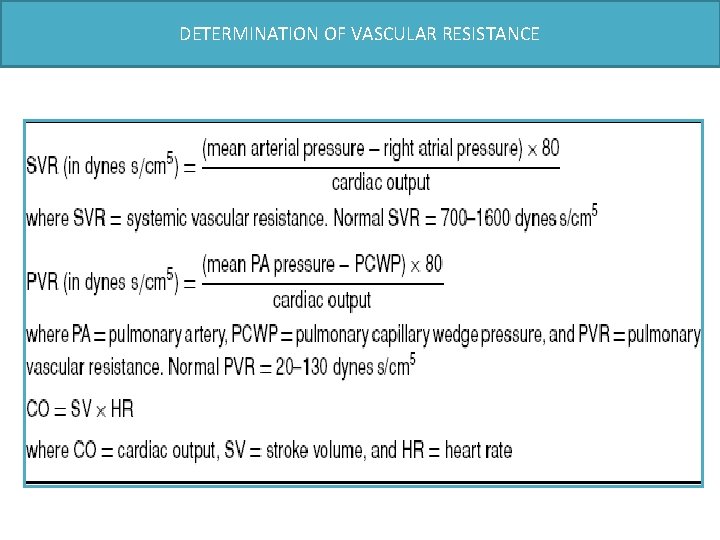
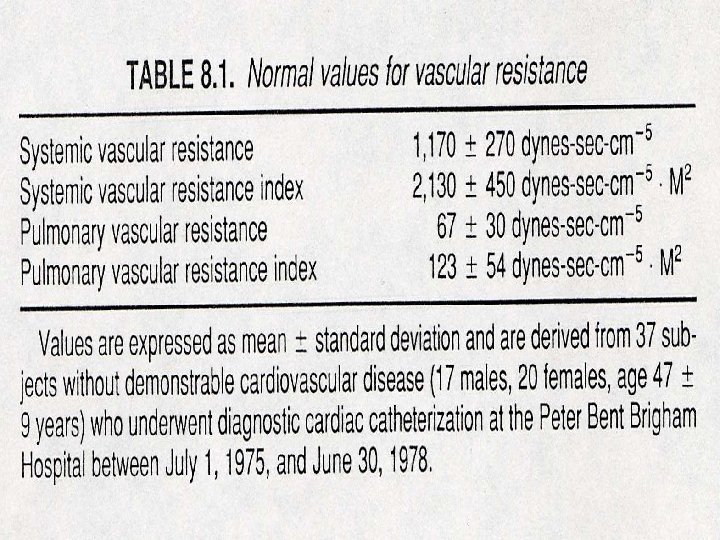
DETERMINATION OF VASCULAR RESISTANCE
VASCULAR IMPEDENCE • Vasc impedence –pulsatile pressure /pulsatile flow • Research use • Analogue is Vasc resistance
Principles of haemodynamic measurements: Pressure and flow measurements calculation of cardiac output Calculation of shunts valve area
Cardiac Catheterization: Shunt Detection • Oximetry Run (Dexter and his associates in 1947) • Early recirculation of indicator • Early appearance. of indicator in Rt heart • Angiography • Radio- nuclide techniques.
Detection, localization, and quantification of intracardiac shunts several methods • indicator dilution method is of historical interest • Contrast angiography • Oximetry, or measurement of the oxygen saturations in various locations goal of the oxygen saturation run is to measure differences in oxygen saturation in various chambers of the heart
Oxygen saturation run • Performed as a catheter is passed through the venous system, right heart, and pulmonary circulation. • samples - acquired with the patient breathing room air or a gas mixture ≤ 30% oxygen • place the catheter - PA first and then obtain samples as the catheter is withdrawn. (difficulty advancing the catheter into the pulmonary artery) ASSUMPTIONS • Body is in a steady state during the collection of samples • Complete mixing of blood is assumed in all chambers. • Blood samples should not be withdrawn into the syringe too rapidly. ( Matta et al. found that rapid aspiration increased oxygen saturations)
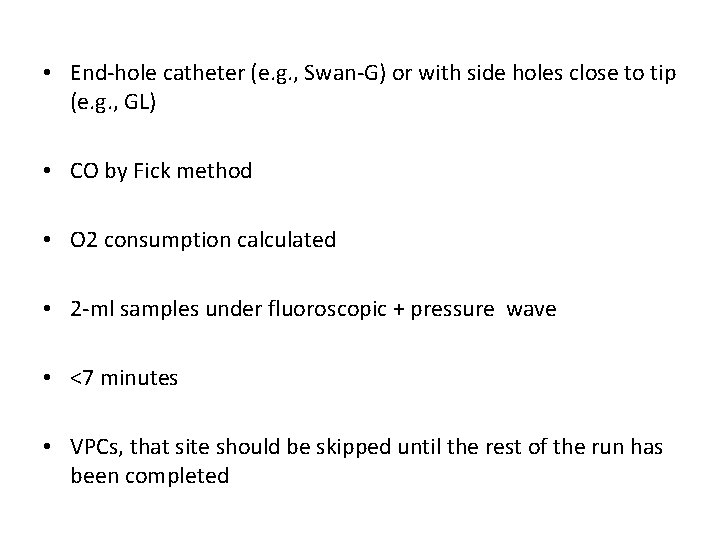
• End-hole catheter (e. g. , Swan-G) or with side holes close to tip (e. g. , GL) • CO by Fick method • O 2 consumption calculated • 2 -ml samples under fluoroscopic + pressure wave • <7 minutes • VPCs, that site should be skipped until the rest of the run has been completed
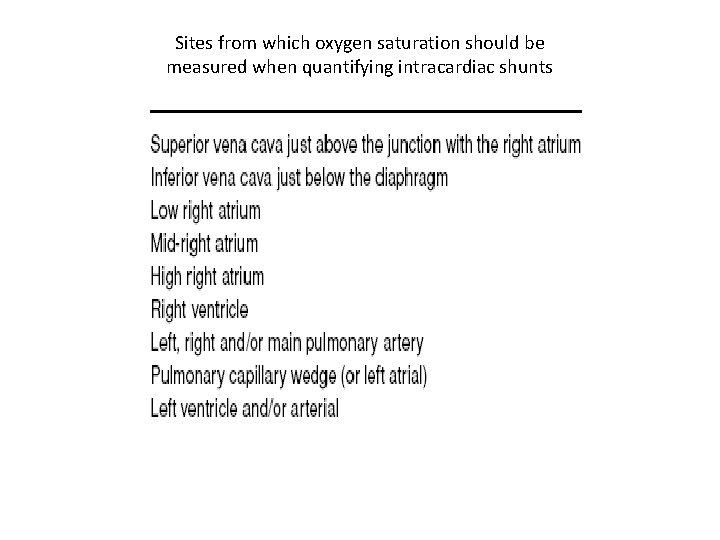
Sites from which oxygen saturation should be measured when quantifying intracardiac shunts
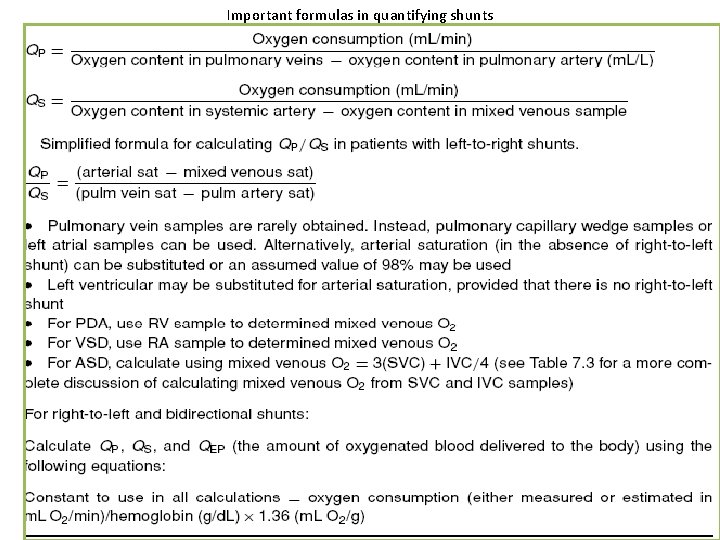
Important formulas in quantifying shunts
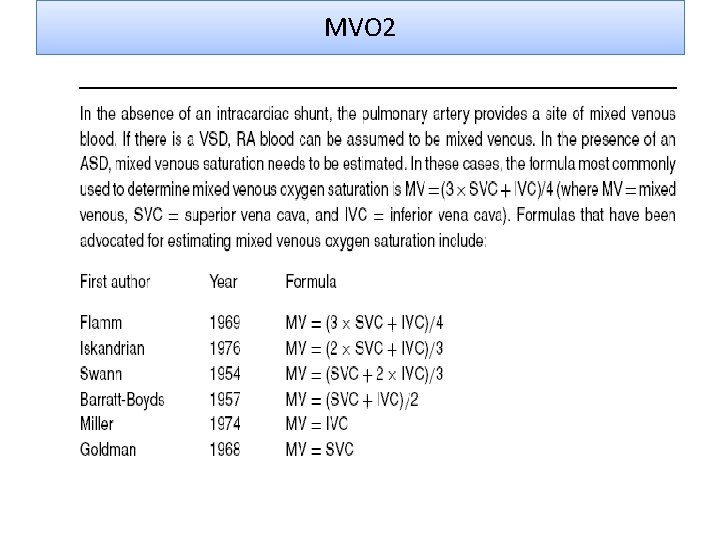
MVO 2
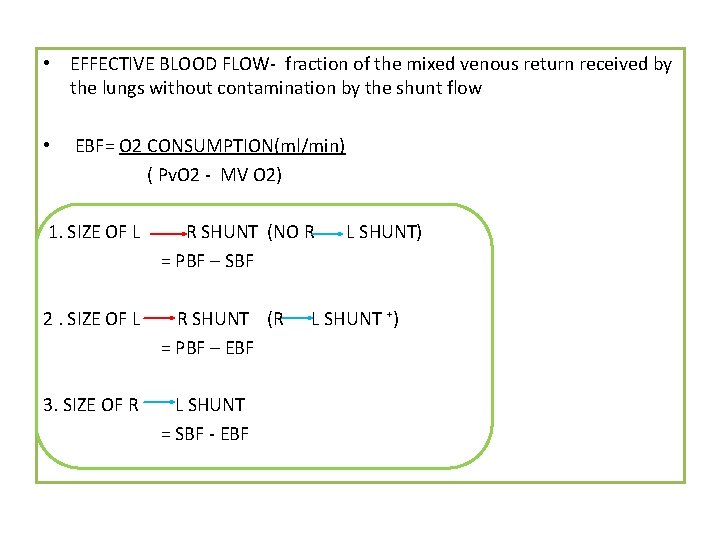
• EFFECTIVE BLOOD FLOW- fraction of the mixed venous return received by the lungs without contamination by the shunt flow • EBF= O 2 CONSUMPTION(ml/min) ( Pv. O 2 - MV O 2) 1. SIZE OF L R SHUNT (NO R = PBF – SBF 2. SIZE OF L R SHUNT (R = PBF – EBF 3. SIZE OF R L SHUNT = SBF - EBF L SHUNT) L SHUNT ⁺)
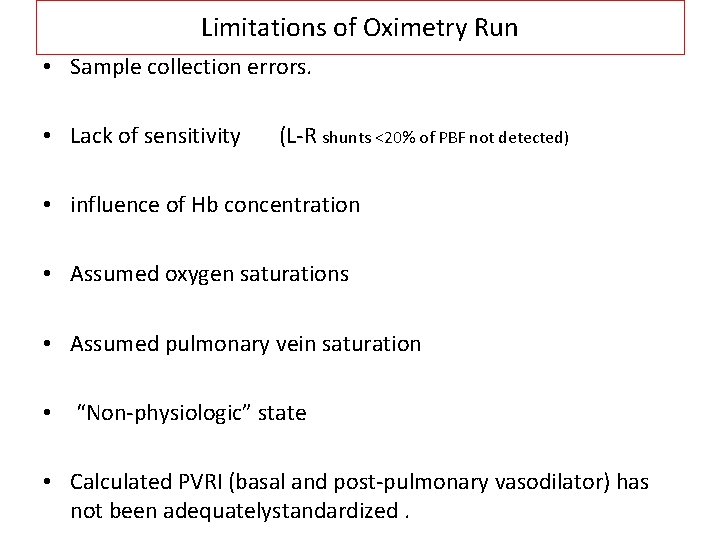
Limitations of Oximetry Run • Sample collection errors. • Lack of sensitivity (L-R shunts <20% of PBF not detected) • influence of Hb concentration • Assumed oxygen saturations • Assumed pulmonary vein saturation • “Non-physiologic” state • Calculated PVRI (basal and post-pulmonary vasodilator) has not been adequatelystandardized.
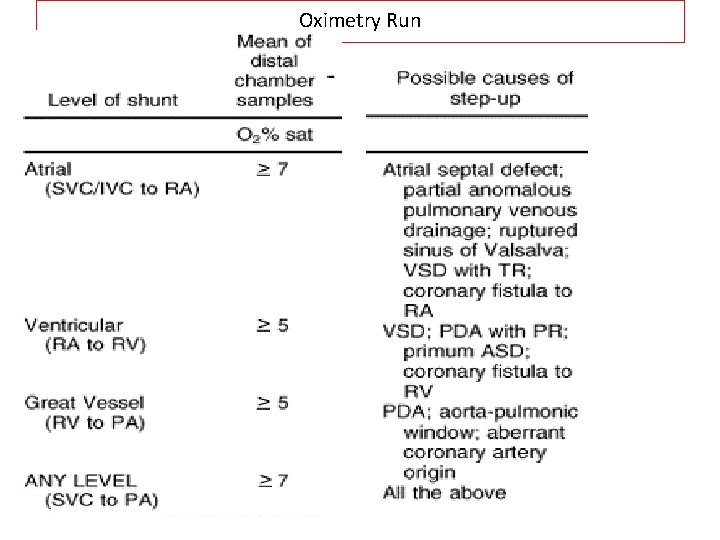
Oximetry Run • • • Level Step-Up Atrial >9% ventricular >6% Grt Vessel 5% Any level 8% ( SVC - PA) Q. P. /Qs 1. 5 -1. 9 1. 3 -1. 5 1. 3 1. 5
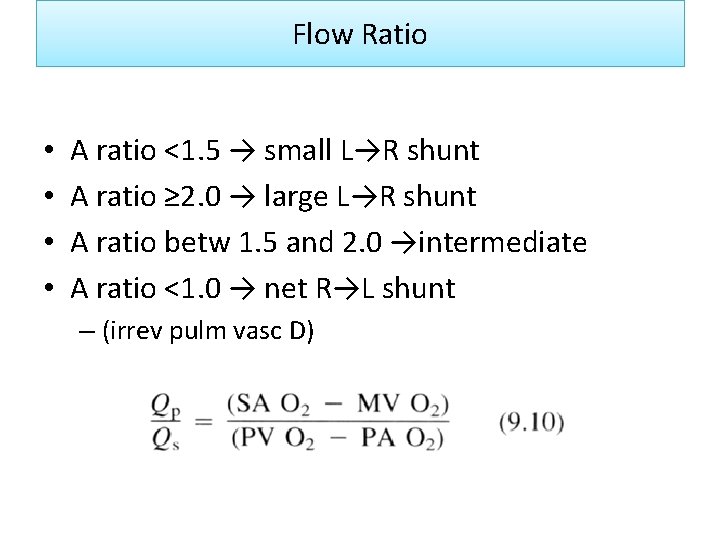
Flow Ratio • • A ratio <1. 5 → small L→R shunt A ratio ≥ 2. 0 → large L→R shunt A ratio betw 1. 5 and 2. 0 →intermediate A ratio <1. 0 → net R→L shunt – (irrev pulm vasc D)
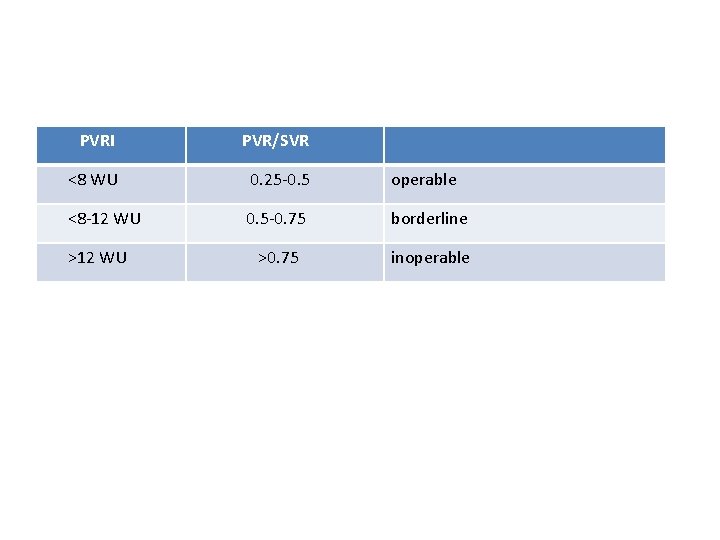
PVRI PVR/SVR <8 WU 0. 25 -0. 5 operable <8 -12 WU 0. 5 -0. 75 borderline >0. 75 inoperable >12 WU
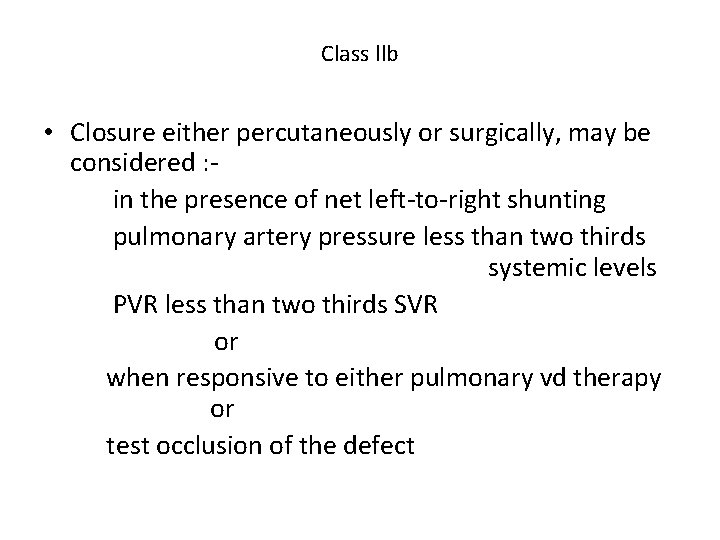
Class llb • Closure either percutaneously or surgically, may be considered : in the presence of net left-to-right shunting pulmonary artery pressure less than two thirds systemic levels PVR less than two thirds SVR or when responsive to either pulmonary vd therapy or test occlusion of the defect
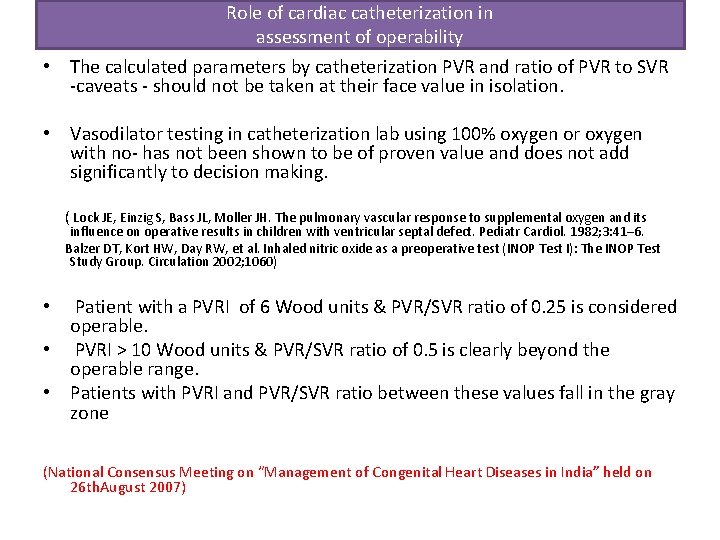
Role of cardiac catheterization in assessment of operability • The calculated parameters by catheterization PVR and ratio of PVR to SVR -caveats - should not be taken at their face value in isolation. • Vasodilator testing in catheterization lab using 100% oxygen or oxygen with no- has not been shown to be of proven value and does not add significantly to decision making. ( Lock JE, Einzig S, Bass JL, Moller JH. The pulmonary vascular response to supplemental oxygen and its influence on operative results in children with ventricular septal defect. Pediatr Cardiol. 1982; 3: 41– 6. Balzer DT, Kort HW, Day RW, et al. Inhaled nitric oxide as a preoperative test (INOP Test I): The INOP Test Study Group. Circulation 2002; 1060) Patient with a PVRI of 6 Wood units & PVR/SVR ratio of 0. 25 is considered operable. • PVRI > 10 Wood units & PVR/SVR ratio of 0. 5 is clearly beyond the operable range. • Patients with PVRI and PVR/SVR ratio between these values fall in the gray zone • (National Consensus Meeting on “Management of Congenital Heart Diseases in India” held on 26 th. August 2007)
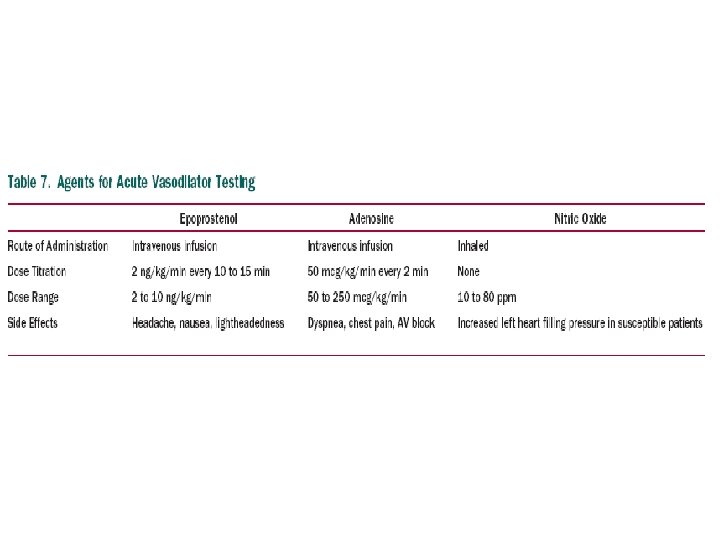
• Operability-determination of the severity of PAH and the degree of vasoreactivity of the pulmonary circulation. • Agents used to elicit such reaction should ideally have an effect on PVR but not on the systemic circulation • Inhaled 100% oxygen mc. • recomm- short-acting vasodil - inhaled no, iv epoprostenol, or adenosine • An acute reduction of the mean PAP of 10 mm. Hg or greater with a resultant mean PAP of 40 mm. Hg or less without a fall in CO is considered a positive response to acute vasodilator testing • In patients with evidence of vasoreactivity during acute testing but high pulmonary vascular resistance and bidirectional shunting - balloon test occlusion • A drop in CO &/ increase in RV filling pressures-may suggest 1)a low likelihood to benefit from permanent repair 2)higher perioperative risk
• On O 2 adm- if diastolic pressures fall significantly (10 mm Hg) & mean pressure by about 5 mm Hg- reversible PAP and operability.
Calculation Of Stenotic Valve Orifice Area
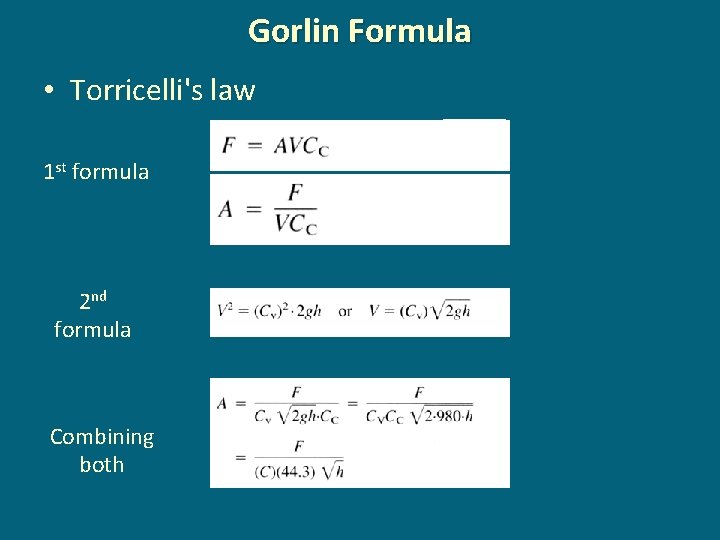
Gorlin Formula • Torricelli's law 1 st formula 2 nd formula Combining both
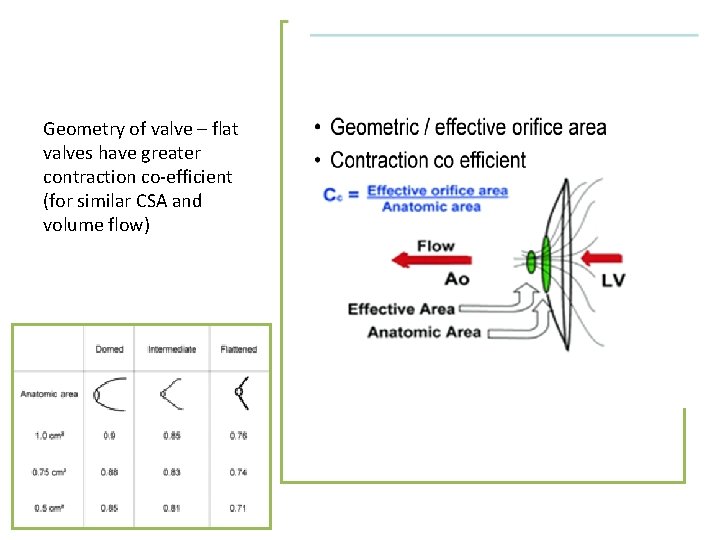
Geometry of valve – flat valves have greater contraction co-efficient (for similar CSA and volume flow)
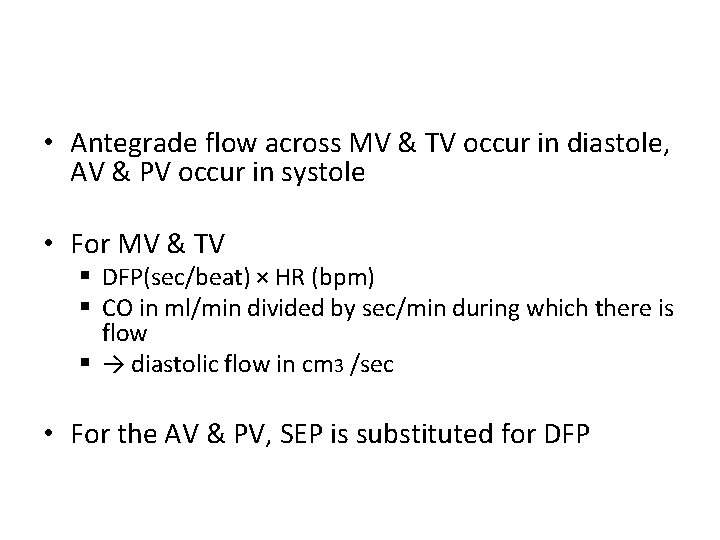
• Antegrade flow across MV & TV occur in diastole, AV & PV occur in systole • For MV & TV § DFP(sec/beat) × HR (bpm) § CO in ml/min divided by sec/min during which there is flow § → diastolic flow in cm 3 /sec • For the AV & PV, SEP is substituted for DFP
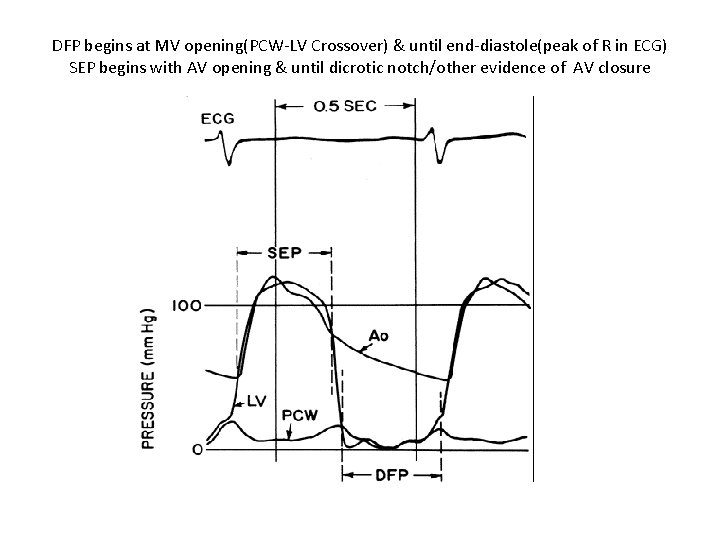
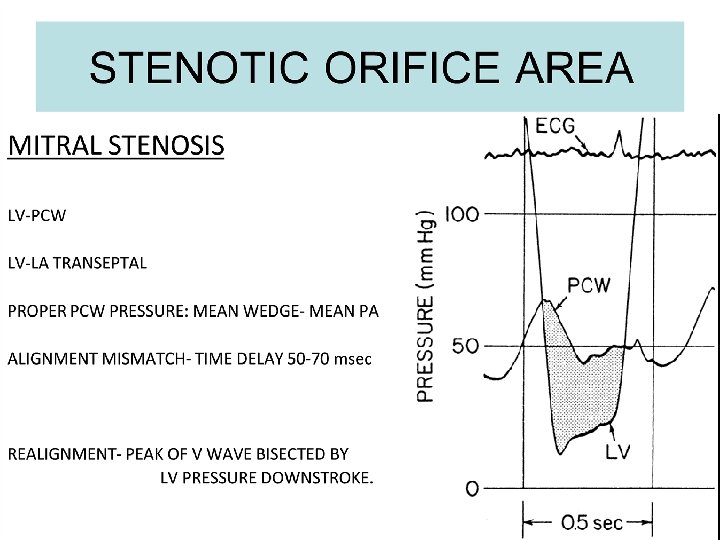
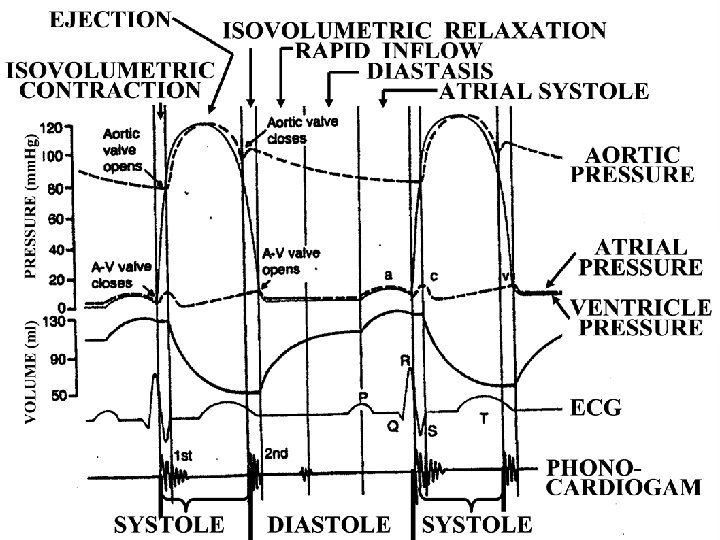
DFP begins at MV opening(PCW-LV Crossover) & until end-diastole(peak of R in ECG) SEP begins with AV opening & until dicrotic notch/other evidence of AV closure
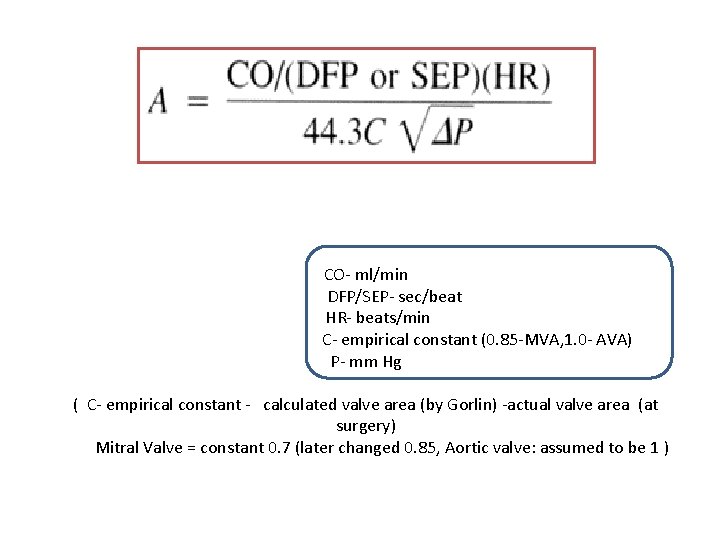
CO- ml/min DFP/SEP- sec/beat HR- beats/min C- empirical constant (0. 85 -MVA, 1. 0 - AVA) P- mm Hg ( C- empirical constant - calculated valve area (by Gorlin) -actual valve area (at surgery) Mitral Valve = constant 0. 7 (later changed 0. 85, Aortic valve: assumed to be 1 )
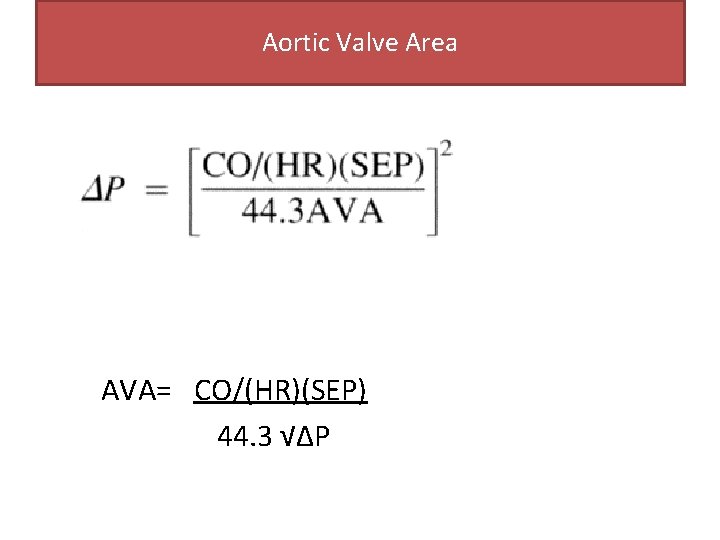
Aortic Valve Area AVA= CO/(HR)(SEP) 44. 3 √∆P
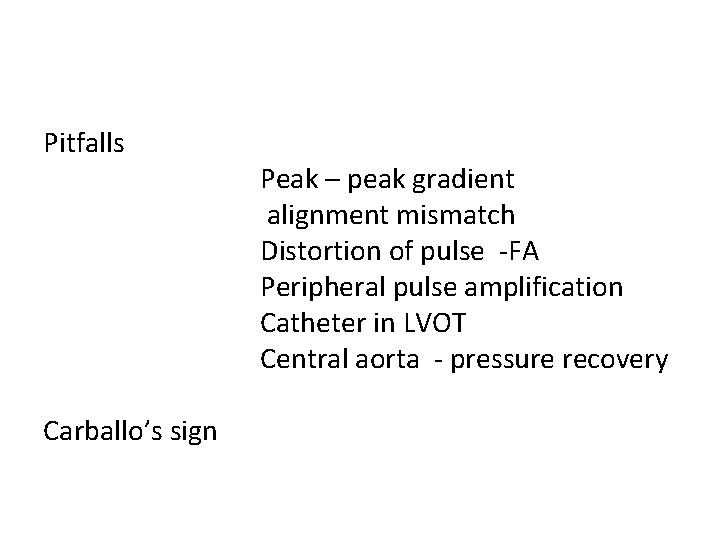
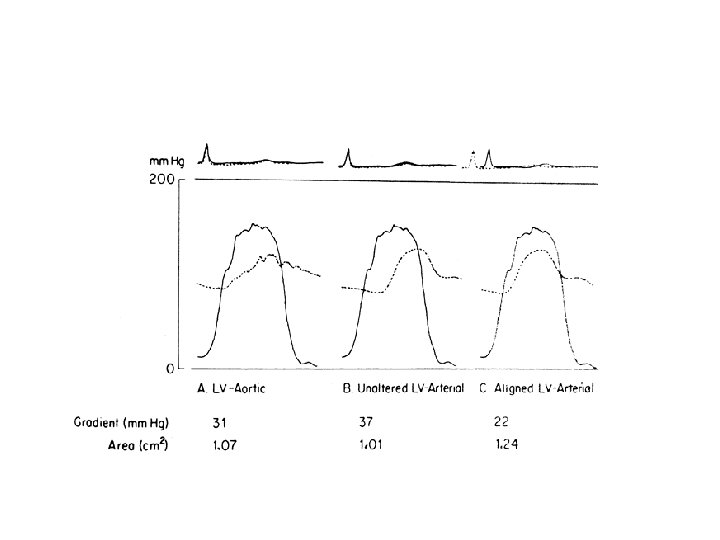
Pitfalls Carballo’s sign Peak – peak gradient alignment mismatch Distortion of pulse -FA Peripheral pulse amplification Catheter in LVOT Central aorta - pressure recovery
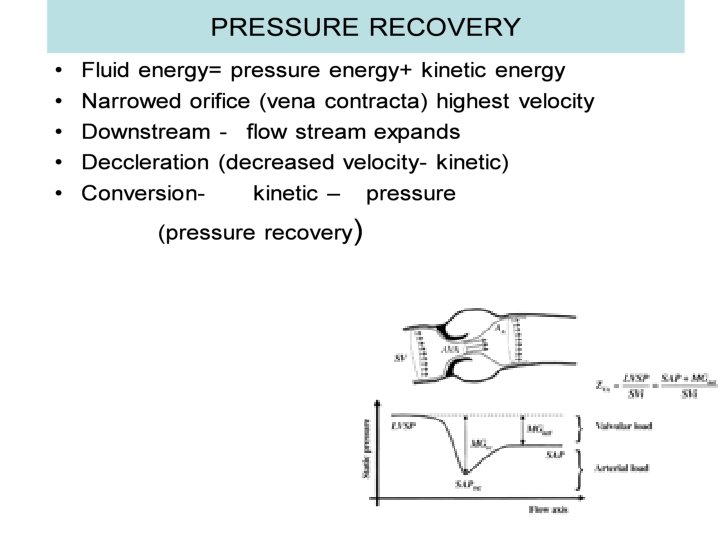
• Doppler derived gradients- using CW doppler @ vena contracta • Catheter derived gradients- downstream vena contractapressure recovery • Pressure recovery is more across aortic than at mitral • prosthetic valve> native valve. • Pressure recovery- exaggerated in • Smaller aorta Stiffer aorta Hypertension GRADIENT DERIVED BY CATH IS LOWER THAN DOPPLER DERIVED GRADIENT
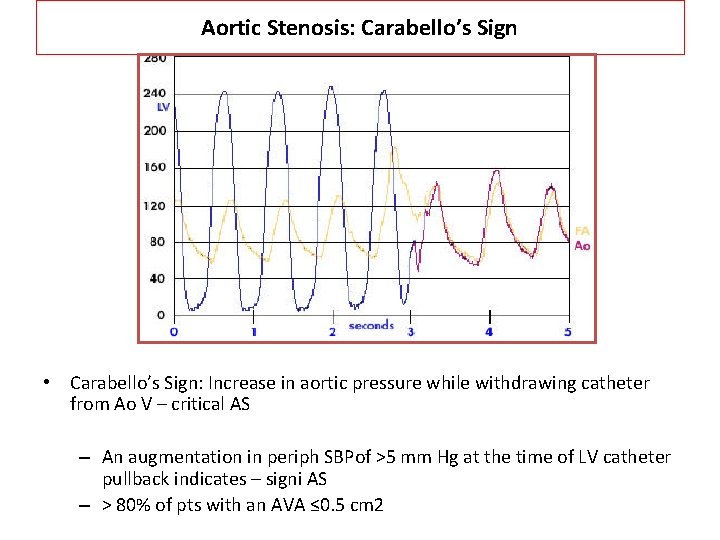
Aortic Stenosis: Carabello’s Sign • Carabello’s Sign: Increase in aortic pressure while withdrawing catheter from Ao V – critical AS – An augmentation in periph SBPof >5 mm Hg at the time of LV catheter pullback indicates – signi AS – > 80% of pts with an AVA ≤ 0. 5 cm 2
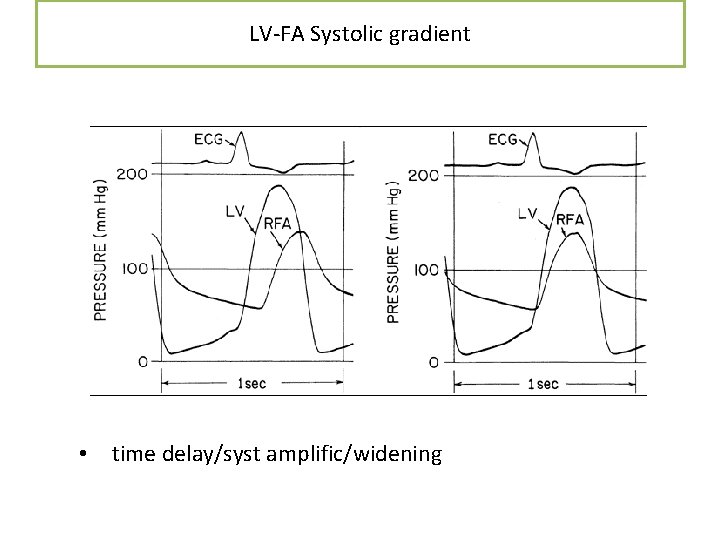
LV-FA Systolic gradient • time delay/syst amplific/widening
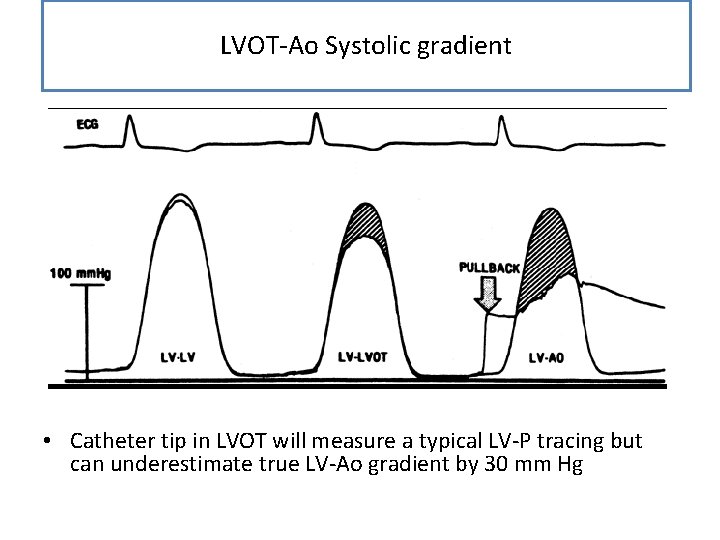
LVOT-Ao Systolic gradient • Catheter tip in LVOT will measure a typical LV-P tracing but can underestimate true LV-Ao gradient by 30 mm Hg
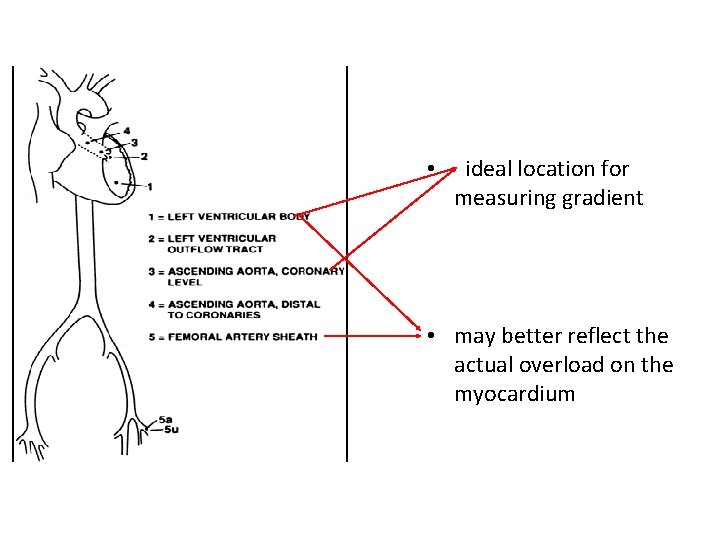
• ideal location for measuring gradient • may better reflect the actual overload on the myocardium
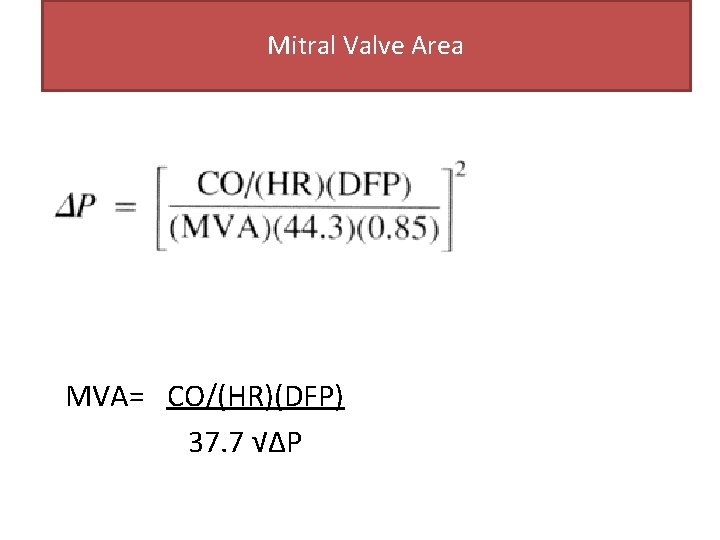
Mitral Valve Area MVA= CO/(HR)(DFP) 37. 7 √∆P
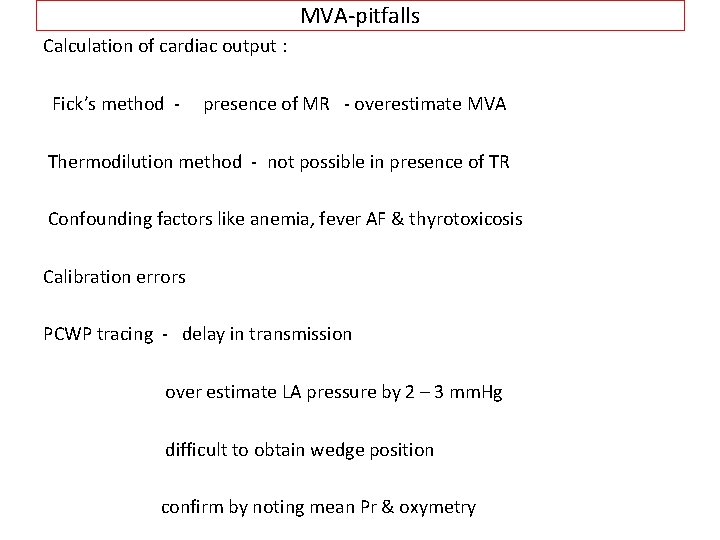
MVA-pitfalls Calculation of cardiac output : Fick’s method - presence of MR - overestimate MVA Thermodilution method - not possible in presence of TR Confounding factors like anemia, fever AF & thyrotoxicosis Calibration errors PCWP tracing - delay in transmission over estimate LA pressure by 2 – 3 mm. Hg difficult to obtain wedge position confirm by noting mean Pr & oxymetry
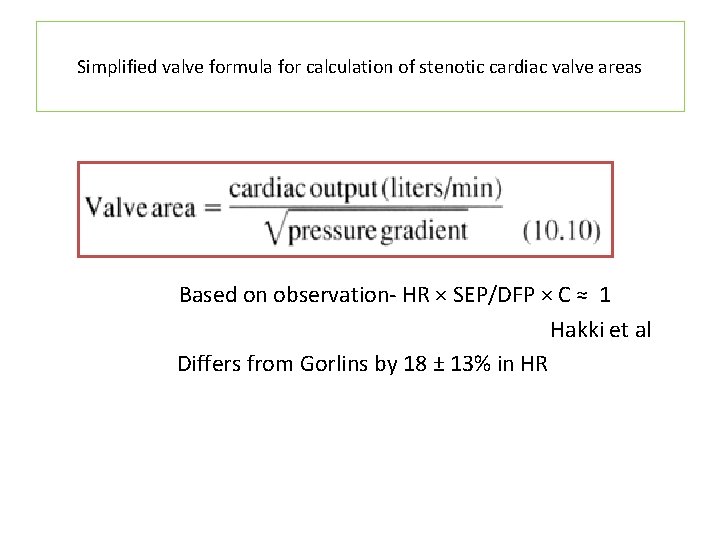
Simplified valve formula for calculation of stenotic cardiac valve areas Based on observation- HR × SEP/DFP × C ≈ 1 Hakki et al Differs from Gorlins by 18 ± 13% in HR
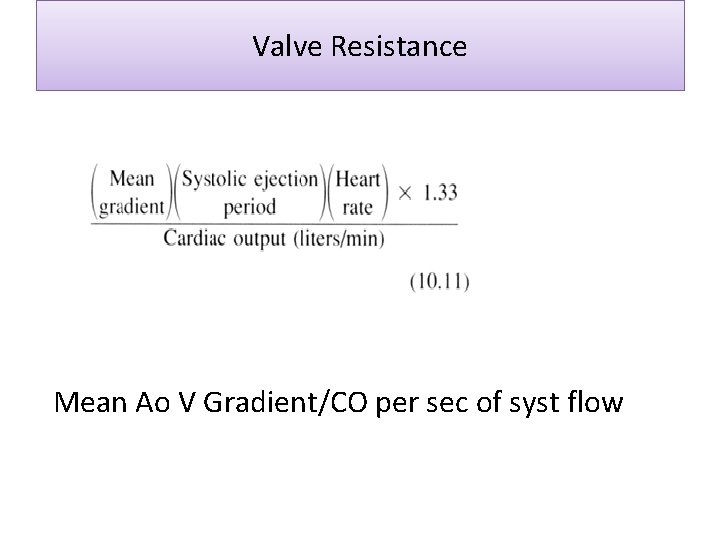
Valve Resistance Mean Ao V Gradient/CO per sec of syst flow
Thank u
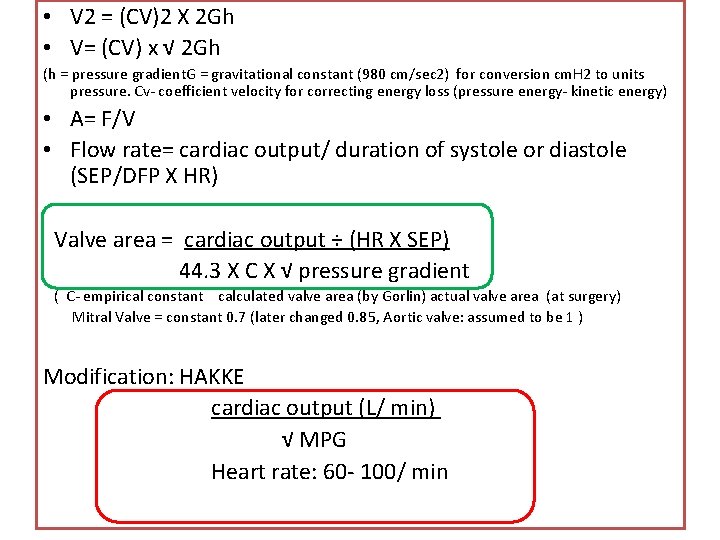
• V 2 = (CV)2 X 2 Gh • V= (CV) x √ 2 Gh (h = pressure gradient. G = gravitational constant (980 cm/sec 2) for conversion cm. H 2 to units pressure. Cv- coefficient velocity for correcting energy loss (pressure energy- kinetic energy) • A= F/V • Flow rate= cardiac output/ duration of systole or diastole (SEP/DFP X HR) Valve area = cardiac output ÷ (HR X SEP) 44. 3 X C X √ pressure gradient ( C- empirical constant calculated valve area (by Gorlin) actual valve area (at surgery) Mitral Valve = constant 0. 7 (later changed 0. 85, Aortic valve: assumed to be 1 ) Modification: HAKKE cardiac output (L/ min) √ MPG Heart rate: 60 - 100/ min
AVA Pull back hemodynamics : Peak – peak gradient alignment mismatch Distortion of pulse - femoral artery peripheral pulse amplification catheter in LVOT central aorta - pressure recovery Carballo’s sign
Reflected waves • The forward P wave is modified by summation with a reflected P wave • Major effective reflection sites in humansterminal abd Ao (↑reflected W and hence peak Ao P in B/L femoral occlu)
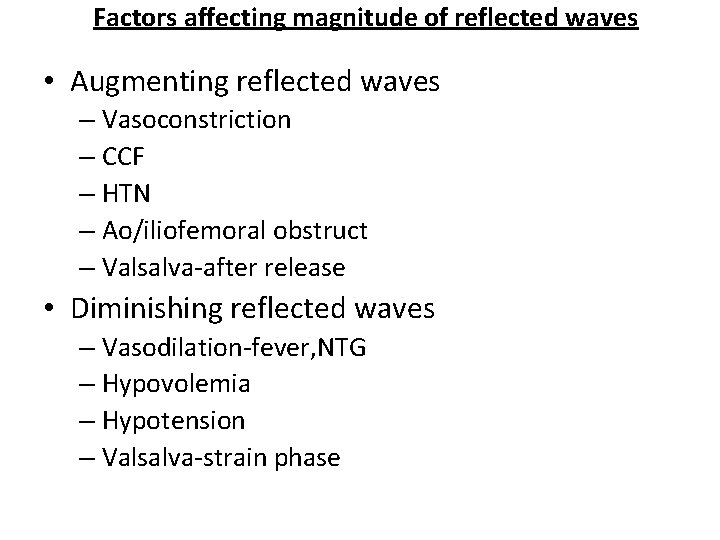
Factors affecting magnitude of reflected waves • Augmenting reflected waves – Vasoconstriction – CCF – HTN – Ao/iliofemoral obstruct – Valsalva-after release • Diminishing reflected waves – Vasodilation-fever, NTG – Hypovolemia – Hypotension – Valsalva-strain phase
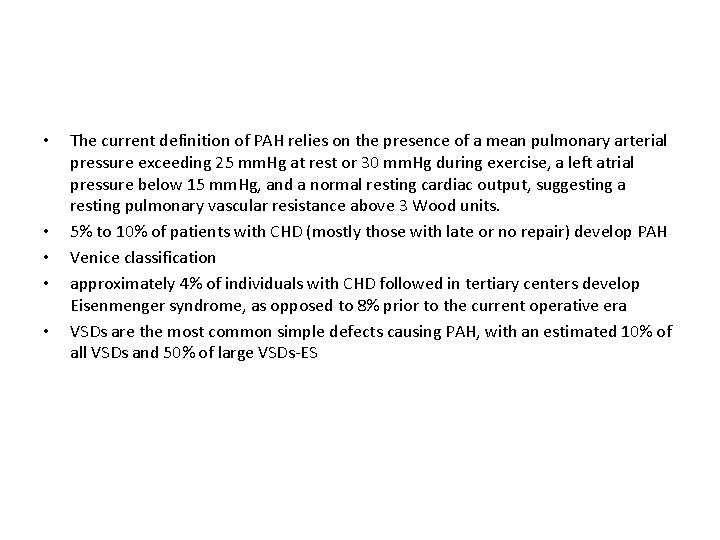
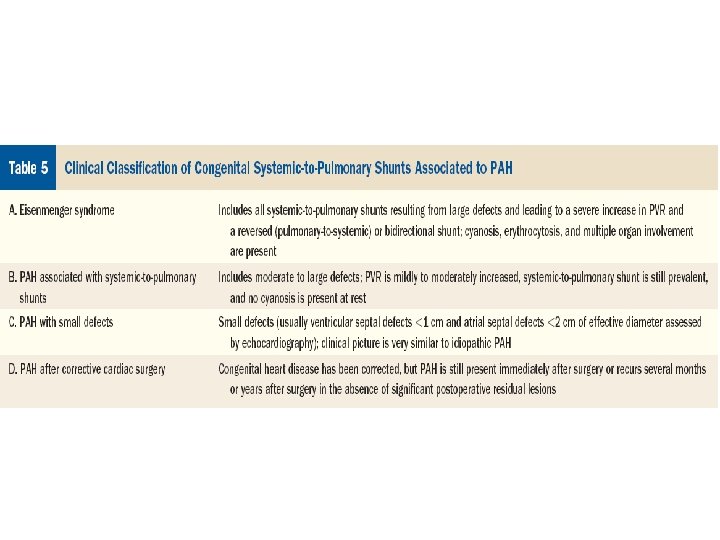
• • • The current definition of PAH relies on the presence of a mean pulmonary arterial pressure exceeding 25 mm. Hg at rest or 30 mm. Hg during exercise, a left atrial pressure below 15 mm. Hg, and a normal resting cardiac output, suggesting a resting pulmonary vascular resistance above 3 Wood units. 5% to 10% of patients with CHD (mostly those with late or no repair) develop PAH Venice classification approximately 4% of individuals with CHD followed in tertiary centers develop Eisenmenger syndrome, as opposed to 8% prior to the current operative era VSDs are the most common simple defects causing PAH, with an estimated 10% of all VSDs and 50% of large VSDs-ES