Principle of Business Statistics Displaying and Describing Quantitative

Principle of Business Statistics Displaying and Describing Quantitative Data Readings: Chapter 3, 6, 7 Qiao Yang Shanghaitech Lecture 2

Displaying Data l Quantitative, or Interval Variables Ø Histogram

Histogram

Shape of the Histogram – Symmetry

Shape of the Histogram – Skewness

Shape of the Histogram – Skewness

Measure of Central Tendency – Mean Population Sample Number of observations N n Mean µ (“mu”) How to find

Measures of Central Tendency – Median ① Median Ø Order observations from smallest (in value) to the largest Ø Find the middle - that would be the median of your data

Measures of Central Tendency - Mode and Median

Why median is smaller than the mean?

Why mean is smaller than the median?

Normal Distribution What are the median and mean of the population? Why does the population mean equal to the population median? Why isn’t the sample mean equal to the sample median? How can we explain numerical difference between the sample statistic and the population parameter?

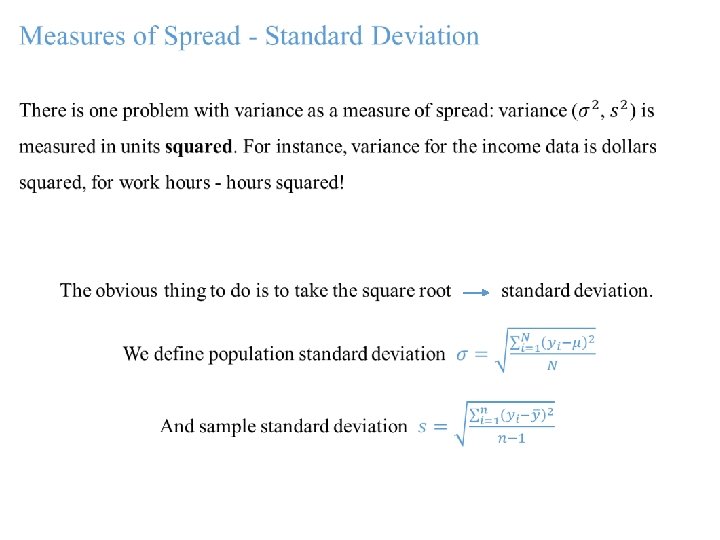
Measure of Spread - Range l Range - is an absolute difference between the smallest and the largest value in the data

Number of observations Variance How to find Population Sample N n

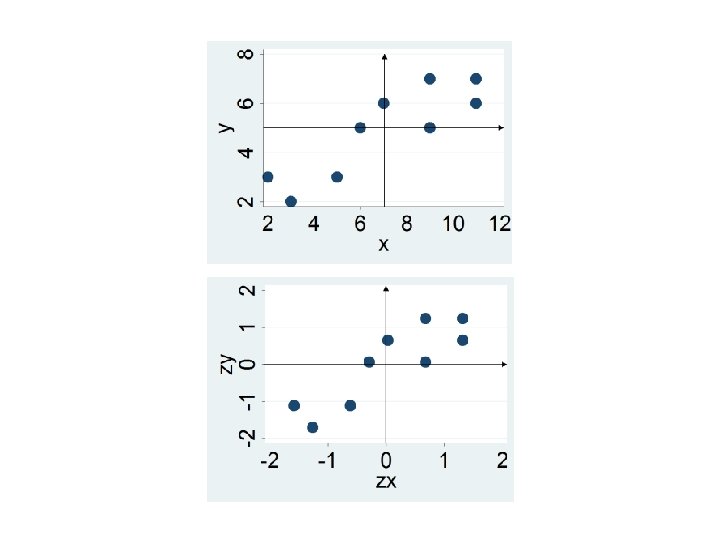
Scatter plot

Variable X has mean of 6. 9 and standard deviation 3. 1

Variable Y has mean of 4. 9 and standard deviation 1. 7
- Slides: 21