Principal Component Analysis PCA Markku HautaKasari Jussi Parkkinen
 Markku Hauta-Kasari Jussi Parkkinen University of Joensuu Color Group FINLAND")


 spectrum 1. calculating correlation matrix and eigenvectors,")


- Slides: 23
Principal Component Analysis (PCA) Markku Hauta-Kasari Jussi Parkkinen University of Joensuu Color Group FINLAND
Algorithm 1. 2. 3. 4. Calculate correlation matrix for the data set Calculate eigenvalues and eigenvectors for the correlation matrix Select eigenvectors corresponding to the largest eigenvalues as a new basis for the data set Calculate principal components between eigenvectors and the data set Applications: compression, pattern recognition etc. Frequently used for spectral image data
An example on calculating the PCA Example on PCA for the data set of 2 dimensional vectors
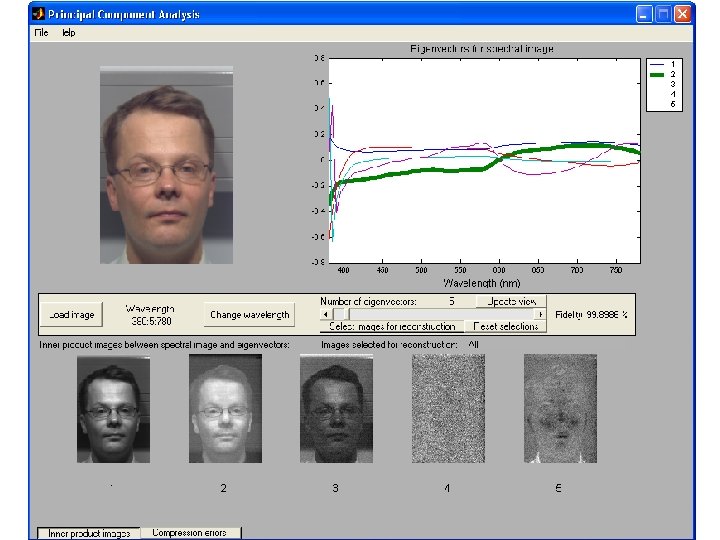
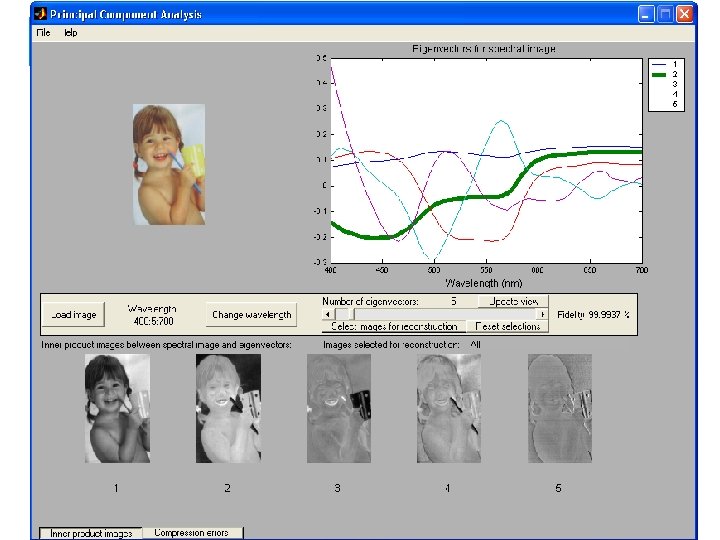
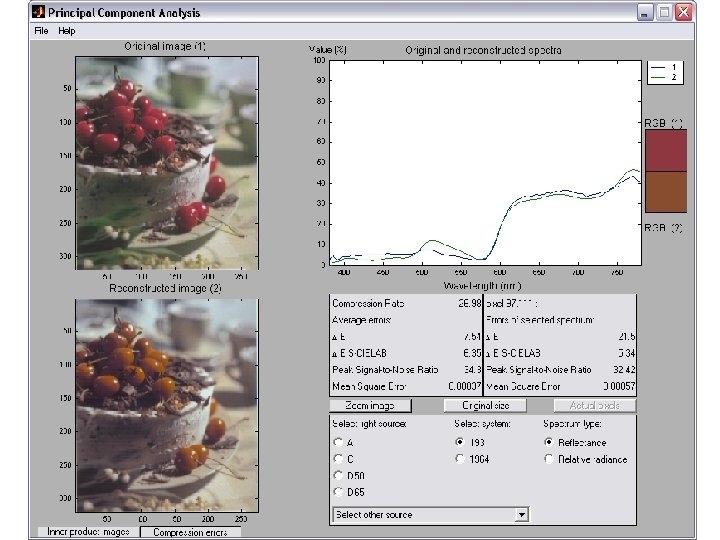
Spectral Images & Principal Component Analysis (PCA) spectrum 1. calculating correlation matrix and eigenvectors, selecting base vectors 2 -D spectral image Matrix B needs to be transposed 2. calculating inner product images 3. reconstructing spectral image
Illustration of PCA base vectors B original spectral image S 1. 2. inner product images P
Illustration of PCA base vectors B ~ reconstructed spectral image S 3. inner product images P
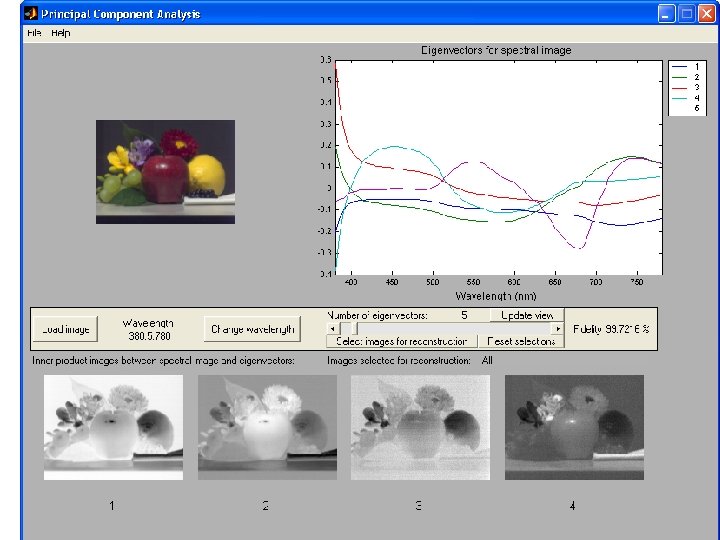
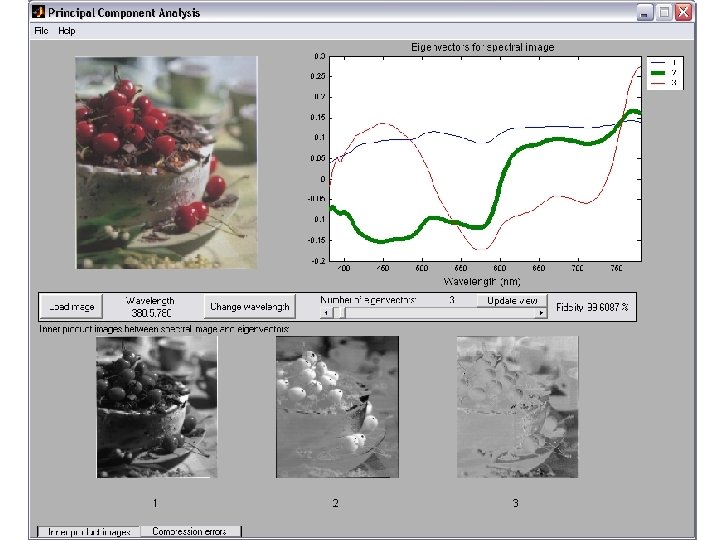
An example of the PCA for the spectral image of printed product
Eigenvectors in case of the pure radiance data
Eigenvectors in case, in which the data is multiplied by a spectral sensitivity of a human eye and by the used light source
Inner-product images between the spectral images and eigenvectors Inner-product images between eigenvectors and data, which is multiplied by a spectral sensitivity of a human eye and the used light source
An example of the PCA for the spectral image measured from the PDA-display
Sample spectral images of a PDA-display
Light sources PDA display and external illumination
Inner-product images between the spectral images and eigenvectors Corresponding eigenvectors
Inner-product images between eigenvectors and data, which is multiplied by a spectral sensitivity of a human eye and by the used light source Corresponding eigenvectors
Inner-product images between the spectral images and eigenvectors Corresponding eigenvectors
Inner-product images between eigenvectors and data, which is multiplied by a spectral sensitivity of a human eye and by the used light source Corresponding eigenvectors
Summary PCA can be effectively used for spectral image compression PCA can be used for pattern recognition tasks Exercises on implementing the PCA