Primary Improvement Jacky Castle Lead Primary Commissioner North


- Slides: 29
Primary Improvement Jacky Castle, Lead Primary Commissioner –North East
Primary Overview for 2016 Early Years and Key Stage 1 Essex England EYFS GLD 72% 69% Year 1 Phonics (required level) 81% KS 1 Reading - at least expected standard 77% 74% KS 1 Writing - at least expected standard 68% 65% KS 1 Maths - at least expected standard 74% 73% KS 1 RWM - at least expected standard Key Stage 2 63% Essex England KS 2 RWM – at least expected standard 56% 53% KS 2 Reading - at least expected standard 67% 66% KS 2 Writing - at least expected standard 76% 73% KS 2 Maths - at least expected standard 71% 70% KS 1 -2 Progress score - Reading -0. 22 0 KS 1 -2 Progress score - Writing 0. 41 0 KS 1 -2 Progress score - Maths 0. 04 0 2
What was achieved in Primary school inspections last year…. • 7 new outstanding schools, of which 2 were previously judged Requiring Improvement • 36 new good schools – of which 2 were previously inadequate However… • 6 schools judged inadequate (3 previously good schools) • 1 school judged Requiring Improvement, (previously good) 3
Ofsted overview – Primary schools to 3 November 16 4
Inspections in Essex since September 16 Key implications: • Greater focus on the most able: Ensure sufficient challenge and depth to teacher subject knowledge to ensure higher standards across the curriculum • Teachers and leaders to make more regular and effective checks on the progress of pupils, including the disadvantaged, from their varying starting points, ensuring teachers’ feedback is precise about what a pupil needs to do to improve • Equipping middle leaders with the strategies and skills to enable them to fulfil their responsibilities of monitoring and improving the school’s work in the areas for which they are accountable • Safeguarding - establishing rigorous procedures through which governors monitor the work of leaders to ensure that the school’s own safeguarding systems and processes are robustly in line with current statutory guidelines. 7
Excellence in Essex Primary Schools Revised version includes alignment with Df. E Schools Causing Concern Statutory Guidance (SCC) - Intervening in failing, under performing and coasting schools (March 2016) and Df. E Primary School Accountability in 2016 (October 2016) Includes Coasting Schools, National Floor Standards and An Essex threshold setting out what we consider is ‘unacceptable low standards’. Challenge the effectiveness of governing bodies in holding leaders and themselves to account for improved performance.
Based on provisional KS 2 data 11 Essex schools will fall within the coasting schools definition based on the recent confirmed progress thresholds for 2016 13 Essex school’s data places the school below the National Floor Standard 126 congratulations letters sent to schools No school will be confirmed as being below the floor or coasting until December 2016 when schools’ performance tables are published.
RAG process – Autumn term • For a small number of schools, where there are previous indicators of concern or a significant inconsistency between subjects, the RAG will have changed this term. The 2016 data is not being compared with 2015 outcomes. • Data has been scrutinised and, where there is cause for concern, the school’s SEC will arrange a visit to discuss data and determine whether additional action should be taken. The pragmatic reason for changing any school’s RAG rating mid-term is to enable additional support from the Standards and Excellence team • At the end of the Autumn term there will be a RAG review of all schools using the revised criteria approved at the EPHA Executive on 6 October. • Schools will be notified of the RAG in January. Where there is a change, the SEC will initially contact the school, a 8 letter will be sent to each school.
Commissioned support and pattern of visits as a result of a school’s RAG rating. 9
Log in to Perspective Lite at https: //perspective. angelsolutions. co. uk/
Click here and go to Document Pool
Select what you want
If you select 2016 KS 1 to KS 2 Progress you will get to your progress reports but also the 2016 KS 12 Slicer This is new this year
If you want the Primary Summary Support you will get all schools as an excel file and yours as a PDF (old One Page Summary)
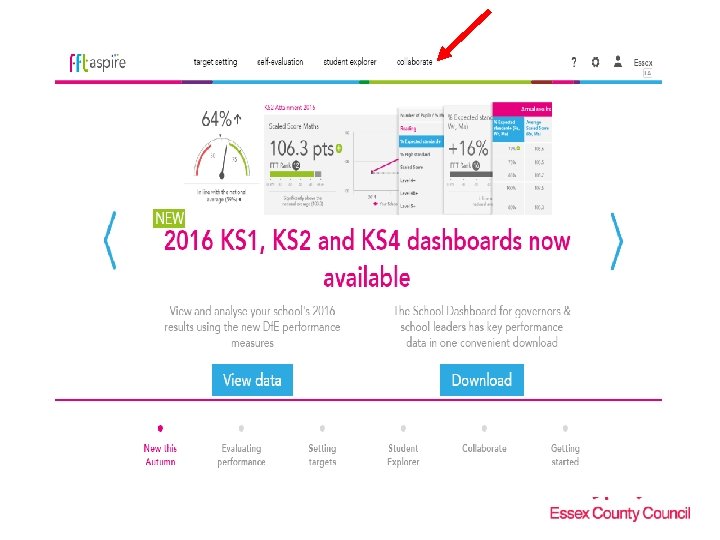
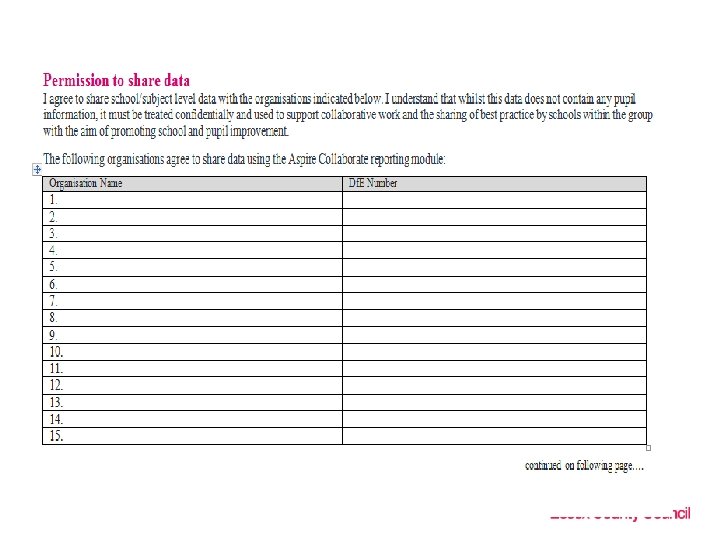
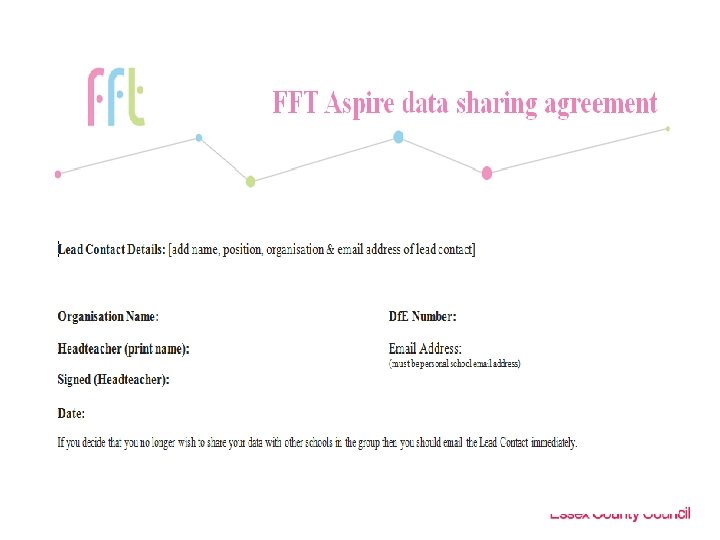
Log in to FFT https: //fftaspire. org/
Raise the achievement of all disadvantaged children 20
Support for school self evaluation Project 1 - Maximising the use of the Essex toolkit – to promote the use of the toolkit to support school’s developing their own approaches to self-evaluation of their pupil premium strategy. NORTH-EAST – Monday 5 th December at 1: 15 p. m. Venue: Willow Brook Primary School, Colchester SOUTH – Monday 28 th November at 1: 15 p. m. Venue: Lee Chapel Teaching School Project 2 – Ongoing support for a pupil premium strategy – to provide additional support for identified schools who may be Ofsted good, but gaps are stubborn and therefore differences in achievement are not diminishing. Project 3 – Disseminating knowledge from research findings to improve life chances for disadvantaged pupils. .
What does Ofsted inspect? • The level of pupil premium funding received by the school in the current academic year and levels of funding received in previous years • How leaders and governors have spent the pupil premium, their rationale for this spending and their intended impact • Any differences made to the learning and progress of disadvantaged pupils as shown by outcomes data and inspection evidence. ‘Leaders and governors focus consistently improving outcomes for all pupils, but especially for disadvantaged pupils. They are uncompromising in their ambition’ Outstanding statement for leadership and management 22
Checking school reporting School websites should report the following: • In the previous academic year 2015/2016: – How the pupil premium allocation was spent – The impact of the expenditure on eligible and other pupils. – Remember that information on the website is for parents and carers so should be presented in a form that they will find accessible. 23
Checking school reporting In the current year 2016/2017: – your school’s pupil premium grant allocation amount – a summary of the main barriers to educational achievement faced by eligible pupils – how you’ll spend the pupil premium to address those barriers and the reasons for that approach – how you’ll measure the impact of the pupil premium – the date of the next review of the school’s pupil premium strategy. 24
External accountability review Should include: – A clear rationale for a school’s pupil premium strategy, identifying key barriers but aspirational and shared by all – Quality first teaching is at the heart of raising achievement – Carefully targeted activities that promote good learning and readiness – Understanding of school information linked to robust tracking, monitoring and evaluation – Impact improves outcomes for disadvantaged pupils 25
2016 EYFS - % pupils achieving a Good Level of Development Disadvantaged Other Cohort % GLD Disadvantaged/Other Gap 2125 55% 14730 75% 20% Mid 498 53% 3879 75% 23% North East 590 52% 3163 72% 20% South 637 57% 4403 75% 18% West 400 58% 3285 75% 17% Basildon 357 57% 1970 74% 17% Brentwood 58 59% 784 77% 19% Castle Point 142 59% 821 74% 15% Rochford 80 53% 828 77% 25% District/Area Essex 26
2016 Key Stage 1 - % pupils achieving at least the expected standard District/ Area Cohort Reading Writing Maths Disad Other Gap Mid North East South West 3312 744 942 1034 592 13161 3504 2745 3956 2956 63% 59% 64% 64% 80% 79% 81% 80% 17% 21% 14% 18% 16% 51% 47% 52% 54% 51% 72% 70% 74% 72% 21% 25% 18% 19% 21% 60% 58% 61% 58% 78% 76% 79% 78% 18% 20% 15% 18% 20% Basildon Brentwood 605 91 1703 721 64% 66% 78% 86% 14% 20% 55% 48% 71% 79% 16% 31% 62% 58% 77% 83% 14% 25% Castle Point 213 721 60% 82% 22% 52% 71% 20% 55% 77% 22% Rochford 125 811 67% 83% 16% 60% 77% 17% 69% 84% 15% 28
2016 Key Stage 2 - % pupils achieving at least the expected standard RWM Cohort District/Area Performance Disad. Other Gap Essex 3879 11347 38% 62% 24% Mid 910 3275 39% 63% 24% North East 1022 2240 38% 61% 23% South 1174 3517 37% 62% 24% West 773 2315 39% 60% 21% Basildon 640 1412 36% 61% 26% Brentwood 126 691 34% 66% 32% Castle Point 251 683 39% 59% 19% Rochford 157 731 43% 62% 18% 29
2016 Key Stage 1 -2 Progress - average scores Reading District/ Area Cohort Writing Average Score Cohort Maths Average Score Cohort Average Score Disad. Other Gap Disad. Other Gap Essex 3691 10889 -1. 33 0. 15 1. 48 3741 10915 -0. 27 0. 64 0. 91 3724 10923 -0. 85 0. 34 1. 18 Mid 873 3142 -0. 83 0. 40 1. 23 883 3166 -0. 47 0. 48 0. 95 876 3148 -0. 80 0. 38 1. 18 North East 971 2146 -1. 79 0. 51 2. 30 980 2142 0. 20 1. 32 1. 12 982 2155 -1. 23 0. 28 1. 51 South 1117 3394 -1. 58 -0. 21 1. 37 1136 3391 -0. 43 0. 71 1. 14 1128 3407 -0. 74 0. 34 1. 07 West 730 2207 -0. 94 -0. 01 0. 93 742 2216 -0. 44 0. 10 0. 53 738 2213 -0. 55 0. 33 0. 89 Basildon 602 1362 -1. 62 -0. 46 1. 16 617 1368 0. 10 1. 26 1. 16 608 1366 -0. 80 0. 14 0. 95 Brentwood 122 654 -2. 05 0. 13 2. 18 123 655 -1. 05 -0. 07 0. 98 123 658 -0. 46 0. 47 0. 93 Castle Point 242 666 -1. 64 -0. 71 0. 93 242 648 -1. 88 0. 19 2. 06 244 667 -0. 98 0. 14 1. 12 Rochford 712 -0. 96 1. 39 154 720 0. 24 0. 85 0. 61 153 716 -0. 31 0. 76 1. 07 30 151 0. 42