
Pricing and Product Strategy 2012 by Dr Jared
Pricing and Product Strategy © 2012 by Dr. Jared M. Hansen. Please do not copy or distribute without permission
Course Introduction Price – The “P” of the marketing mix that captures value of the good or service being offered to the market. Even commodities can be marketed effectively to gain highly profitable returns. . © 2012 by Dr. Jared M. Hansen. Please do not copy or distribute without permission
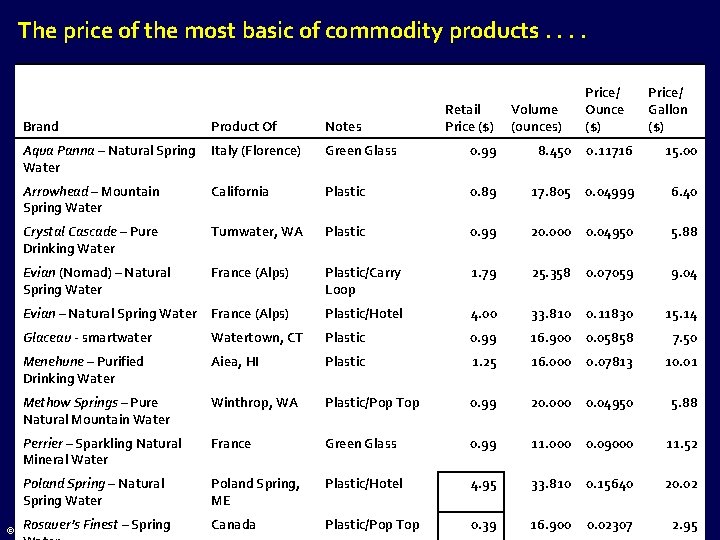
The price of the most basic of commodity products. . Retail Price ($) Volume (ounces) Price/ Ounce ($) Price/ Gallon ($) Brand Product Of Notes Aqua Panna – Natural Spring Water Italy (Florence) Green Glass 0. 99 8. 450 0. 11716 15. 00 Arrowhead – Mountain Spring Water California Plastic 0. 89 17. 805 0. 04999 6. 40 Crystal Cascade – Pure Drinking Water Tumwater, WA Plastic 0. 99 20. 000 0. 04950 5. 88 Evian (Nomad) – Natural Spring Water France (Alps) Plastic/Carry Loop 1. 79 25. 358 0. 07059 9. 04 Evian – Natural Spring Water France (Alps) Plastic/Hotel 4. 00 33. 810 0. 11830 15. 14 Glaceau - smartwater Watertown, CT Plastic 0. 99 16. 900 0. 05858 7. 50 Menehune – Purified Drinking Water Aiea, HI Plastic 1. 25 16. 000 0. 07813 10. 01 Methow Springs – Pure Natural Mountain Water Winthrop, WA Plastic/Pop Top 0. 99 20. 000 0. 04950 5. 88 Perrier – Sparkling Natural Mineral Water France Green Glass 0. 99 11. 000 0. 09000 11. 52 Poland Spring – Natural Spring Water Poland Spring, ME Plastic/Hotel 4. 95 33. 810 0. 15640 20. 02 0. 39 16. 900 0. 02307 2. 95 Rosauer’s Finest – Spring. Please do Canada Plastic/Pop Top © 2012 by Dr. Jared M. Hansen. not copy or distribute without permission
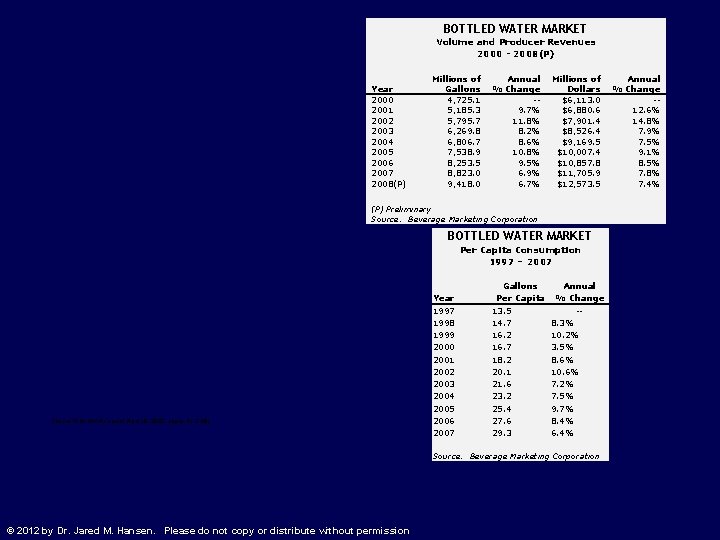
BOTTLED WATER MARKET Volume and Producer Revenues 2000 - 2008(P) Year 2000 2001 2002 2003 2004 2005 2006 2007 2008(P) Millions of Gallons 4, 725. 1 5, 185. 3 5, 795. 7 6, 269. 8 6, 806. 7 7, 538. 9 8, 253. 5 8, 823. 0 9, 418. 0 Annual % Change -9. 7% 11. 8% 8. 2% 8. 6% 10. 8% 9. 5% 6. 9% 6. 7% Millions of Dollars $6, 113. 0 $6, 880. 6 $7, 901. 4 $8, 526. 4 $9, 169. 5 $10, 007. 4 $10, 857. 8 $11, 705. 9 $12, 573. 5 (P) Preliminary Source: Beverage Marketing Corporation BOTTLED WATER MARKET Per Capita Consumption 1997 – 2007 Source: Wall Street Journal [April 18, 2002, pages A 1 & A 8] Year 1997 1998 1999 2000 2001 2002 2003 2004 2005 2006 2007 Gallons Per Capita 13. 5 14. 7 16. 2 16. 7 18. 2 20. 1 21. 6 23. 2 25. 4 27. 6 29. 3 Annual % Change -8. 3% 10. 2% 3. 5% 8. 6% 10. 6% 7. 2% 7. 5% 9. 7% 8. 4% 6. 4% Source: Beverage Marketing Corporation © 2012 by Dr. Jared M. Hansen. Please do not copy or distribute without permission Annual % Change -12. 6% 14. 8% 7. 9% 7. 5% 9. 1% 8. 5% 7. 8% 7. 4%
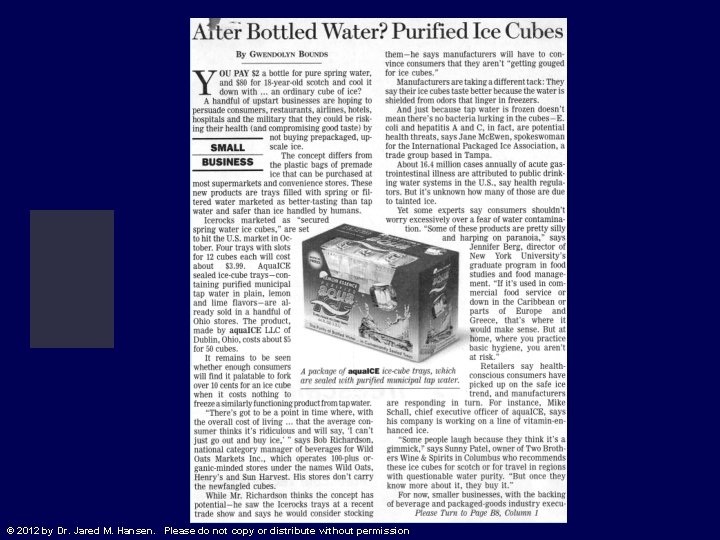
The relevant question is: Why are consumers willing to pay relatively steep prices for a commodity product? © 2012 by Dr. Jared M. Hansen. Please do not copy or distribute without permission
© 2012 by Dr. Jared M. Hansen. Please do not copy or distribute without permission
Chapter 1 – Strategic Pricing Marketing Mix • Product – creates value • Place – creates value • Promotion – creates and communicates value • Price – captures value created Price - often neglected by marketing professionals and corporate managers • An easy to change variable in the marketing mix • Seen as rather independent of other business functions • Too much emphasis on cost-based pricing • Too little emphasis on customer-driven pricing • Corporate focus on market share or other sales goal rather than profit © 2012 by Dr. Jared M. Hansen. Please do not copy or distribute without permission
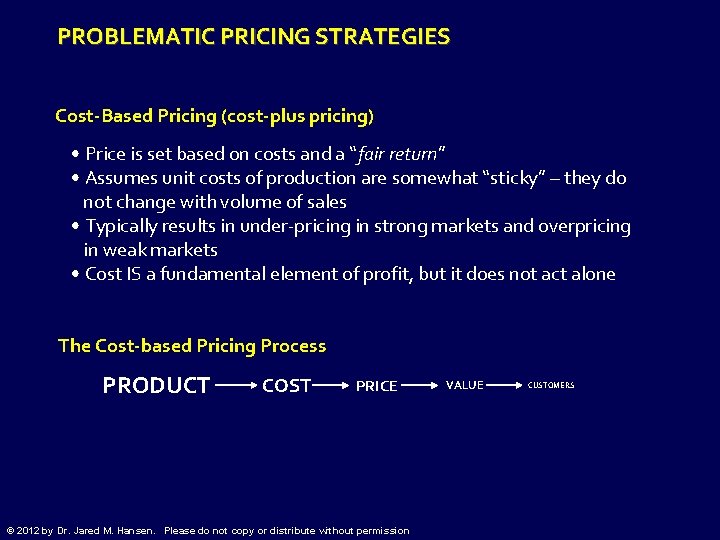
PROBLEMATIC PRICING STRATEGIES Cost-Based Pricing (cost-plus pricing) • Price is set based on costs and a “fair return” • Assumes unit costs of production are somewhat “sticky” – they do not change with volume of sales • Typically results in under-pricing in strong markets and overpricing in weak markets • Cost IS a fundamental element of profit, but it does not act alone The Cost-based Pricing Process PRODUCT COST PRICE © 2012 by Dr. Jared M. Hansen. Please do not copy or distribute without permission VALUE CUSTOMERS
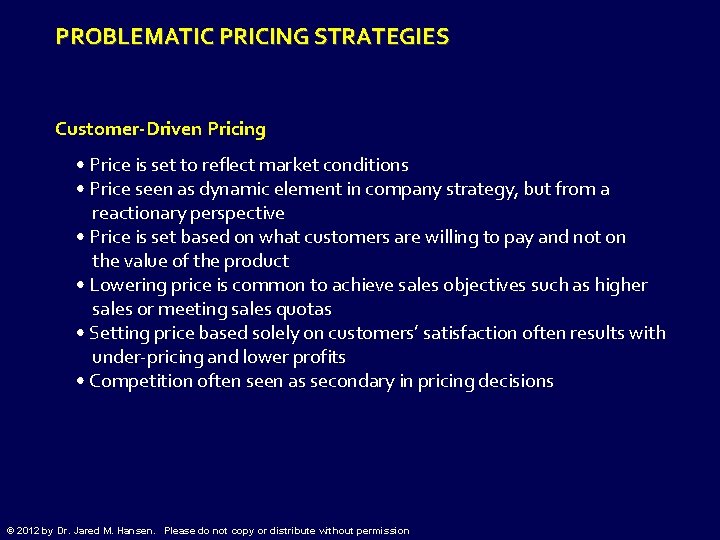
PROBLEMATIC PRICING STRATEGIES Customer-Driven Pricing • Price is set to reflect market conditions • Price seen as dynamic element in company strategy, but from a reactionary perspective • Price is set based on what customers are willing to pay and not on the value of the product • Lowering price is common to achieve sales objectives such as higher sales or meeting sales quotas • Setting price based solely on customers’ satisfaction often results with under-pricing and lower profits • Competition often seen as secondary in pricing decisions © 2012 by Dr. Jared M. Hansen. Please do not copy or distribute without permission
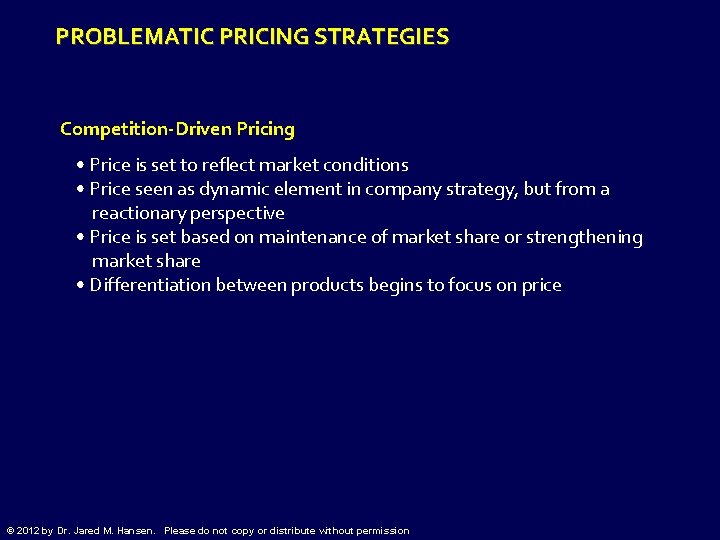
PROBLEMATIC PRICING STRATEGIES Competition-Driven Pricing • Price is set to reflect market conditions • Price seen as dynamic element in company strategy, but from a reactionary perspective • Price is set based on maintenance of market share or strengthening market share • Differentiation between products begins to focus on price © 2012 by Dr. Jared M. Hansen. Please do not copy or distribute without permission
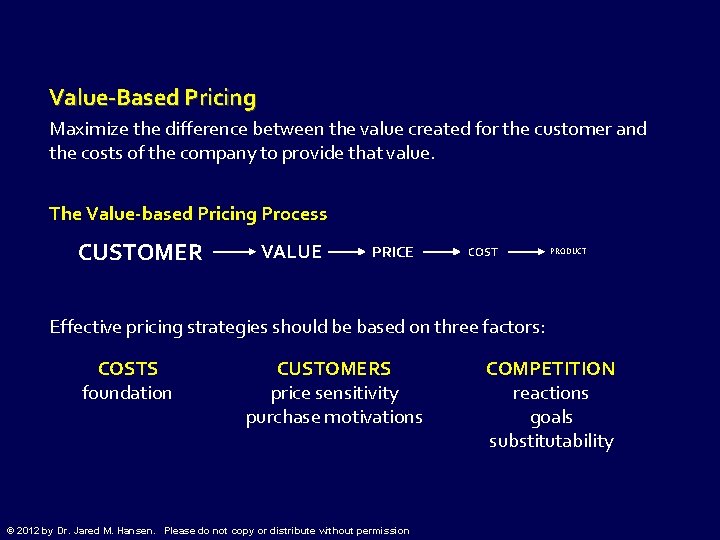
Value-Based Pricing Maximize the difference between the value created for the customer and the costs of the company to provide that value. The Value-based Pricing Process CUSTOMER VALUE PRICE COST PRODUCT Effective pricing strategies should be based on three factors: COSTS foundation CUSTOMERS price sensitivity purchase motivations © 2012 by Dr. Jared M. Hansen. Please do not copy or distribute without permission COMPETITION reactions goals substitutability
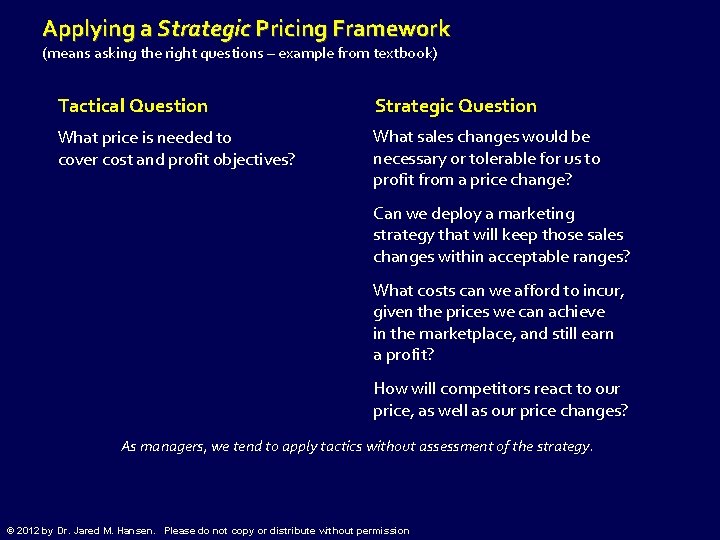
Applying a Strategic Pricing Framework (means asking the right questions – example from textbook) Tactical Question Strategic Question What price is needed to cover cost and profit objectives? What sales changes would be necessary or tolerable for us to profit from a price change? Can we deploy a marketing strategy that will keep those sales changes within acceptable ranges? What costs can we afford to incur, given the prices we can achieve in the marketplace, and still earn a profit? How will competitors react to our price, as well as our price changes? As managers, we tend to apply tactics without assessment of the strategy. © 2012 by Dr. Jared M. Hansen. Please do not copy or distribute without permission
Chapter 2 – Strategic Pricing Key Point: Pricing strategy involves the management of customer behavior(s) and purchase motivations, not the adaptation to customer behavior(s) and motivations. Margin erosion is not always caused by price issues. Price is only one attribute affecting the customer’s choice decision. Other attributes dealing with distribution/delivery, product function, promotion, as well as information availability and knowledge dissemination, can cause margin erosion. © 2012 by Dr. Jared M. Hansen. Please do not copy or distribute without permission
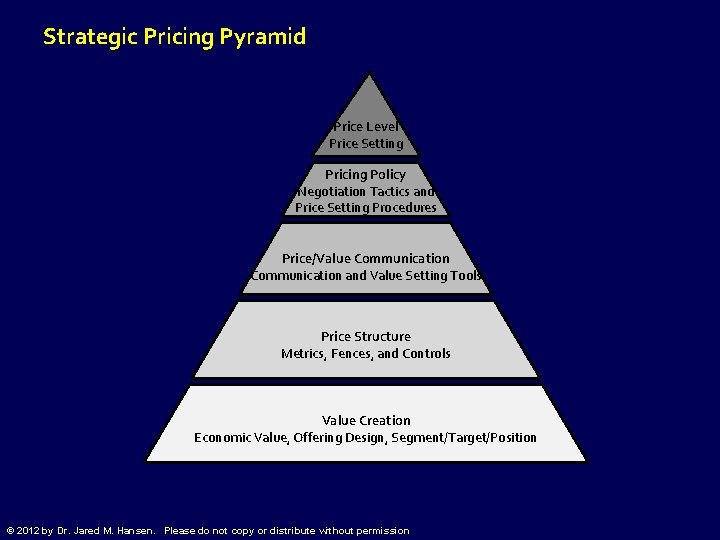
Strategic Pricing Pyramid Price Level Price Setting Pricing Policy Negotiation Tactics and Price Setting Procedures Price/Value Communication and Value Setting Tools Price Structure Metrics, Fences, and Controls Value Creation Economic Value, Offering Design, Segment/Target/Position © 2012 by Dr. Jared M. Hansen. Please do not copy or distribute without permission
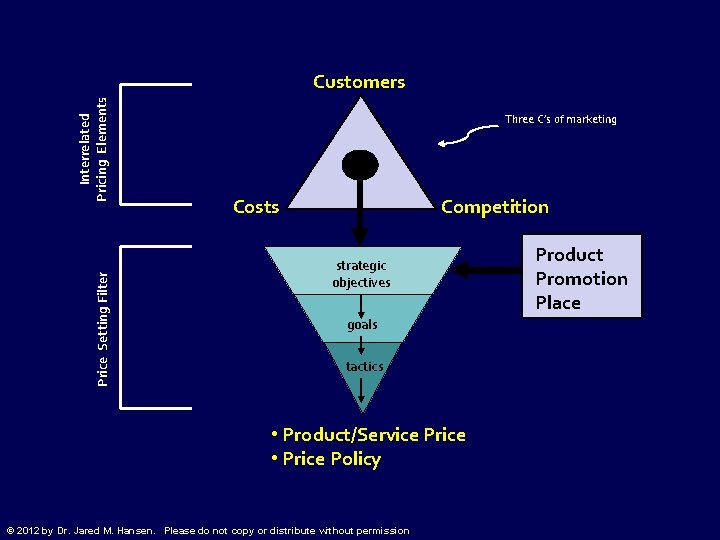
Price Setting Filter Interrelated Pricing Elements Customers Three C’s of marketing Costs Competition strategic objectives goals tactics • Product/Service Price • Price Policy © 2012 by Dr. Jared M. Hansen. Please do not copy or distribute without permission Product Promotion Place
Institutionalizing Pricing Strategy Institutionalizing or embedding a pricing strategy does not focus only on the firm. It must also focus on competitors and customers. Approaches to Institutionalizing a Pricing Strategy: • Incentives – carrots and sticks • Rationale Expectations • Knowledge, Information, and Skills (enabling tools) © 2012 by Dr. Jared M. Hansen. Please do not copy or distribute without permission
Ways of Thinking about Competition • Porters 5 Forces • The Big Middle • (R-A Theory) Dynamic Competition vs. Neoclassical © 2012 by Dr. Jared M. Hansen. Please do not copy or distribute without permission
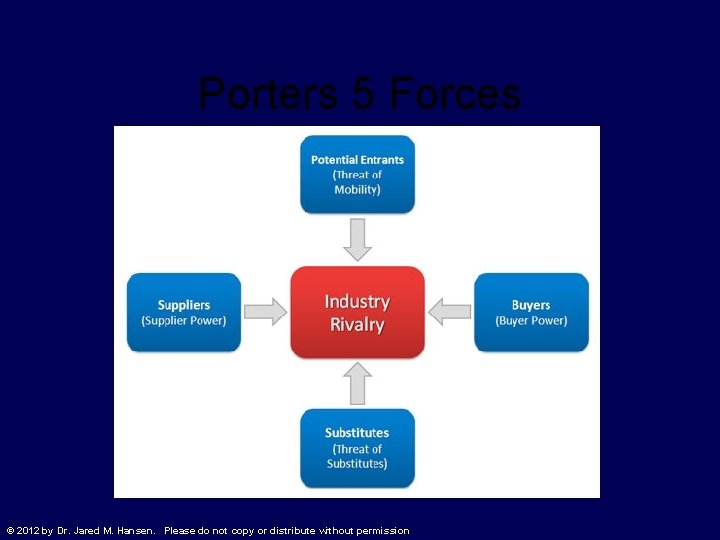
Porters 5 Forces © 2012 by Dr. Jared M. Hansen. Please do not copy or distribute without permission
Big Middle The structure of retailing is such that retailers typically exist in one of four segments: Innovative, Big Middle, Low Price, and In Trouble. • • © 2012 by Dr. Jared M. Hansen. Please do not copy or distribute without permission Innovative segment direct their strategies toward qualityconscious markets who seek premium offerings. Low-price retailers appeal to price-conscious markets, Big Middle retailers thrive because of their value offerings In trouble retailers are unable to deliver high levels of value relative to their competitors.
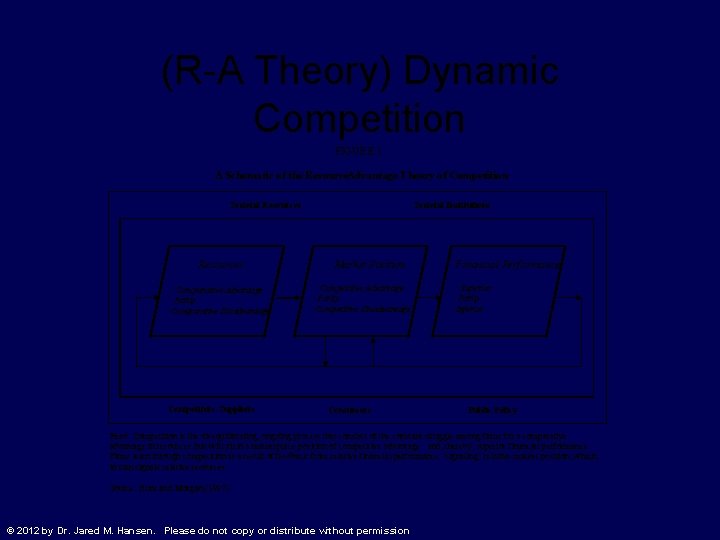
(R-A Theory) Dynamic Competition FIGURE 1 A Schematic of the Resource -Advantage Theory of Competition Societal Resources • Comparative Advantage • Parity • Comparative Disadvantage Competitors-Suppliers Societal Institutions Market Position • Competitive Advantage • Parity • Competitive Disadvantage Consumers Financial Performance • Superior • Parity • Inferior Public Policy Read: Competition is the disequilibrating, ongoing process that consists of the constant struggle among firms for a comparative advantage in resources that will yield a marketplace position of competitive advantage. and, thereby, superior financial performance Firms learn through competition as a result of feedback from relative financial performance “signaling” relative market position, which, in turn signals relative resources. Source: Hunt and Morgan (1997) © 2012 by Dr. Jared M. Hansen. Please do not copy or distribute without permission
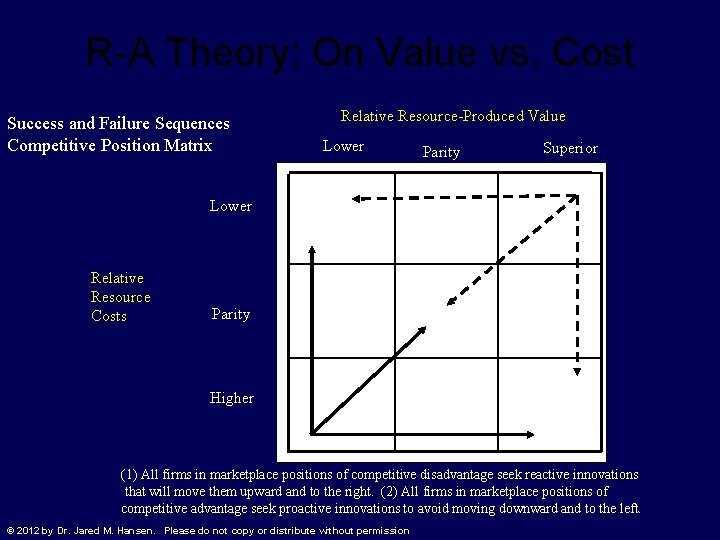
R-A Theory: On Value vs. Cost Success and Failure Sequences Competitive Position Matrix Relative Resource-Produced Value Lower Parity Superior Lower Relative Resource Costs Parity Higher (1) All firms in marketplace positions of competitive disadvantage seek reactive innovations that will move them upward and to the right. (2) All firms in marketplace positions of competitive advantage seek proactive innovations to avoid moving downward and to the left. © 2012 by Dr. Jared M. Hansen. Please do not copy or distribute without permission
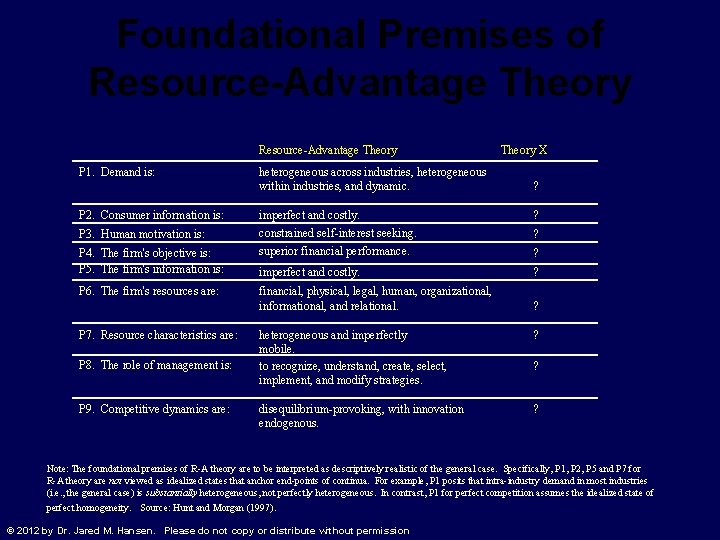
Foundational Premises of Resource-Advantage Theory P 1. Demand is: P 2. Consumer information is: P 3. Human motivation is: P 4. The firm's objective is: P 5. The firm's information is: P 6. The firm's resources are: P 7. Resource characteristics are: P 8. The role of management is: P 9. Competitive dynamics are: heterogeneous across industries, heterogeneous within industries, and dynamic. Theory X ? imperfect and costly. constrained self-interest seeking. superior financial performance. ? imperfect and costly. ? financial, physical, legal, human, organizational, informational, and relational. ? ? ? heterogeneous and imperfectly mobile. to recognize, understand, create, select, implement, and modify strategies. ? disequilibrium-provoking, with innovation endogenous. ? ? Note: The foundational premises of R-A theory are to be interpreted as descriptively realistic of the general case. Specifically, P 1, P 2, P 5 and P 7 for R-A theory are not viewed as idealized states that anchor end-points of continua. For example, P 1 posits that intra-industry demand in most industries (i. e. , the general case) is substantially heterogeneous, not perfectly heterogeneous. In contrast, P 1 for perfect competition assumes the idealized state of perfect homogeneity. Source: Hunt and Morgan (1997). © 2012 by Dr. Jared M. Hansen. Please do not copy or distribute without permission
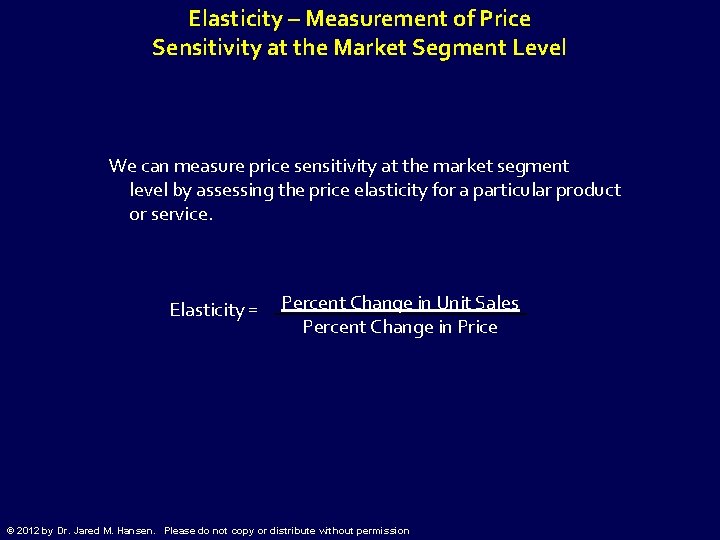
Elasticity – Measurement of Price Sensitivity at the Market Segment Level We can measure price sensitivity at the market segment level by assessing the price elasticity for a particular product or service. Elasticity = Percent Change in Unit Sales Percent Change in Price © 2012 by Dr. Jared M. Hansen. Please do not copy or distribute without permission
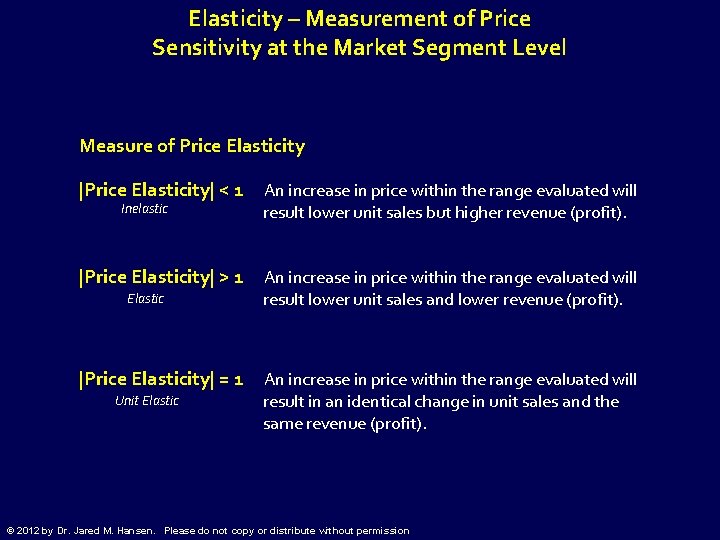
Elasticity – Measurement of Price Sensitivity at the Market Segment Level Measure of Price Elasticity |Price Elasticity| < 1 An increase in price within the range evaluated will result lower unit sales but higher revenue (profit). |Price Elasticity| > 1 An increase in price within the range evaluated will result lower unit sales and lower revenue (profit). Inelastic Elastic |Price Elasticity| = 1 Unit Elastic An increase in price within the range evaluated will result in an identical change in unit sales and the same revenue (profit). © 2012 by Dr. Jared M. Hansen. Please do not copy or distribute without permission
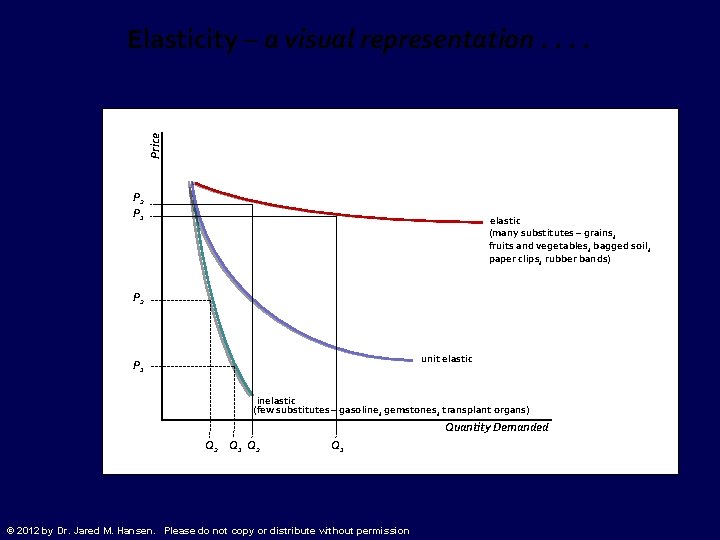
Price Elasticity – a visual representation. . P 2 P 1 elastic (many substitutes – grains, fruits and vegetables, bagged soil, paper clips, rubber bands) P 2 unit elastic P 1 inelastic (few substitutes – gasoline, gemstones, transplant organs) Quantity Demanded Q 2 Q 1 © 2012 by Dr. Jared M. Hansen. Please do not copy or distribute without permission
Elasticity – Measurement of Price Sensitivity at the Market Segment Level Properties of Price Elasticity • Elasticity is usually negative since positive price changes usually result in unit sales declines and negative price changes usually produce a unit sales increase. • Elasticity is relevant only over a short range of data since it is dependent on the shape of the market demand curve. • The elasticity for a product early in its life cycle can be significantly different than its elasticity later in its life cycle. • It is difficult to make any generalizations about price elasticity since it is so dependent of the product or service and the specific shape of the product or service’s demand curve. © 2012 by Dr. Jared M. Hansen. Please do not copy or distribute without permission
- Slides: 26