Pribilof Island red king crab Cody Szuwalski Crab

Pribilof Island red king crab Cody Szuwalski Crab Plan Team meeting April 30, 2019

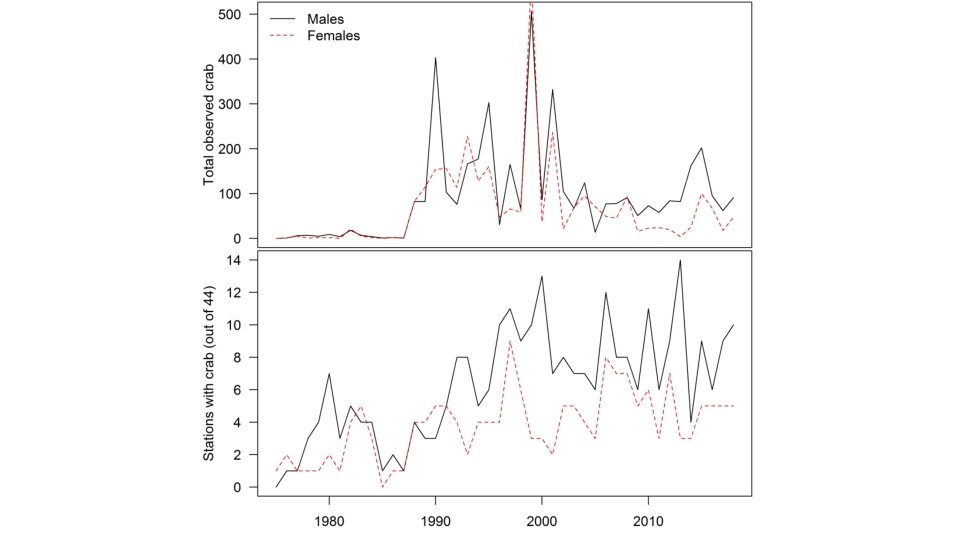
Overview • Biennial cycle • No directed fishery since 1998 • Low mature male biomass in 2018 • Potentially a new year class in 2018 • Running average, random effects model, integrated model


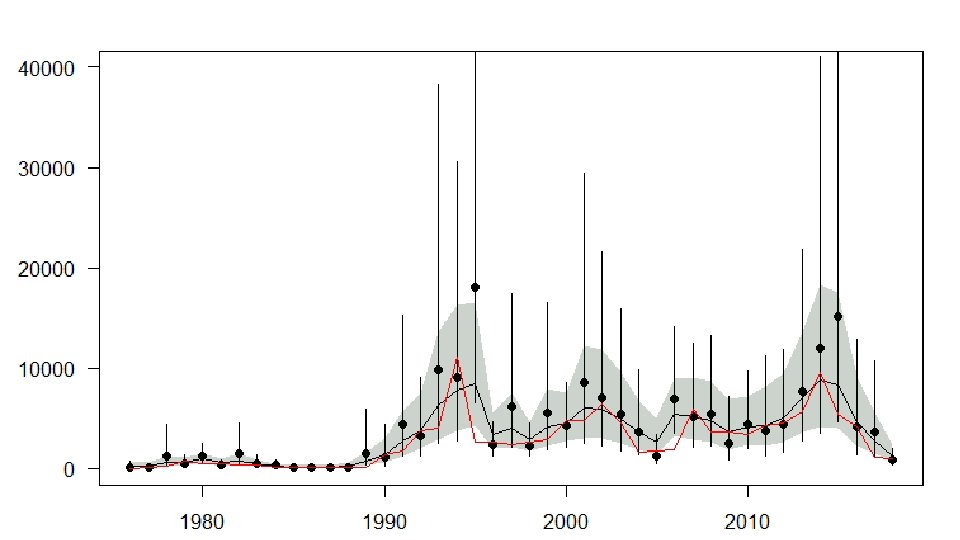
Running average

Random effects model • Previously there were several iterations of the model done that placed priors on the estimated process error because of convergence issues. • Error in the input • Applied original methods, model converged
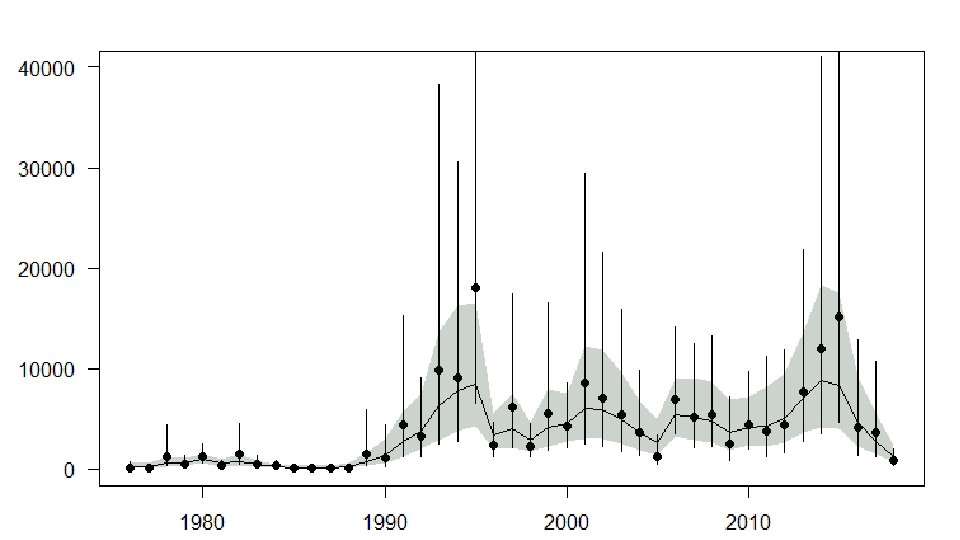

BMSY = average of MMB from 1991 -present


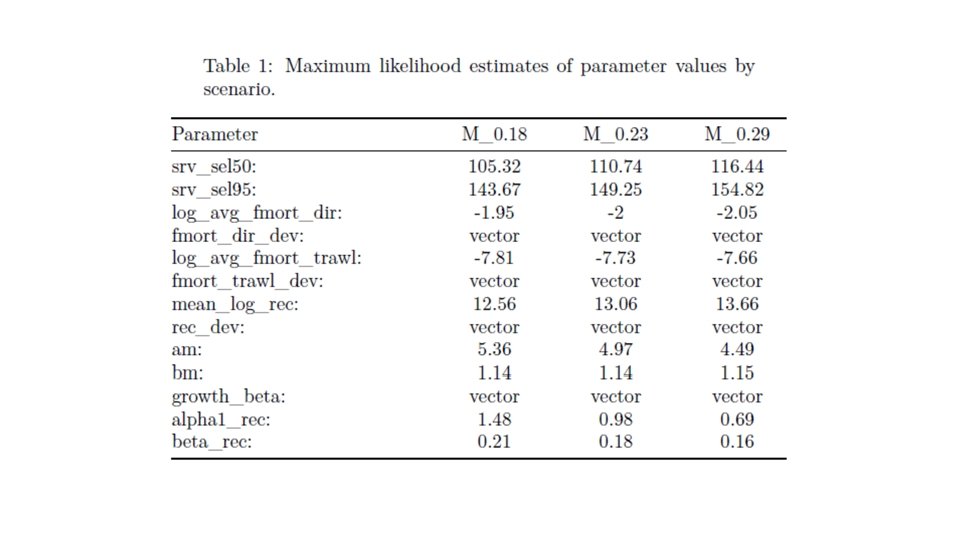
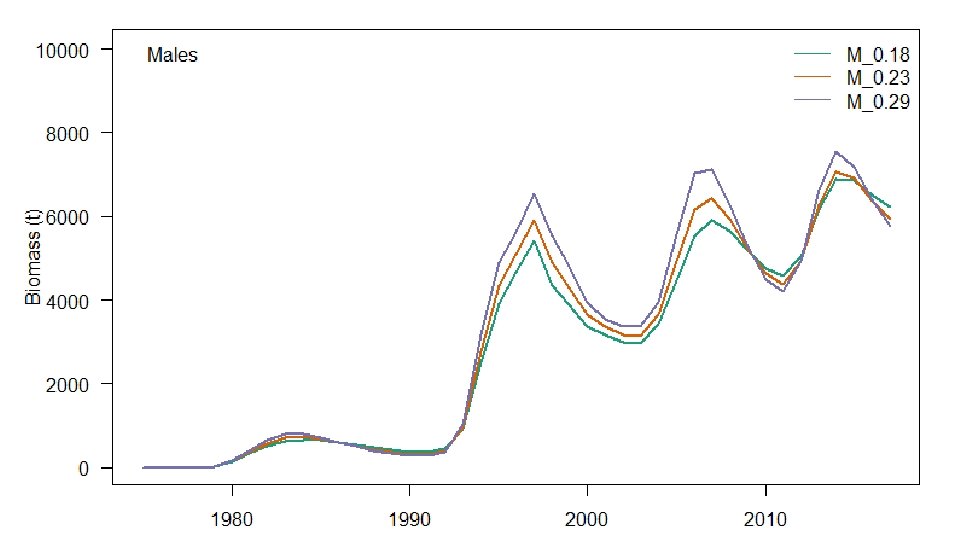
Integrated assessment • Similar in structure to the snow crab assessment • 5 mm length bins (37. 5 -207. 5) • Males only • Survey catchability at 1 • M at 0. 18

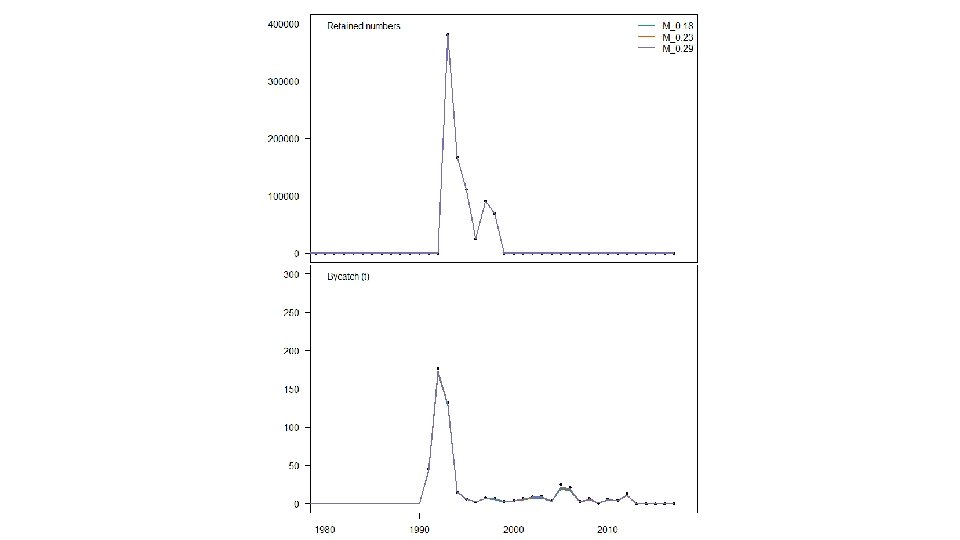
Included in assessment: Source Years Survey index of abundance 1975 -2018 Survey length frequencies 1975 -2018 Catch in directed fishery 1993 -1998 Bycatch in groundfish trawl fishery 1991 -2017 Excluded from assessment: Source Years Bycatch in crab pot fisheries 1998 -2017 Bycatch in fixed gear groundfishery 1991 -2017

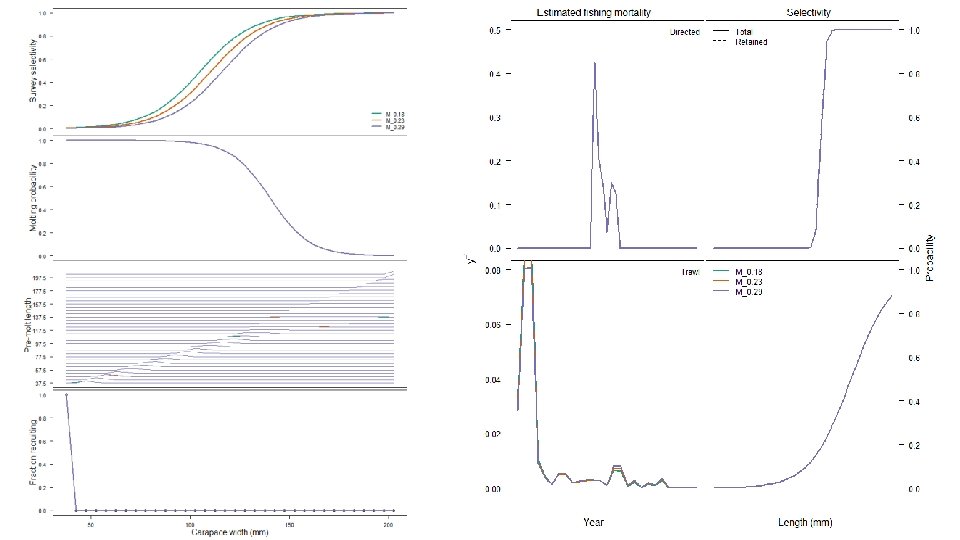
Fixed Survey 3/12 M Directed fishery Trawl bycatch 5/12 M Molting Growth Mating Recruitment 4/12 M q=1 M = 0. 18 Fishery selectivity = 138 mm

Survey 3/12 M Directed fishery Trawl bycatch 5/12 M Molting Growth Mating Recruitment 4/12 M Directed fishery selectivity (assumed)

Survey 3/12 M Directed fishery Trawl bycatch 5/12 M Molting Growth Mating Recruitment 4/12 M Non-pelagic trawl selectivity (fixed to BBRKC estimates)
![Survey 3/12 M Molting probability (males) [fixed] Directed fishery Trawl bycatch 5/12 M Molting](http://slidetodoc.com/presentation_image_h2/1757925ff35733f99b2f5d350d9b4303/image-16.jpg "Survey 3/12 M Molting probability (males) [fixed] Directed fishery Trawl bycatch 5/12 M Molting")
Survey 3/12 M Molting probability (males) [fixed] Directed fishery Trawl bycatch 5/12 M Molting Growth Mating Recruitment 4/12 M Powell, G. C. 1967. Growth of king crabs in the vicinity of Kodiak Island, Alaska. Informational Leaflet 92, Alaska Department of Fish and Game, 58 p.
 3/12 M Directed fishery Trawl bycatch 5/12 M Molting Growth")
Survey Male growth (estimated) 3/12 M Directed fishery Trawl bycatch 5/12 M Molting Growth Mating Recruitment 4/12 M reference

Survey 3/12 M Directed fishery Trawl bycatch 5/12 M Molting Growth Mating Recruitment 4/12 M reference Maturity (fixed)

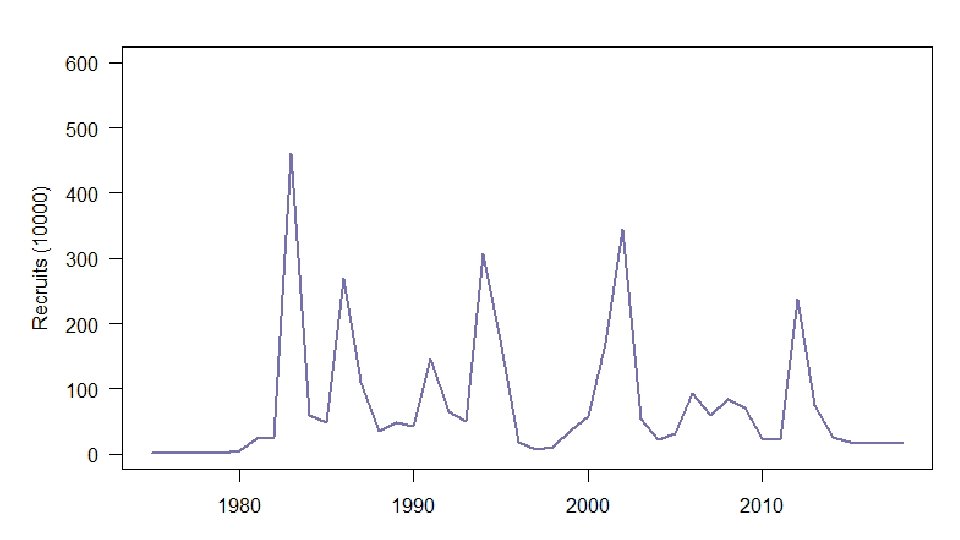
Survey 3/12 M Directed fishery Trawl bycatch 5/12 M Molting Growth Mating Recruitment 4/12 M Fraction recruiting (estimated)
 •")
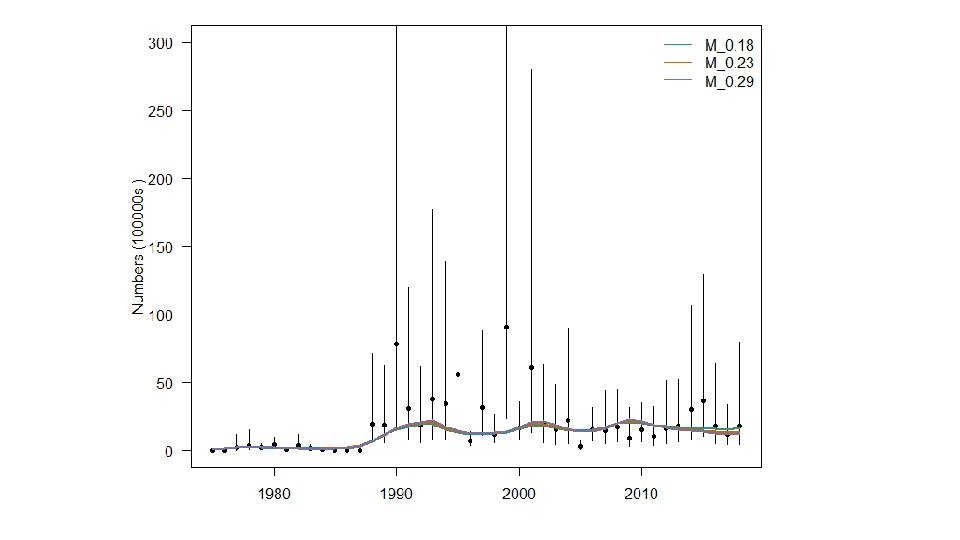
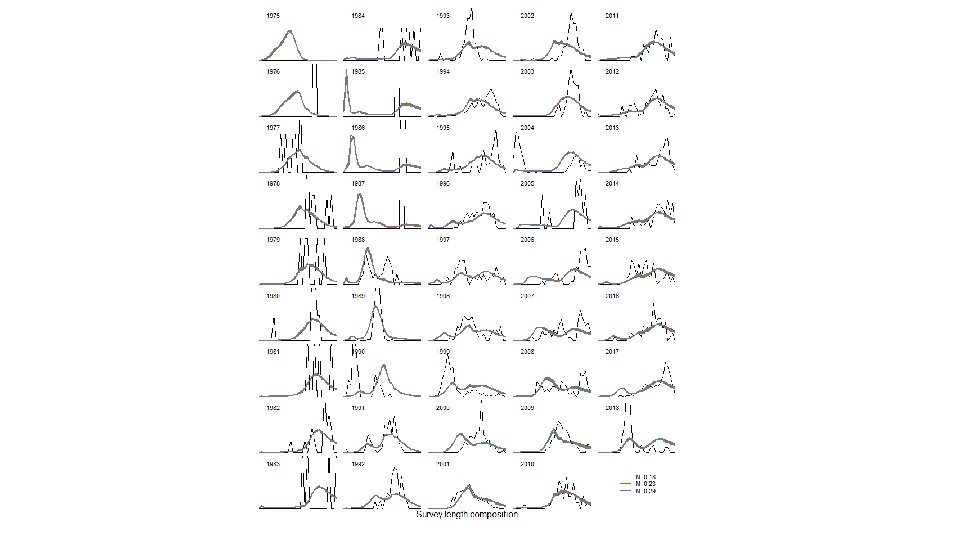
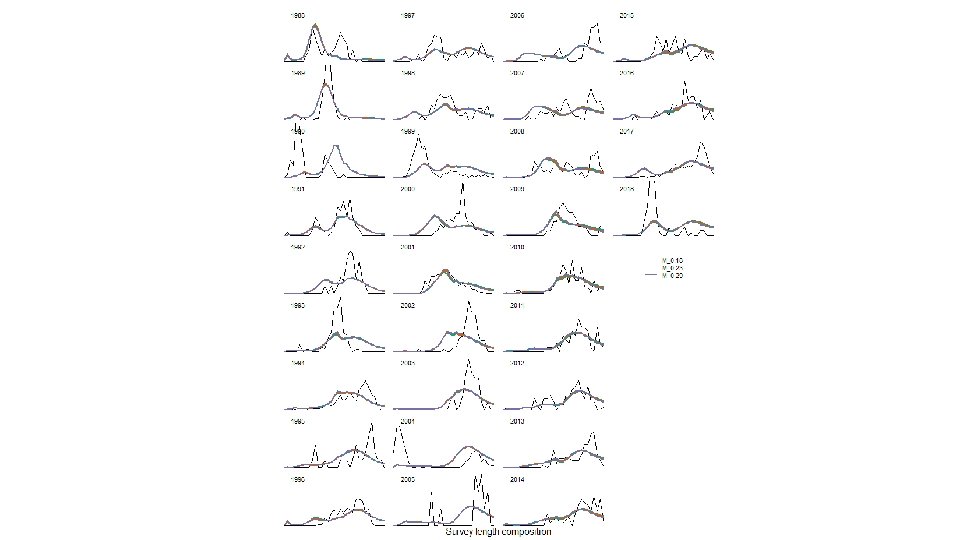
Why aren’t the survey data fit well? • 4 big cohorts (length composition) • Constant, relatively low natural mortality • Nothing to do with the early period (1970 s-1980 s) • Must make the cohorts ‘fit together’
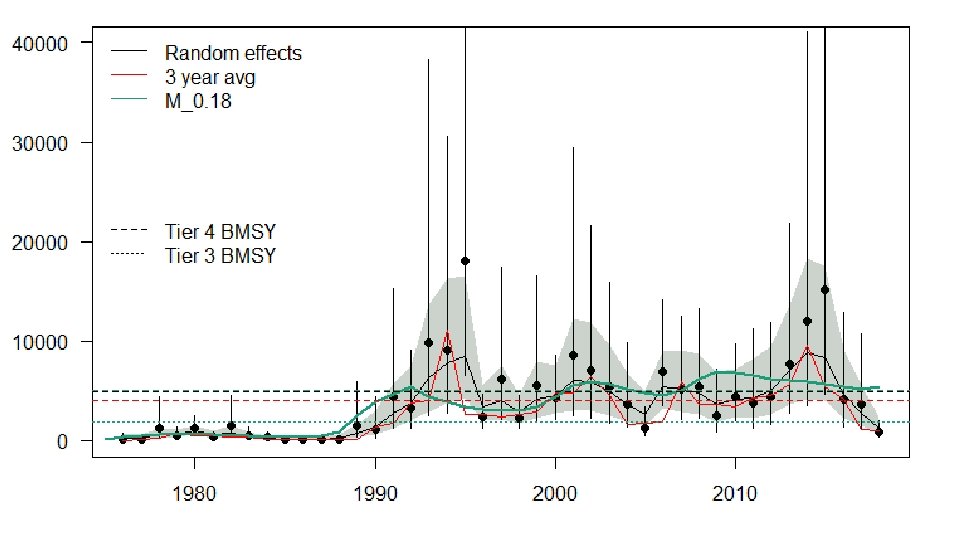

Integrated assessment • Signal in length composition data is stronger than survey numbers • Data overdispersed, CVs are poisson derived, should be larger than this • Length comp gives the ‘dynamics’, survey gives the scale Random effects • Simple, few assumptions • Fits the survey biomass data better

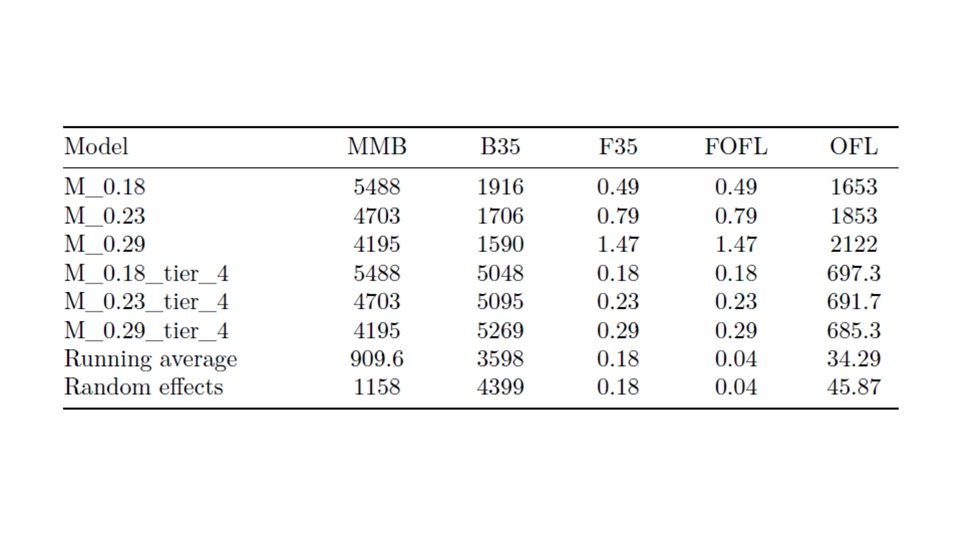
Tier 3 vs. Tier 4 • BMSY for Tier 4 are more of an ‘unfished’ biomass for PIRKC • Assuming FMSY = M ignores information about selectivity (which protects some of the mature population) • Tier 3 rules require that assumptions are made about population processes
- Slides: 32