Preview Descriptive Statistics In this chapter well learn


, the follow one")


- Slides: 33
Preview Descriptive Statistics In this chapter we’ll learn to summarize or describe the important characteristics of a known set of data Inferential Statistics In later chapters we’ll learn to use sample data to make inferences or generalizations about a population
Section 3. 2 Measures of Center
Learning Objectives Characteristics of center. Measures of center, including mean and median, as tools for analyzing data. Not only determine the value of each measure of center, but also interpret those values.
Part 1 Basics of Measures of Center Measure of Center: the value at the center or middle of a data set. Arithmetic Mean (Mean): the measure of center obtained by adding the values and dividing the total by the number of values (What most people call an average. )
Notation denotes the sum of a set of values. x is the variable usually used to represent the individual data values. n represents the number of data values in a sample. N represents the number of data values in a population.
Notation • Mean: The measure of center found by adding the data values and dividing by the total number of data values. is pronounced ‘x-bar’ and denotes the mean of a set of sample values Sum of all sample data values Number of data values The mean of a set of sample values µ is pronounced ‘mu’ and denotes the mean of all values in a population The mean of all values in a population CAUTION: Is NOT a resistant measure of center.
Mean Advantages - Is relatively reliable - means of samples drawn from the same population don’t vary as much as other measures of center - Takes every data value into account Disadvantage Is sensitive to every data value, one extreme value can affect it dramatically; is not a resistant measure of center
Median: the middle value when the original data values are arranged in order of increasing (or decreasing) magnitude § Often denoted by ~x (pronounced “x-tilde”) § Is not affected by an extreme value (is a resistant measure of center)
Finding the Median First sort the values (arrange them in order), the follow one of these: • If the number of data values is odd, the median is the number located in the exact middle of the list. • If the number of data values is even, the median is found by computing the mean of the two middle numbers.
5. 40 1. 10 0. 42 0. 73 0. 48 1. 10 → not in ascending order 0. 42 0. 48 0. 73 1. 10 5. 40 → in ascending order (in order - even number of values – no exact middle shared by two numbers) 0. 73 + 1. 10 MEDIAN is 0. 915 2 5. 40 1. 10 0. 42 0. 73 0. 48 1. 10 0. 66 → not in ascending order 0. 42 0. 48 0. 66 0. 73 1. 10 5. 40 → in ascending order (in order - odd number of values) exact middle MEDIAN is 0. 73
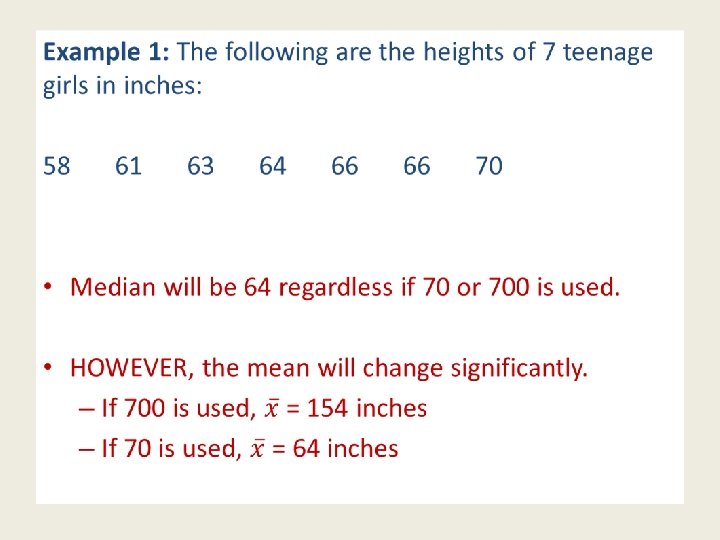
Example 1: The following are the heights of 7 teenage girls in inches: 58 61 63 64 66 66 700 Oops! That last student was supposed to be 70 inches. Without calculating, which measure of center (mean or median) will change?
Mode: the value that occurs with the greatest frequency Data set can have one, more than one (2 or more), or no mode (none) Bimodal Multimodal No Mode two data values occur with the same greatest frequency more than two data values occur with the same greatest frequency no data value is repeated Mode is the only measure of central tendency that can be used with nominal data
Find the mode of the following data sets: a. 5. 40 1. 10 0. 42 0. 73 0. 48 1. 10 b. 27 27 27 55 55 55 88 88 99 c. 1 2 3 6 7 8 9 10 ï Mode is 1. 10 ï Bimodal - 27 & 55 ï No Mode
Midrange: the value midway between the maximum and minimum values in the original data set
Midrange Sensitive to extremes because it uses only the maximum and minimum values, so rarely used but…. . - Very easy to compute - Reinforces that there are several ways to define the center - Avoids confusion with the median
Midrange Sensitive to extremes because it uses only the maximum and minimum values… What would happen to our Midrange value if we accidentally used 700 again instead of 70? So is this measure of center considered resistant?
Round-off Rule for Measures of Center - Carry one more decimal place than is present in the original set of values.
Part 2 Beyond the Basics of Measures of Center
Mean from a Frequency Distribution *Assume that all sample values in each class are equal to the class midpoint. *Use class midpoint of classes for variable x. *Use frequencies of classes for variable f
Example 4: Find the mean of the data summarized in the given frequency distribution. Tar (mg) in Nonfiltered Cigarettes Frequency (f) 10 – 13 1 14 – 17 0 18 – 21 15 22 – 25 7 26 – 29 2 Σf = Class Midpoints (x) Σ(f·x) f·x
Weighted Mean When data values are assigned different weights, we can compute a weighted mean. (w • x) x = w Multiply each weight (w) by the corresponding value (x), then add the products. Divide that total by the sum of the weights
Example 5: A student of the author earned grades of B, C, B, A, and D. Those courses had these corresponding numbers of credit hours: 3, 3, 4, 4, and 1. The grading system assigns quality points to letter grades as follows: A = 4, B = 3, C = 2, D = 1, F = 0. Compute the grade point average (GPA) and round the result with two decimal places. If the Dean’s list requires a GPA of 3. 00 or greater, did this student make the Dean’s list? x w x*w B=3 3 9 C=2 3 6 B=3 4 12 A=4 4 16 D=1 1 1 w = 15 x*w = 44
Best Measure of Center
Symmetric and Skewed Symmetric: distribution of data is symmetric if the left half of its histogram is roughly a mirror image of its right half Skewed: distribution of data is skewed if it is not symmetric and extends more to one side than the other
Skewed Left or Right Skewed to the left: - also called negatively skewed - have a longer left tail - mean and median are to the left of the mode Skewed to the right: - also called positively skewed - have a longer right tail - mean and median are to the right of the mode
Skewness
Shape of the Distribution The mean and median cannot always be used to identify the shape of the distribution.
Recap In this section we have discussed: v Types of measures of center Mean Median Mode v Mean from a frequency distribution v Weighted means v Best measures of center v Skewness
Project • You will receive a course catalog with many freshman level classes, their meeting times, and the number of credit hours. • You will use this catalog to create a schedule you would be comfortable with for your freshman year of college. • Once you’ve created this schedule, you will come to me, and I will use a random number generator to assign you mock grades for each class • You will then need to calculate your GPA