
Prevention of new infections by reducing Viral transmission
Prevention of new infections by reducing Viral transmission –VL monitoring in ART cohorts 19/11/15 AWACC Towards the 90/90/90 goals of the National programme for HIV/TB services DOH-CAPRISA –UKZN- NHLS PROJECT Dr. Henry Sunpath Ethekwini District DOH
Antiretroviral Therapy Program • To date (June 2014), a total of 949 339 patients are receiving Antiretroviral Therapy (ART) from 618 facilities in the province- (now I mi. I on ART) • Of the 618 facilities, 545 are Primary Health Care (PHC) facilities and services are mainly Nurse driven • Since 2010, close to 3 000 Nurses that have been trained on Nurse Initiated and Managed Antiretroviral Therapy (NIMART) • Since the roll out of Fixed Dose Combination Drugs (FDCs), 408 495 patients initiated or switched • FDC: a single pill containing three drugs replacing three single ARV medicines • FDCs aim to reduce the pill burden and improve adherence for ART patients including TB/HIV co-infected patients 2
TB & HIV Burden • HIV burden • • People living with HIV = 6, 4 million Prevalence [15 – 49 yrs] = 19. 1% Incidence [15 – 49 yrs] = 1. 36% AIDS related Deaths = 200, 000 • TB burden • • People infected with TB = 360, 000 Incidence = 860/100, 000 population Prevalence = 715/100, 000 population Statistician General reported that, TB is the Number ONE leading cause of death among South Africans (8. 8%) 3
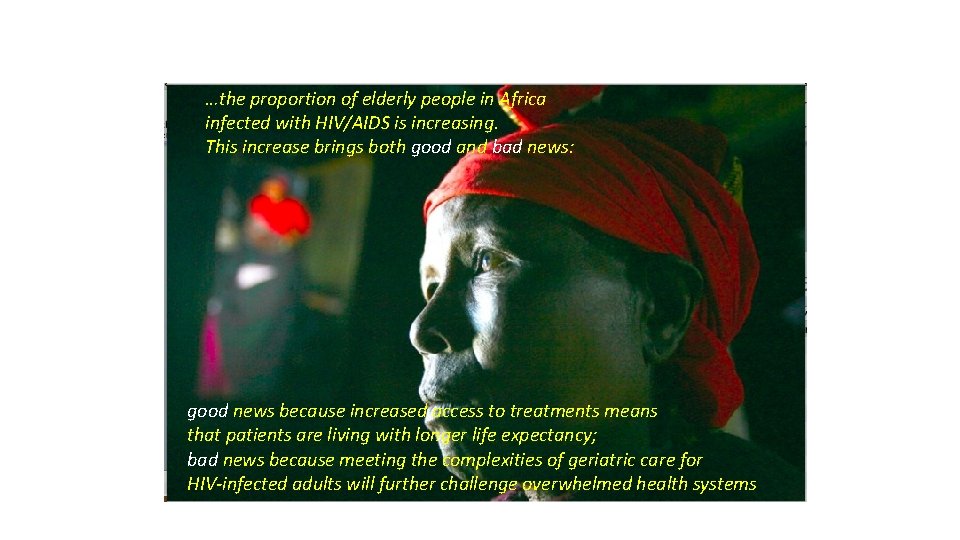
Ageing faster with AIDS in Resourceconstrained settings …the proportion of elderly people in Africa infected with HIV/AIDS is increasing. This increase brings both good and bad news: good news because increased access to treatments means that patients are living with longer life expectancy; bad news because meeting the complexities of geriatric care for HIV-infected adults will further challenge overwhelmed health systems Edward J Mills, Anu Rammohan, Niyi Awofeso; Lancet 2010
How many HIV tests were done in KZN over one year • 1. 2. 5 MILLION • 2. 1. 8 MILLION • 3. 4. 5 MILLION • 4. 1. 2 MILLION
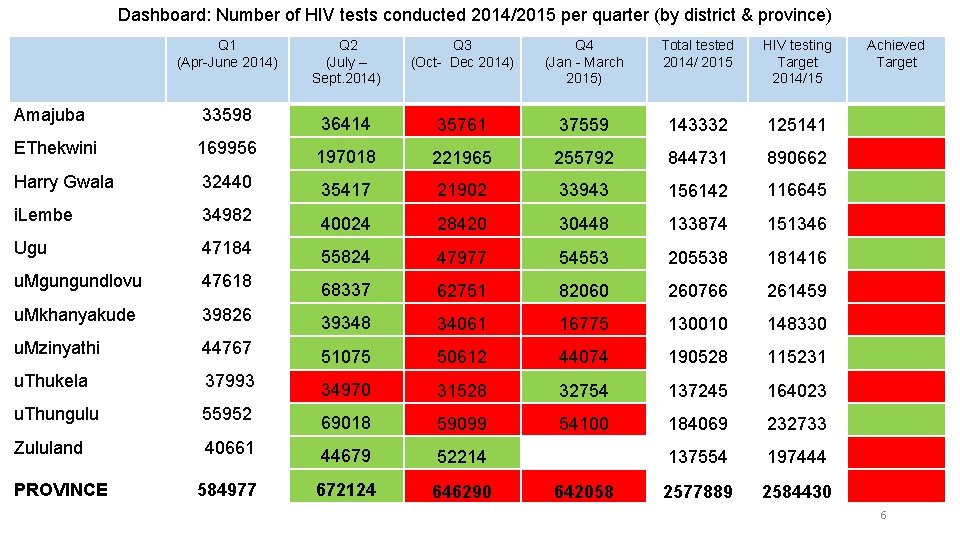
Dashboard: Number of HIV tests conducted 2014/2015 per quarter (by district & province) Q 1 (Apr-June 2014) Q 2 (July – Sept. 2014) Q 3 (Oct- Dec 2014) Q 4 (Jan - March 2015) Total tested 2014/ 2015 HIV testing Target 2014/15 Amajuba 33598 36414 35761 37559 143332 125141 EThekwini 169956 197018 221965 255792 844731 890662 Harry Gwala 32440 35417 21902 33943 156142 116645 i. Lembe 34982 40024 28420 30448 133874 151346 Ugu 47184 55824 47977 54553 205538 181416 u. Mgungundlovu 47618 68337 62751 82060 260766 261459 u. Mkhanyakude 39826 39348 34061 16775 130010 148330 u. Mzinyathi 44767 51075 50612 44074 190528 115231 u. Thukela 37993 34970 31528 32754 137245 164023 u. Thungulu 55952 69018 59099 54100 184069 232733 Zululand 40661 44679 52214 137554 197444 PROVINCE 584977 672124 646290 2577889 2584430 642058 Achieved Target 6
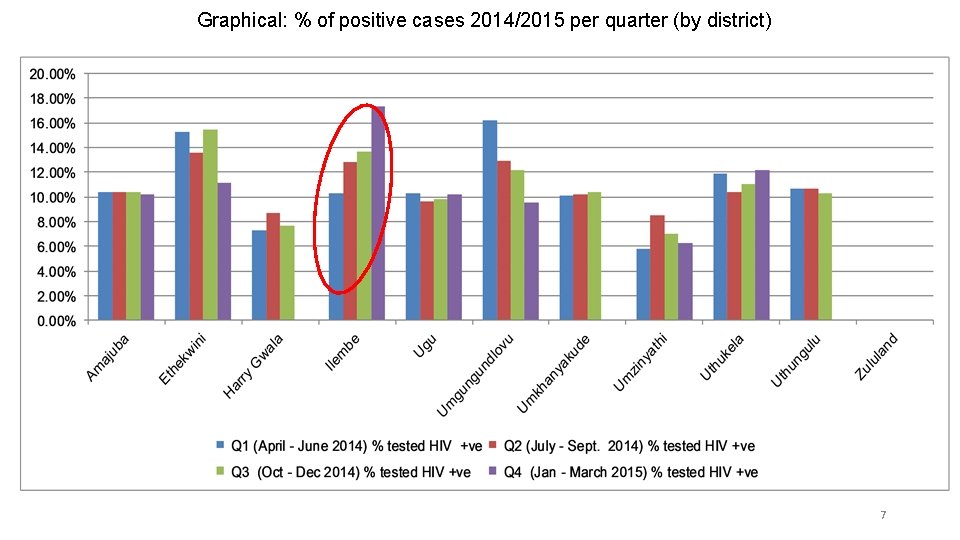
Graphical: % of positive cases 2014/2015 per quarter (by district) 7
How many patients on average are started on ART per quarter in KZN • 1. 7500 • 2. 25 000 • 3. 15 000 • 4. 10 000
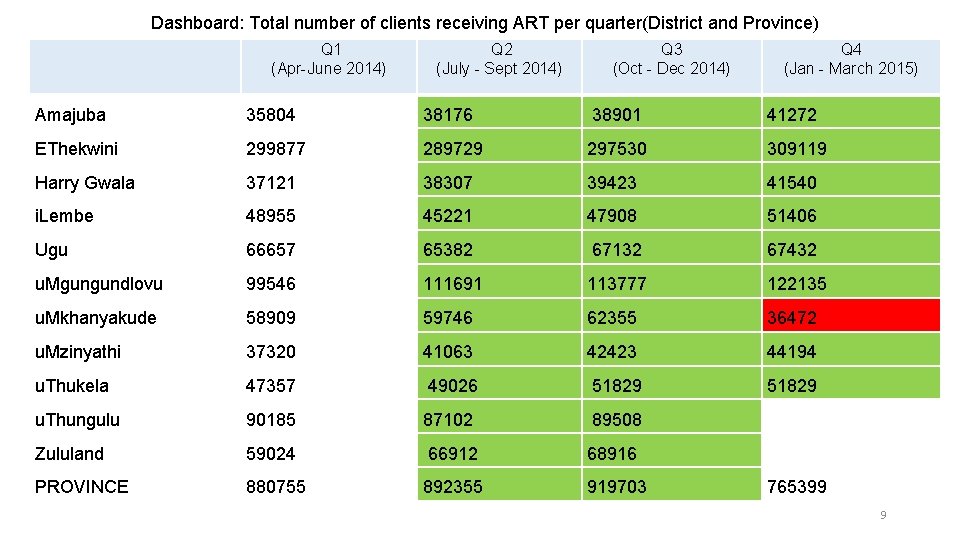
Dashboard: Total number of clients receiving ART per quarter(District and Province) Q 1 (Apr-June 2014) Q 2 (July - Sept 2014) Q 3 (Oct - Dec 2014) Q 4 (Jan - March 2015) Amajuba 35804 38176 38901 41272 EThekwini 299877 289729 297530 309119 Harry Gwala 37121 38307 39423 41540 i. Lembe 48955 45221 47908 51406 Ugu 66657 65382 67132 67432 u. Mgungundlovu 99546 111691 113777 122135 u. Mkhanyakude 58909 59746 62355 36472 u. Mzinyathi 37320 41063 42423 44194 u. Thukela 47357 49026 51829 u. Thungulu 90185 87102 89508 Zululand 59024 66912 68916 PROVINCE 880755 892355 919703 765399 9
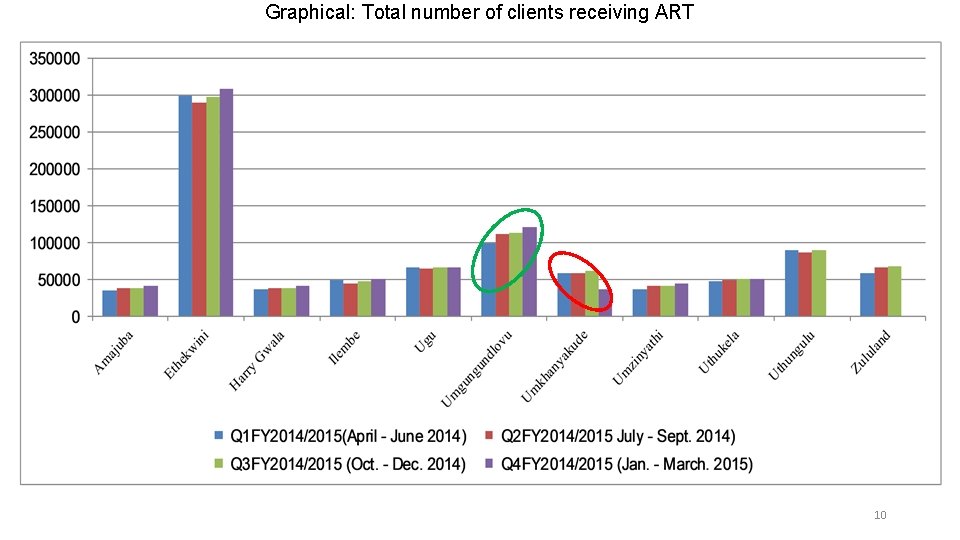
Graphical: Total number of clients receiving ART 10
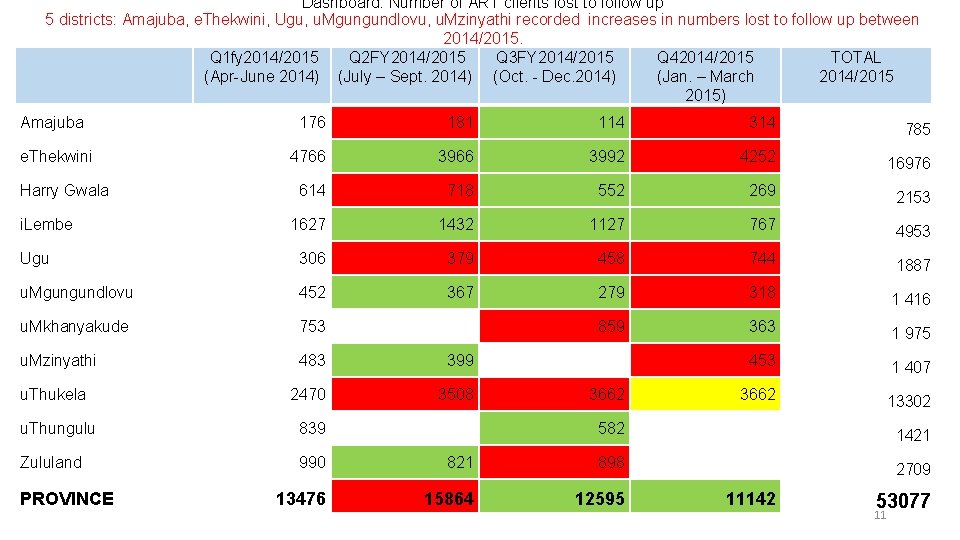
Dashboard: Number of ART clients lost to follow up 5 districts: Amajuba, e. Thekwini, Ugu, u. Mgungundlovu, u. Mzinyathi recorded increases in numbers lost to follow up between 2014/2015. Q 1 fy 2014/2015 Q 2 FY 2014/2015 Q 3 FY 2014/2015 Q 42014/2015 TOTAL (Apr-June 2014) (July – Sept. 2014) (Oct. - Dec. 2014) (Jan. – March 2014/2015) Amajuba 176 181 114 314 785 e. Thekwini 4766 3992 4252 16976 614 718 552 269 2153 1627 1432 1127 767 4953 Ugu 306 379 458 744 1887 u. Mgungundlovu 452 367 279 318 1 416 u. Mkhanyakude 753 859 363 1 975 u. Mzinyathi 483 399 453 1 407 2470 3508 3662 13302 Harry Gwala i. Lembe u. Thukela u. Thungulu 839 Zululand 990 13476 PROVINCE 582 1421 821 898 2709 15864 12595 11142 53077 11
Fast Track 90 90 90
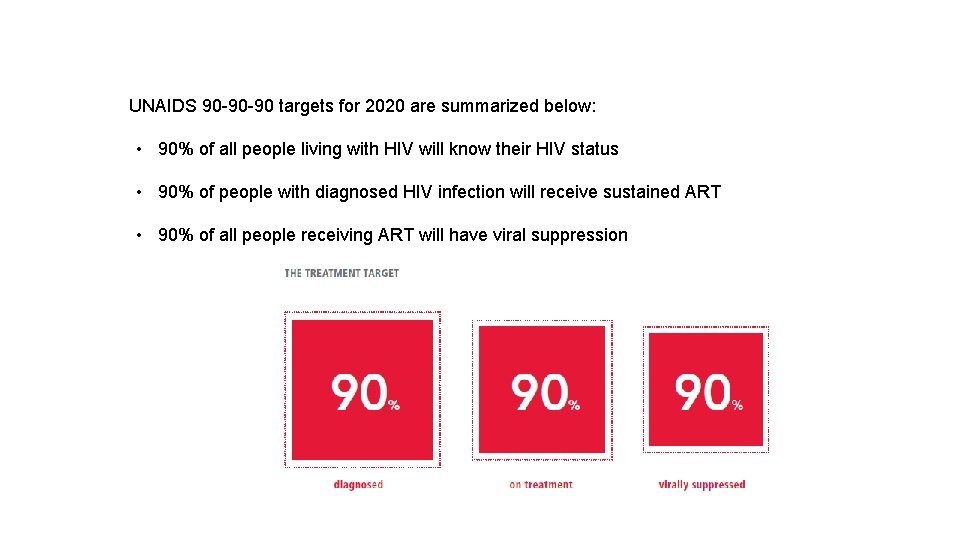
Global 90 -90 -90 HIV Targets UNAIDS 90 -90 -90 targets for 2020 are summarized below: • 90% of all people living with HIV will know their HIV status • 90% of people with diagnosed HIV infection will receive sustained ART • 90% of all people receiving ART will have viral suppression
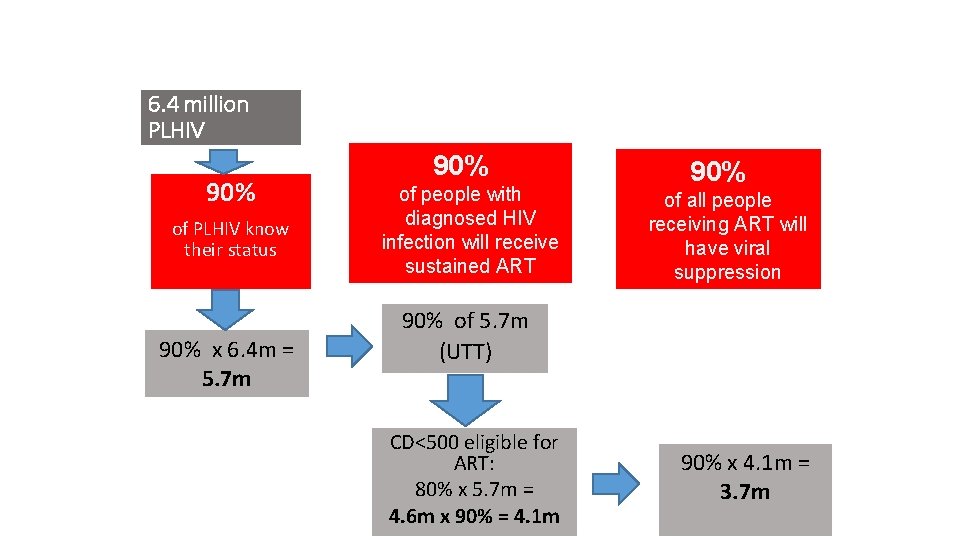
What does 90 90 90 for HIV mean for South Africa 6. 4 million PLHIV 90% of PLHIV know their status 90% x 6. 4 m = 5. 7 m 90% of people with diagnosed HIV infection will receive sustained ART 90% of all people receiving ART will have viral suppression 90% of 5. 7 m (UTT) CD<500 eligible for ART: 80% x 5. 7 m = 4. 6 m x 90% = 4. 1 m 90% x 4. 1 m = 3. 7 m
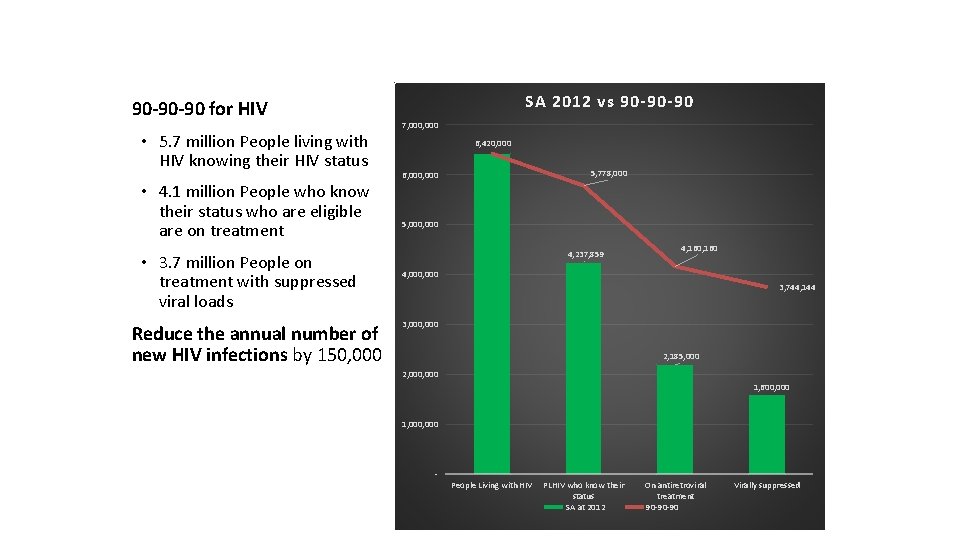
HIV Treatment Cascade 90 -90 -90 for HIV • 5. 7 million People living with HIV knowing their HIV status • 4. 1 million People who know their status who are eligible are on treatment • 3. 7 million People on treatment with suppressed viral loads Reduce the annual number of new HIV infections by 150, 000 SA 2012 vs 90 -90 -90 7, 000 6, 420, 000 5, 778, 000 6, 000 5, 000 4, 237, 859 4, 160 4, 000 3, 744, 144 3, 000 2, 185, 000 2, 000 1, 600, 000 1, 000 - People Living with HIV PLHIV who know their status SA at 2012 On antiretroviral treatment 90 -90 -90 Virally suppressed
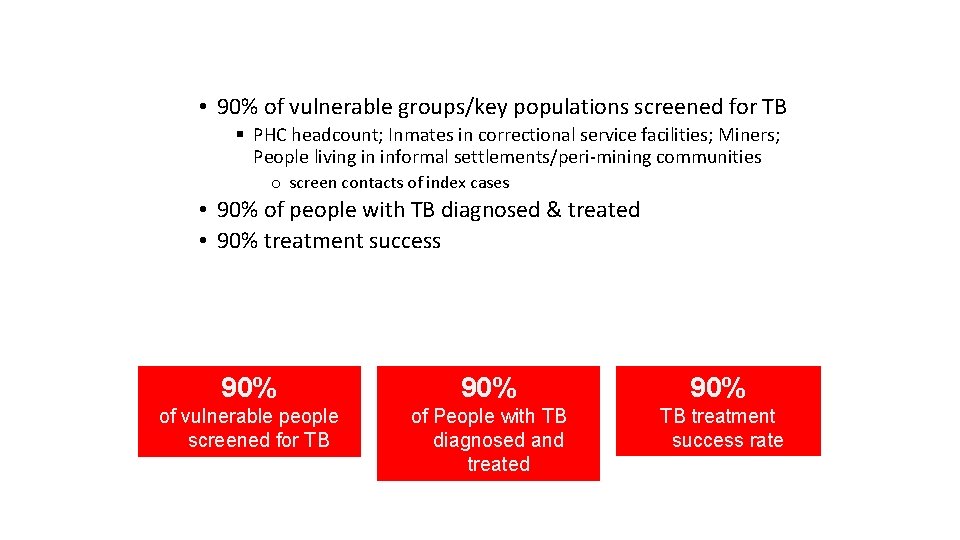
90 -90 -90 TB Targets • 90% of vulnerable groups/key populations screened for TB § PHC headcount; Inmates in correctional service facilities; Miners; People living in informal settlements/peri-mining communities o screen contacts of index cases • 90% of people with TB diagnosed & treated • 90% treatment success 90% of vulnerable people screened for TB of People with TB diagnosed and treated TB treatment success rate
90 90 90 Tracer Indicators Phase 2 - FY 2016/17
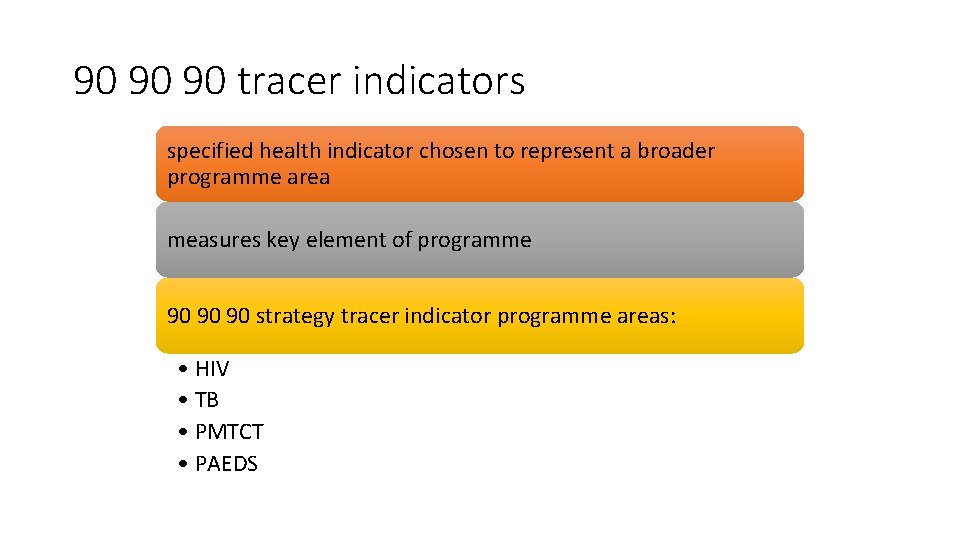
90 90 90 tracer indicators specified health indicator chosen to represent a broader programme area measures key element of programme 90 90 90 strategy tracer indicator programme areas: • HIV • TB • PMTCT • PAEDS
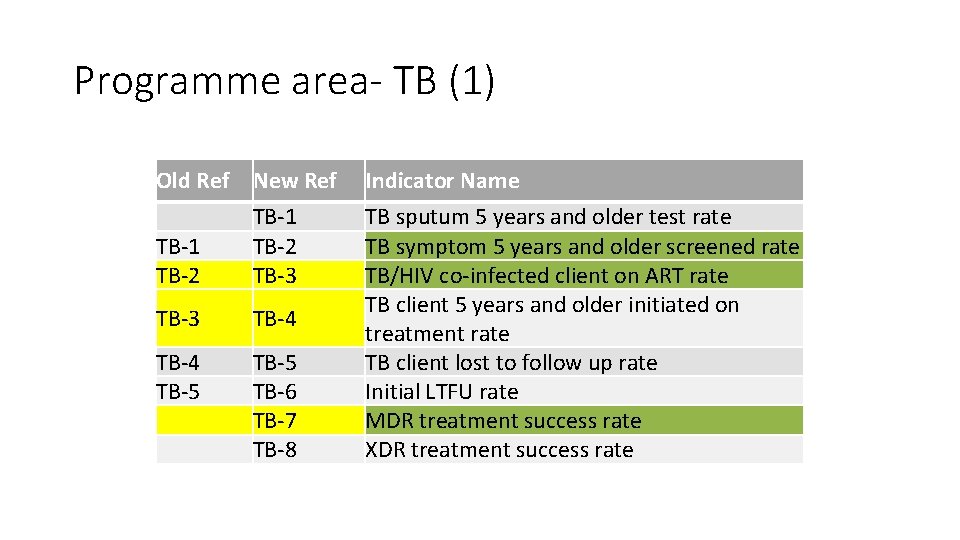
Programme area- TB (1) Old Ref New Ref Indicator Name TB-1 TB-2 TB-3 TB-4 TB-5 TB-6 TB-7 TB-8 TB sputum 5 years and older test rate TB symptom 5 years and older screened rate TB/HIV co-infected client on ART rate TB client 5 years and older initiated on treatment rate TB client lost to follow up rate Initial LTFU rate MDR treatment success rate XDR treatment success rate
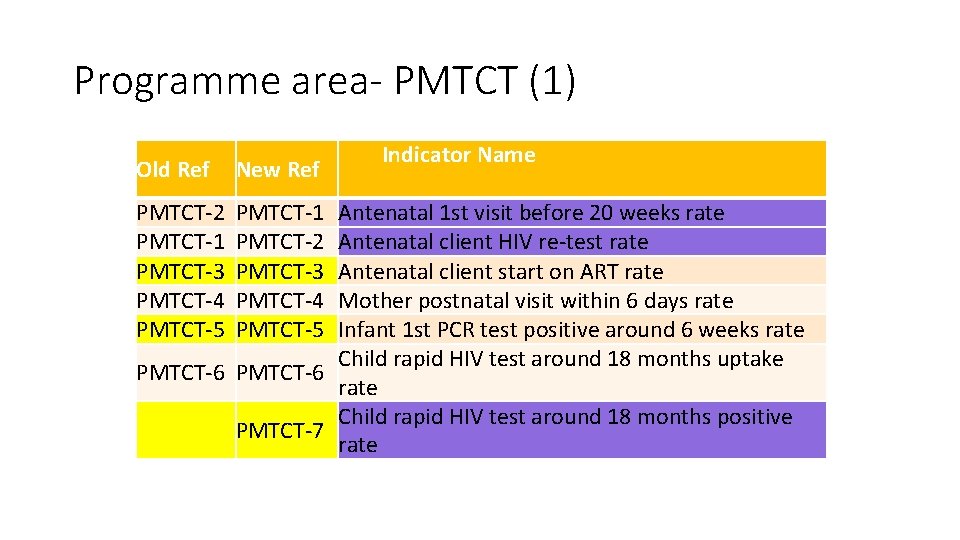
Programme area- PMTCT (1) Old Ref New Ref PMTCT-2 PMTCT-1 PMTCT-3 PMTCT-4 PMTCT-5 PMTCT-1 PMTCT-2 PMTCT-3 PMTCT-4 PMTCT-5 Indicator Name Antenatal 1 st visit before 20 weeks rate Antenatal client HIV re-test rate Antenatal client start on ART rate Mother postnatal visit within 6 days rate Infant 1 st PCR test positive around 6 weeks rate Child rapid HIV test around 18 months uptake PMTCT-6 rate Child rapid HIV test around 18 months positive PMTCT-7 rate
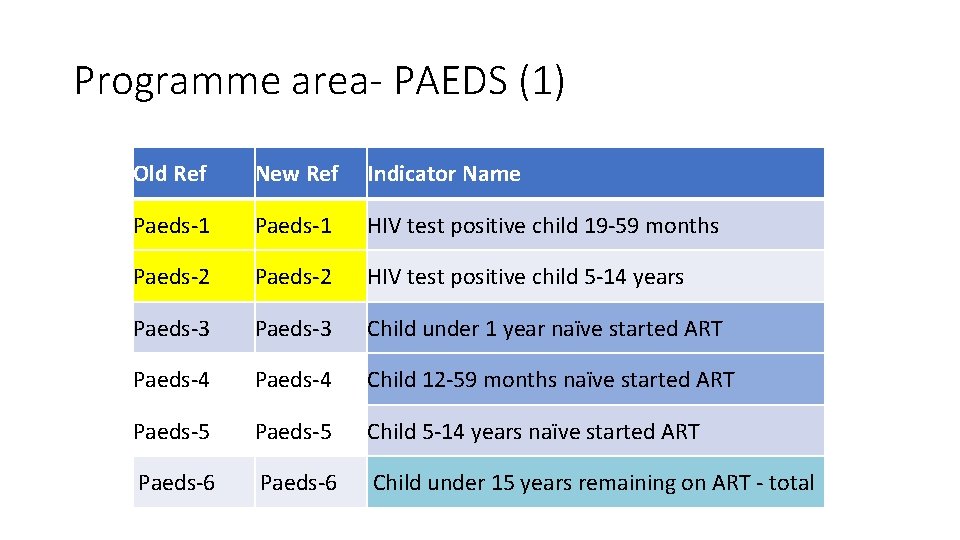
Programme area- PAEDS (1) Old Ref New Ref Indicator Name Paeds-1 HIV test positive child 19 -59 months Paeds-2 HIV test positive child 5 -14 years Paeds-3 Child under 1 year naïve started ART Paeds-4 Child 12 -59 months naïve started ART Paeds-5 Child 5 -14 years naïve started ART Paeds-6 Child under 15 years remaining on ART - total
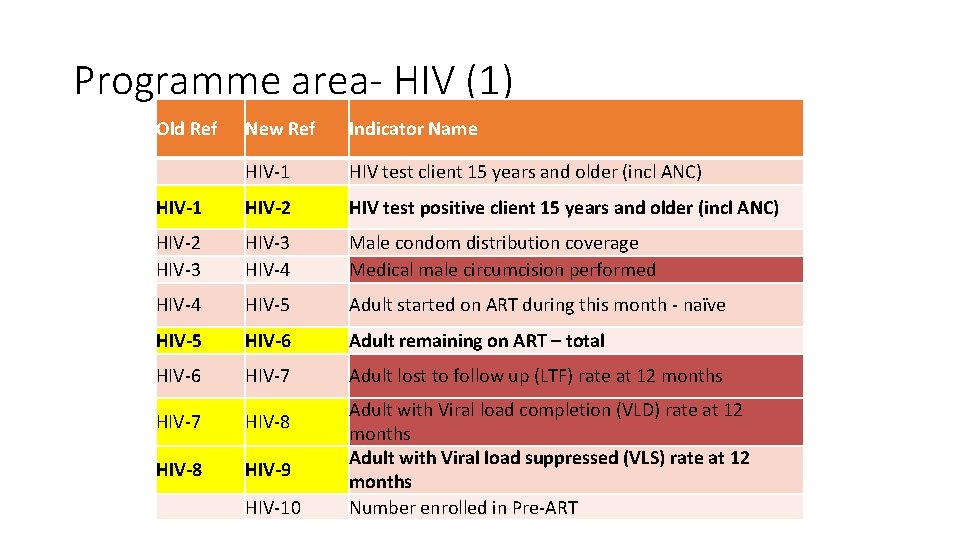
Programme area- HIV (1) Old Ref New Ref Indicator Name HIV-1 HIV test client 15 years and older (incl ANC) HIV-1 HIV-2 HIV test positive client 15 years and older (incl ANC) HIV-2 HIV-3 HIV-4 Male condom distribution coverage Medical male circumcision performed HIV-4 HIV-5 Adult started on ART during this month - naïve HIV-5 HIV-6 Adult remaining on ART – total HIV-6 HIV-7 Adult lost to follow up (LTF) rate at 12 months HIV-7 HIV-8 HIV-9 HIV-10 Adult with Viral load completion (VLD) rate at 12 months Adult with Viral load suppressed (VLS) rate at 12 months Number enrolled in Pre-ART
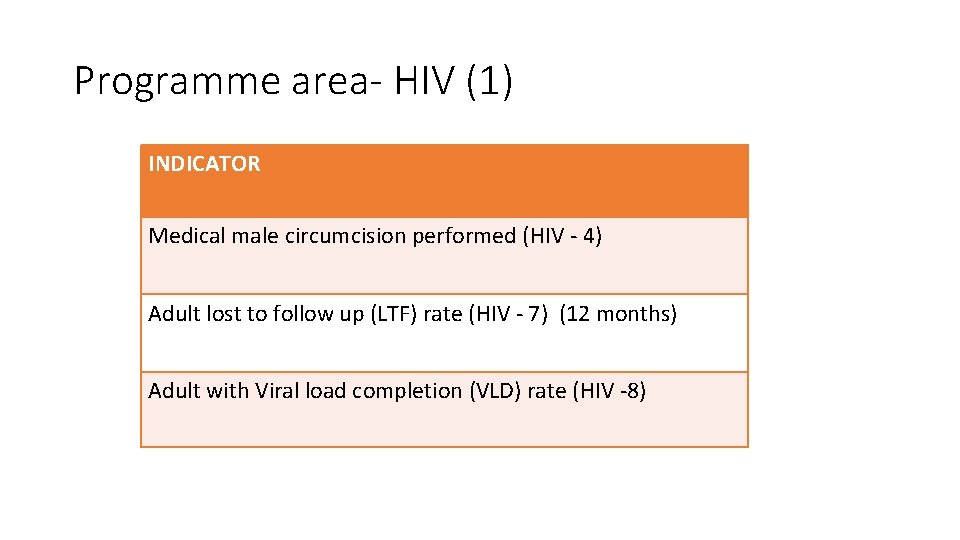
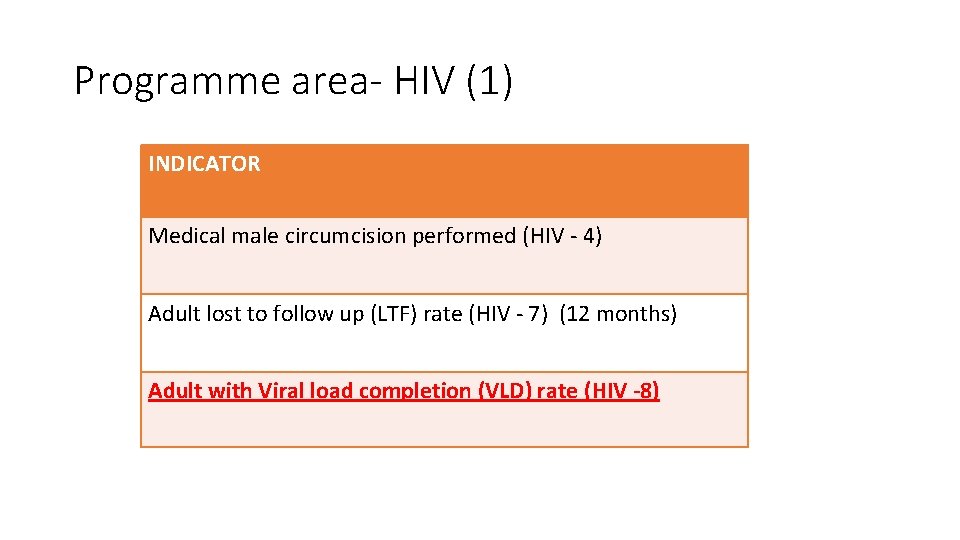
Programme area- HIV (1) INDICATOR Medical male circumcision performed (HIV - 4) Adult lost to follow up (LTF) rate (HIV - 7) (12 months) Adult with Viral load completion (VLD) rate (HIV -8)
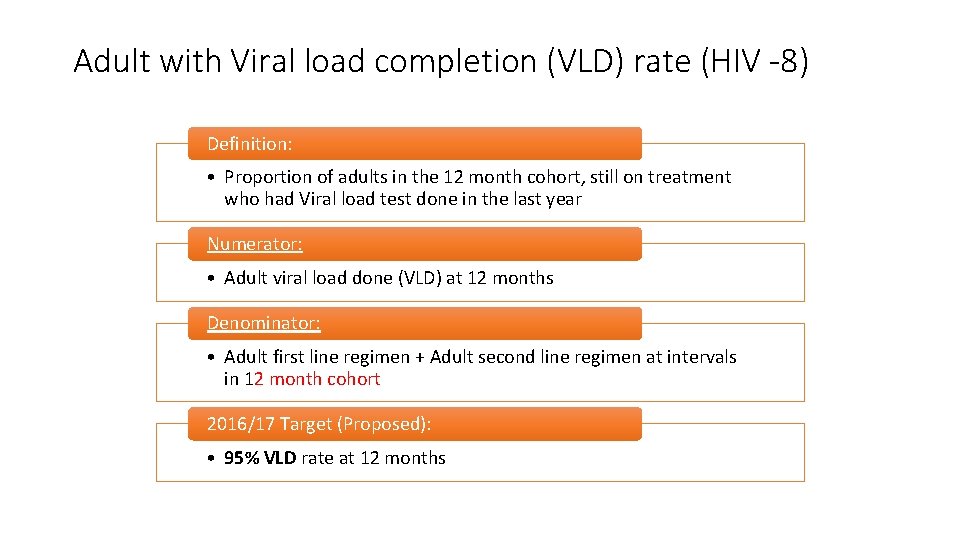
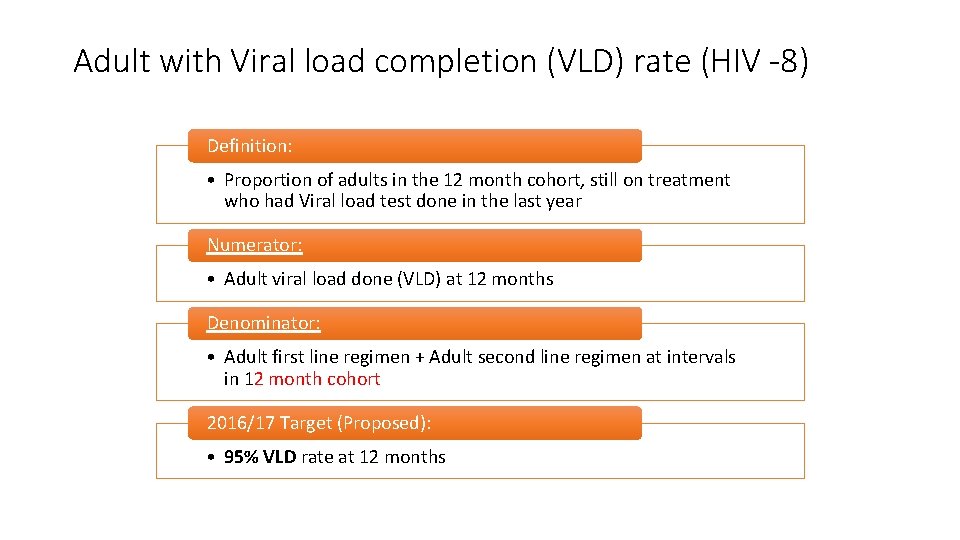
Adult with Viral load completion (VLD) rate (HIV -8) Definition: • Proportion of adults in the 12 month cohort, still on treatment who had Viral load test done in the last year Numerator: • Adult viral load done (VLD) at 12 months Denominator: • Adult first line regimen + Adult second line regimen at intervals in 12 month cohort 2016/17 Target (Proposed): • 95% VLD rate at 12 months
Which of these statements is false. An undectectable viral load will – • 1. Halt disease progression • 2. Reduce incidence of Ois • 3. Promote immunological recovery • 4. Prevent drug resistance • 5. Eradicate the virus
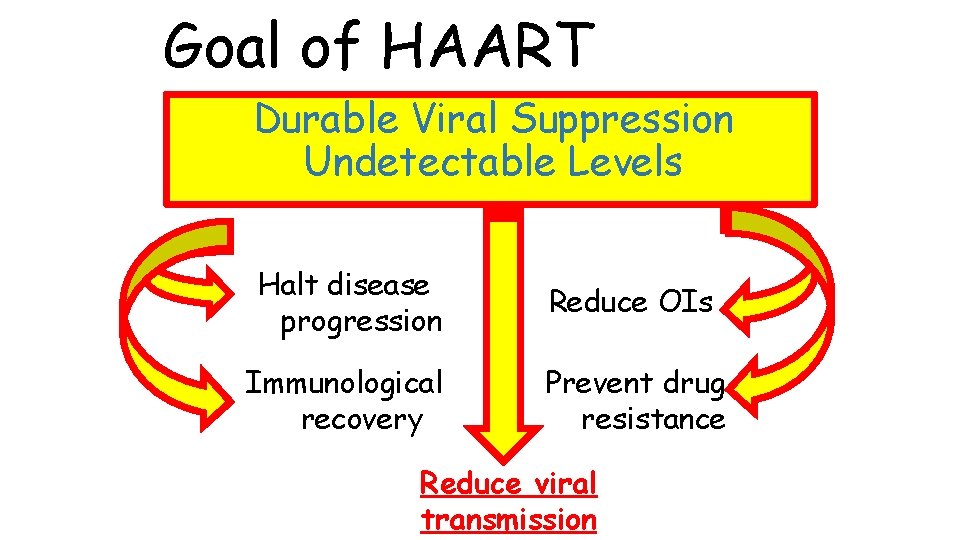
Goal of HAART Durable Viral Suppression Undetectable Levels Halt disease progression Reduce OIs Immunological recovery Prevent drug resistance Reduce viral transmission
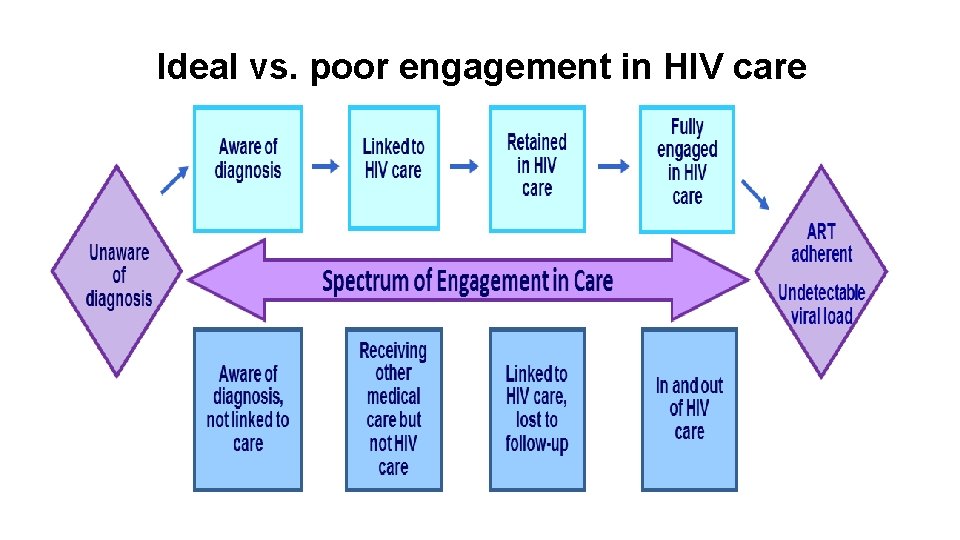
Ideal vs. poor engagement in HIV care
Adherence monitoring: Use the viral load. • WHO recommends VL monitoring with other adherence measures. • Raised viral load indicates a risk of failure, so DO something. • 56 -68% can re-suppress with an adherence intervention.
Long-term 2 nd-line outcomes Murphy-Sunpath Proportion with VL <50 c/m. L Virologic outcome according to adherence level over time
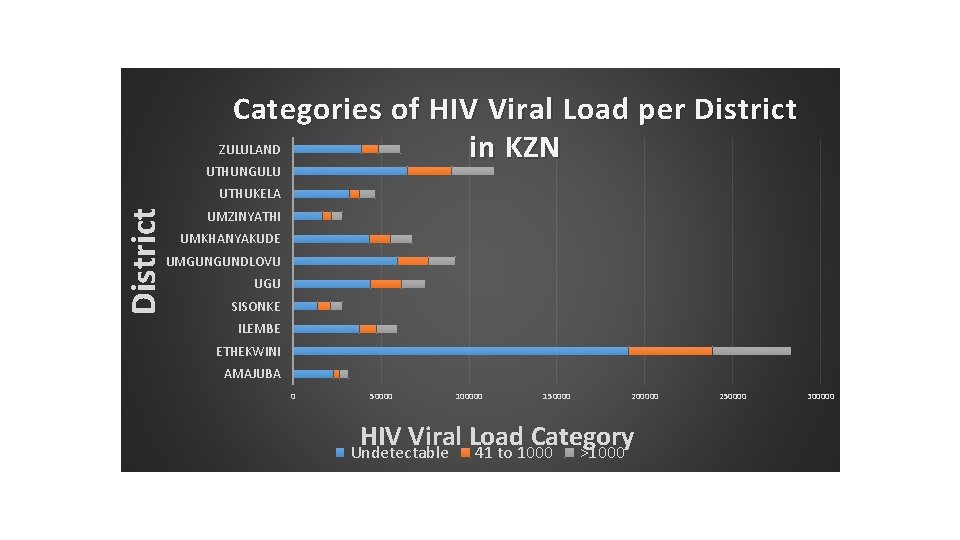
Categories of HIV Viral Load per District ZULULAND in KZN UTHUNGULU District UTHUKELA UMZINYATHI UMKHANYAKUDE UMGUNGUNDLOVU UGU SISONKE ILEMBE ETHEKWINI AMAJUBA 0 50000 100000 150000 200000 HIV Viral Load Category 41 to 1000 >1000 Undetectable 250000 300000
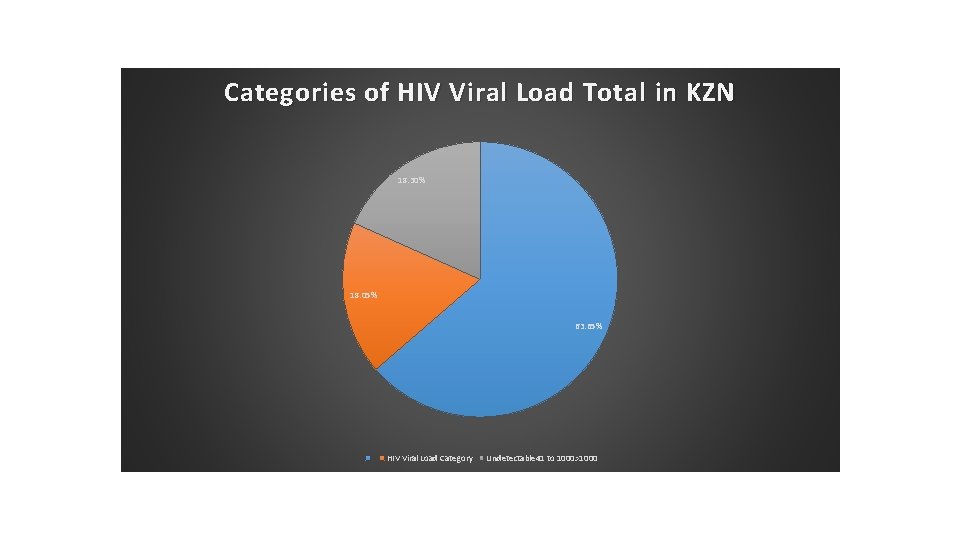
Categories of HIV Viral Load Total in KZN 18. 30% 18. 05% 63. 65% HIV Viral Load Category Undetectable 41 to 1000>1000
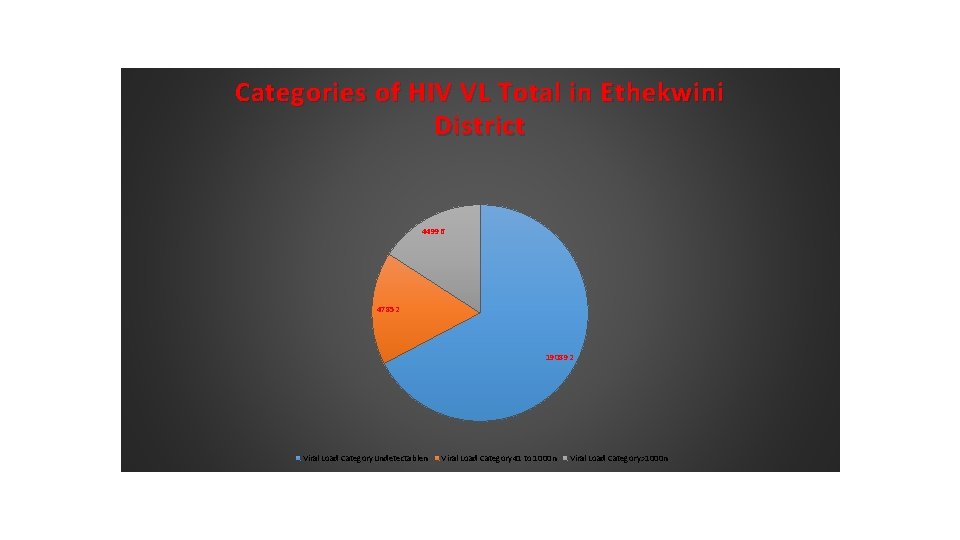
Categories of HIV VL Total in Ethekwini District 44996 47852 190892 Viral Load Category. Undetectablen Viral Load Category 41 to 1000 n Viral Load Category>1000 n
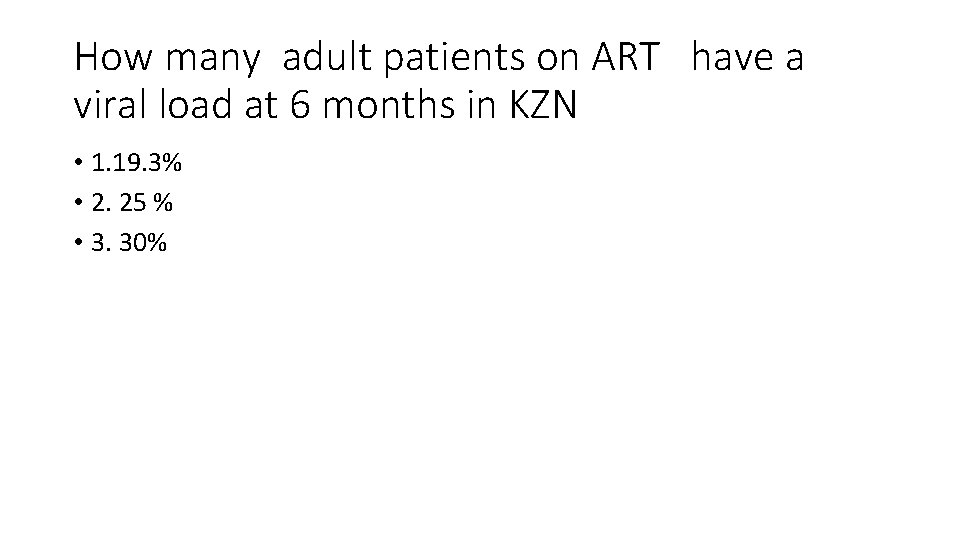
How many adult patients on ART have a viral load at 6 months in KZN • 1. 19. 3% • 2. 25 % • 3. 30%
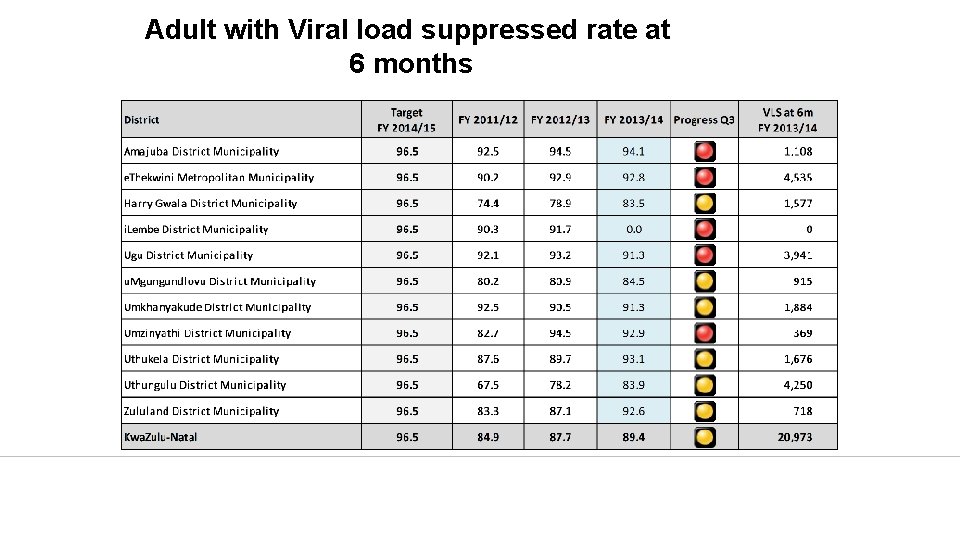
Adult with Viral load suppressed rate at 6 months
Adult with Viral load completion rate at 6 months
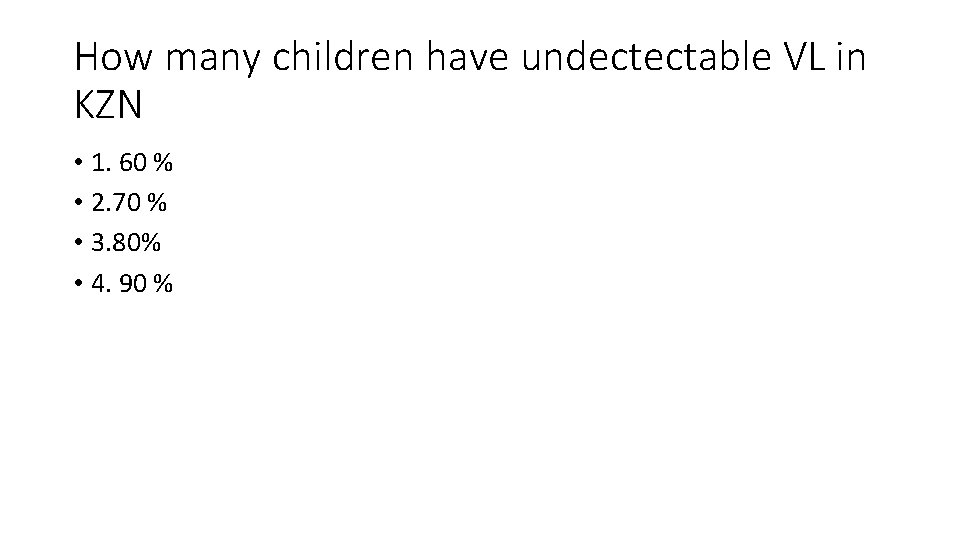
How many children have undectectable VL in KZN • 1. 60 % • 2. 70 % • 3. 80% • 4. 90 %
Child under 15 years with Viral load suppressed rate at 6 months
Child under 15 years with Viral load completion rate at 6 months
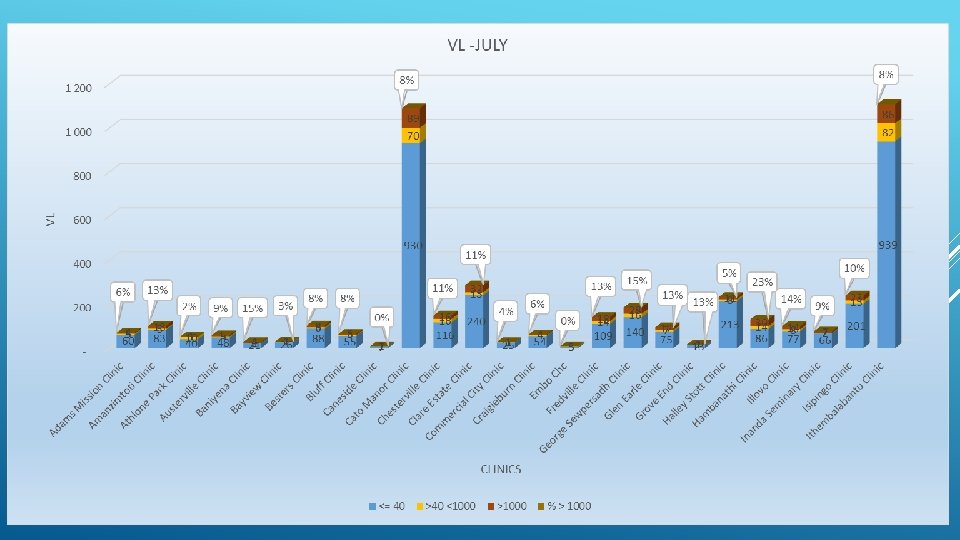
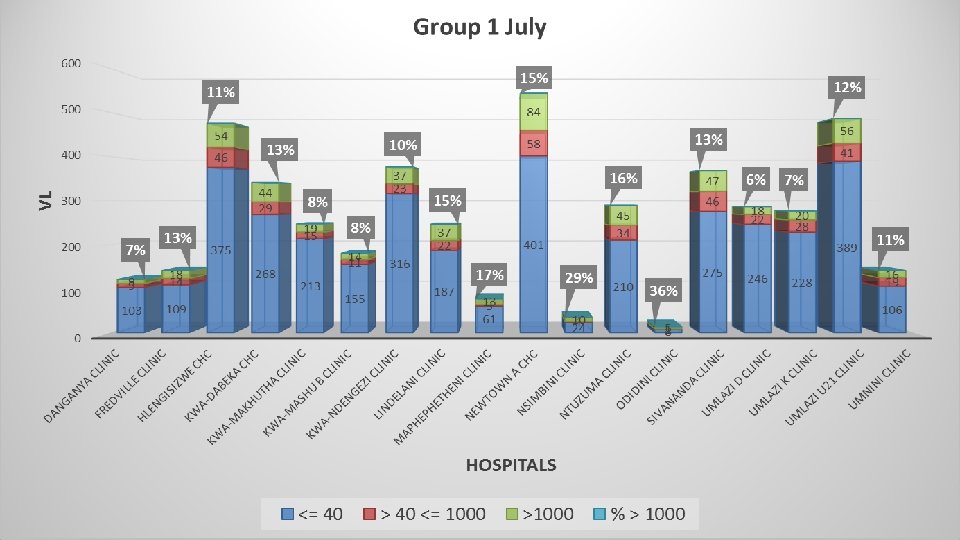
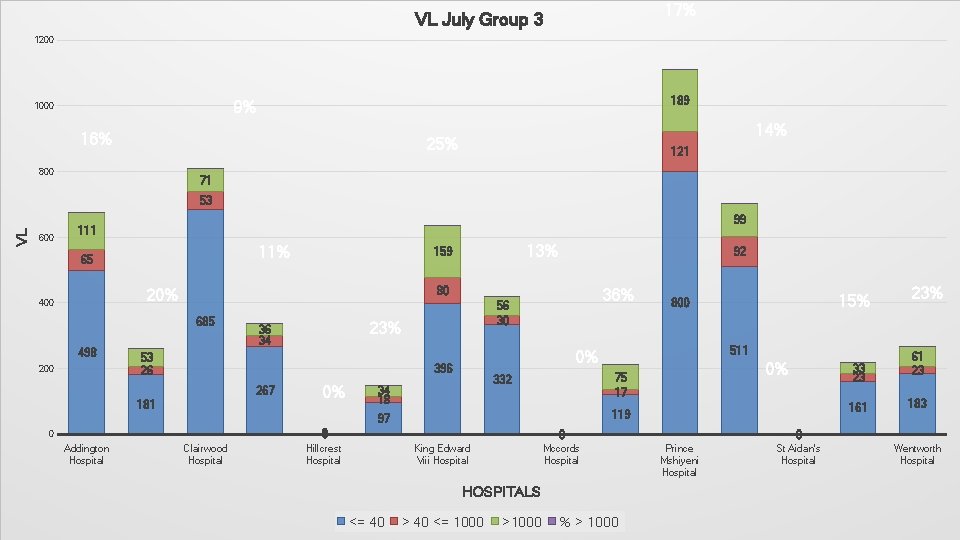
17% VL July Group 3 1200 189 9% 1000 16% 14% 25% 800 121 71 VL 53 600 99 111 11% 65 685 498 200 92 80 20% 400 13% 159 23% 36 34 53 26 181 0% 0 1 Addington Hospital Clairwood Hospital 0% 161 0 Hillcrest Hospital King Edward Viii Hospital Mccords Hospital HOSPITALS <= 40 33 23 119 97 0 511 75 17 332 34 18 15% 800 0% 396 267 36% 56 30 > 40 <= 1000 >1000 % > 1000 23% 61 23 183 0 Prince Mshiyeni Hospital St Aidan's Hospital Wentworth Hospital
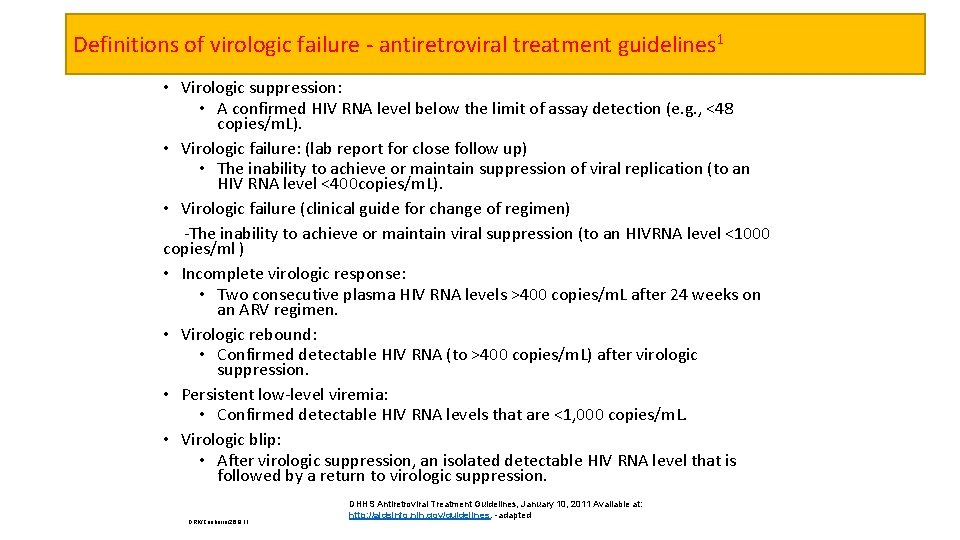
Definitions of virologic failure - antiretroviral treatment guidelines 1 • Virologic suppression: • A confirmed HIV RNA level below the limit of assay detection (e. g. , <48 copies/m. L). • Virologic failure: (lab report for close follow up) • The inability to achieve or maintain suppression of viral replication (to an HIV RNA level <400 copies/m. L). • Virologic failure (clinical guide for change of regimen) -The inability to achieve or maintain viral suppression (to an HIVRNA level <1000 copies/ml ) • Incomplete virologic response: • Two consecutive plasma HIV RNA levels >400 copies/m. L after 24 weeks on an ARV regimen. • Virologic rebound: • Confirmed detectable HIV RNA (to >400 copies/m. L) after virologic suppression. • Persistent low-level viremia: • Confirmed detectable HIV RNA levels that are <1, 000 copies/m. L. • Virologic blip: • After virologic suppression, an isolated detectable HIV RNA level that is followed by a return to virologic suppression. DRK/Canberra/26. 9. 11 DHHS Antiretroviral Treatment Guidelines, January 10, 2011 Available at: http: //aidsinfo. nih. gov/guidelines. -adapted
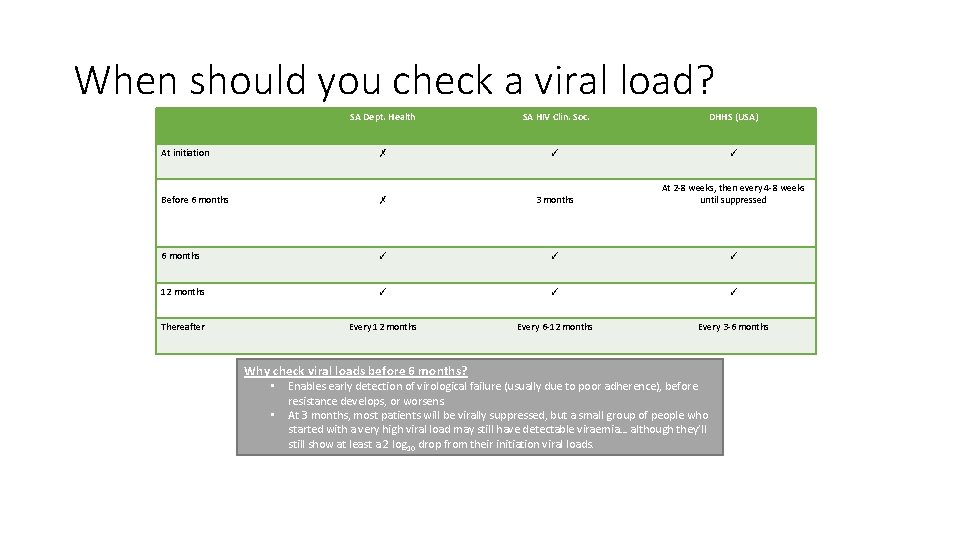
When should you check a viral load? SA Dept. Health SA HIV Clin. Soc. DHHS (USA) At initiation ✗ ✓ ✓ Before 6 months ✗ 3 months At 2 -8 weeks, then every 4 -8 weeks until suppressed 6 months ✓ ✓ ✓ 12 months ✓ ✓ ✓ Thereafter Every 12 months Every 6 -12 months Every 3 -6 months Why check viral loads before 6 months? • • Enables early detection of virological failure (usually due to poor adherence), before resistance develops, or worsens. At 3 months, most patients will be virally suppressed, but a small group of people who started with a very high viral load may still have detectable viraemia… although they’ll still show at least a 2 log 10 drop from their initiation viral loads.
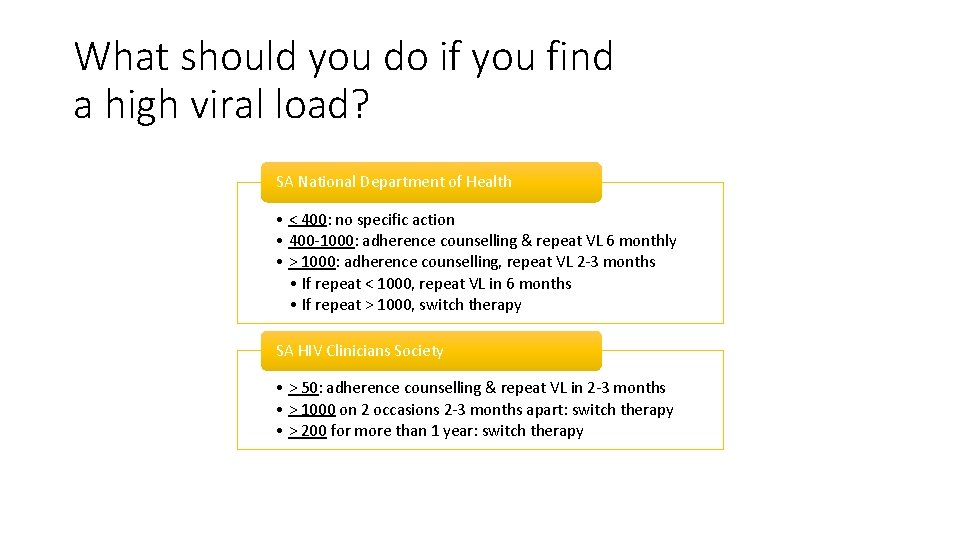
What should you do if you find a high viral load? SA National Department of Health • < 400: no specific action • 400 -1000: adherence counselling & repeat VL 6 monthly • > 1000: adherence counselling, repeat VL 2 -3 months • If repeat < 1000, repeat VL in 6 months • If repeat > 1000, switch therapy SA HIV Clinicians Society • > 50: adherence counselling & repeat VL in 2 -3 months • > 1000 on 2 occasions 2 -3 months apart: switch therapy • > 200 for more than 1 year: switch therapy
Programme area- HIV (1) INDICATOR Medical male circumcision performed (HIV - 4) Adult lost to follow up (LTF) rate (HIV - 7) (12 months) Adult with Viral load completion (VLD) rate (HIV -8)
Adult with Viral load completion (VLD) rate (HIV -8) Definition: • Proportion of adults in the 12 month cohort, still on treatment who had Viral load test done in the last year Numerator: • Adult viral load done (VLD) at 12 months Denominator: • Adult first line regimen + Adult second line regimen at intervals in 12 month cohort 2016/17 Target (Proposed): • 95% VLD rate at 12 months
Bottleneck Analysis 1. Know your indicator, track your response, accountability 2. Target setting and targeting 3. Data management 4. Communication (ACSM, demand creation strategy) 5. Get the basics right then innovate 6. Infrastructure, medicines, PSCM, equipment 7. Human resources 8. Service delivery platforms defined and linkages with communities 9. Connecting the dots (linkage to care, integration) 10. Cascades and 11. Referrals and pathways (continuum transport (mapped, of care) available and skilled) 12. Inter-sectoral coordination (social development, private sector, schools)
KZN VL monitoring ENSURE THAT VL IS DONE ON TIME USE OF VL REGISTERS MONTHLY TO ASSESS 6 AND 12 MONTHLY VL COMPLETION RATES PATIENT EDUCATION AT INITIATION AND EACH FOLLOW UP VISIT USE REMINDERS USING APPOINTMENT CARDS , COMMUNITY WORKERS , ADHERENCE CLUBS , GRADUAL IMPLEMENTATION OF ICSM MODEL AT ALL PHCs ENSURE THAT TEST IS DONE LAB AND RESULTS AVAILABLE ENSURE THAT RESULTS ARE RECEIVED AND FOLLOWED UP IN THE CLINIC
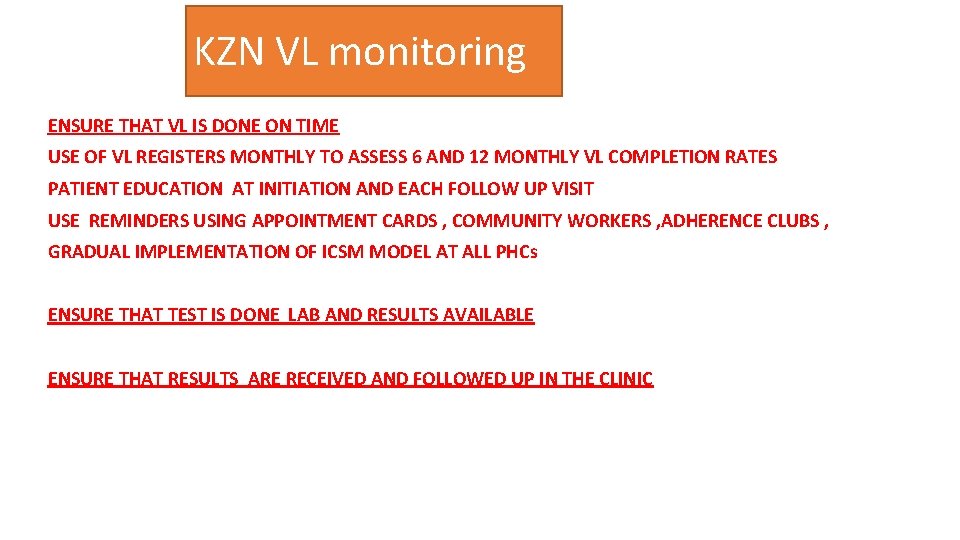
DATA ELEMENTS- WITH VL REGISTER • HOW MANY PER MONTH HAD THEIR 6 MONTHS VL DONE ? • HOW MAY DID NOT HAVE THE VL DONE ? • WHAT HAPPENED TO THE RESULTS? LATER MONITOR 12 MONTHLY SO THAT CLINIC SPECEFIC DATA CAN BE WORKED OUR
IMPORTANT!!! • How many who had a high VL > 1000 copies/ml had a repeat blood after 2 - 3 months adherence intervention? • This must also Be reflected in the VL register. • Could NHLS develop a patient linked Vl data longitudinally? ? ?
OTHER QUICK WINS • GET PHARMACY INVOLVED • CREATION OF STANDARDISED CLINICAL RECORDS –FACE SHEET FOR FOLLOW UP
TWG plans • Report from NHLS – review by District task team for QI HAST SERVICES –meet monthly on first Wednesday • Input into monthly TWG meeting at District office on Monday • Quarterly meeting with all HAST clinical managers and ONM of ART clinics –including NGOs • Achieve >90 %VC rate at 12 months and >90 suppression rates at 12 months
• What is needed to get more useful data for appropriate follow up? All our labs have a list of rejection criteria so we are strict about it. But we will still do the HIV VL even if we have no clinical details FORM MUST INDICATE • Whether it is a 6/12, 12/12, 18/12, 24/12 etc test • Whether px is on Reg 1, Reg 2 or Reg 3 • MRN=MEDICAL RECORD NUMBER – this is a unique number which we put on every result – this number should be used whenever any lab test is requested so that when HIV VL are downloaded then I
ART Program Use of EWI Results 1. Strengthened record keeping systems • • • 2. 3. 4. 5. Formation of clinic specific care optimizing committees 1 Validation of existing electronic record keeping systems 1, 2, 3 Adjustments in pharmacy record keeping to permit on time pill pick up assessments 3 Pilot of enhanced defaulter tracing to identify patients missing drug pick-ups with the goal of reengaging in care within 48 hours 1 General strengthening of records 4, 5, 6, 7, 8 Seek funding support from partners to scale-up EWI 9 District teams to support adherence and trace patients LTFU 1, 10, 11 Scale-up viral load testing 5 Regular review of patient pill pick-up and establishment of formal referral system to document transfers-in/out 6 1 Hong et al. JAIDS 2010; 2 Anna Jonas, Mo. HSS Namibia, personal communication; 3 Dawn Pereko, MSH Namibia, personal communication; 4 Jack N et al. CID (in press); 5 Ye M et al. CID (in press); 6 Daonie e et al. CID (in pres); 7 Nhan DT el al. CID (in press); Hedt BL et al. , Anti Viral Ther 2008; 9 Paula Mundari, Uganda National ART Programme, IAS 2010, Vienna; 10 Evelyne B, National ART Program, Burundi, personal communication; 11 Anna Jonas, Mo. HSS Namibia, personal communication.
Acknowledgements • Desmond Tutu HIV Centre team • Melanie Thompson and IAPAC guideline team • Catherine Orrell • AWACC -2014 • NDOH presentation -2015
90 90 90 Tracer Indicators Phase 2 - FY 2016/17 Harsha Somaroo PHM MO Ethekwini District Office
Analysis District AIDS Councils Response to the HIV& AIDS, STIs & TB Multi-Sectoral Response Quarter 4 2014/2015 Presentation made at the DAC & LAC Secretariat Meeting 23/07/2015 HIV & AIDS Directorate Office of the Premier, Province of Kwa. Zulu-Natal
- Slides: 57