PREVENTION AND CONTROL OF LIFESTYLE DISEASE Proportion of


 in the state was 0. 3%")


 was the leading site followed by cancer")


 accounted for 5. 2% of the")


 25 20. 6 20 15 20 14. 8 15 10")


")


 was")
 in the state was estimated to")


- Slides: 58
PREVENTION AND CONTROL OF LIFESTYLE DISEASE
Proportion of global deaths under the age 70 years, by cause of death, comparable estimates, 2012
Age-standardized NCD death rates by WHO region
Probability of dying from the four main noncommunicable diseases between the ages of 30 and 70 years comparable estimates, 2012
NCD and risk factors
Cardiovascular diseases
Cardiovascular diseases is the leading cause of mortality in Kerala contributing to as much as 40% of all deaths. The age adjusted death rate due to cardiovascular in the state is 490 per lakh for men and 231 per lakh for women every year
Coronary artery diseases State reports a higher prevalence of coronary artery diseases when compared to other states in India 7. 4% in rural (in 1991) � 13. 5% in urban(in 1995) � The estimated prevalence of coronary artery disease in the age group 20 -69 years for 2015 is 10. 1 %. (31) *Kutty VR, Balakrishnan KG, Jayasree AK, Thomas J. Prevalence of coronary heart disease in the rural population of Thiruvananthapuram district, Kerala, India. Int J Cardiol [Internet]. 1993 Apr [cited 2015 Apr 24]; 39(1): 59– 70. Available from: http: //www. ncbi. nlm. nih. gov/pubmed/8407009 **Begom R, Singh RB. Prevalence of coronary artery disease and its risk factors in the urban population of South and North India. Acta Cardiol [Internet]. 1995 Jan [cited 2015 May 7]; 50(3): 227– 40. Available from: http: //www. ncbi. nlm. nih. gov/pubmed/7676762 ***National Commission on Macroeconomics and Health. NCMH Background Papers·Burden of Disease in India. New delhi; 2005. p. 1 – 388. Available from: http: //www. who. int/macrohealth/action/NCMH_Burden of disease_(29 Sep 2005). pdf
Death due to coronary artery disease in kerala 450 400 382 Per 100, 000 350 300 250 males 200 150 170 females 128 100 64 50 41 70 50 15 0 Kerala China Japan United states Mohanan PP, Mathew R, Harikrishnan S, Krishnan MN, Zachariah G, Joseph J, et al. Presentation, management, and outcomes of 25 748 acute coronary syndrome admissions in Kerala, India: results from the Kerala ACS Registry. Eur Heart J [Internet]. 2013 Jan 7 [cited 2015 May 8]; 34(2): 121– 9. Available from: http: //eurheartj. oxfordjournals. org/content/early/2012/09/06/eurheartj. ehs 219
Acute coronary event in Kerala CAD in Kerala is both premature and malignant � Average is 60 years (56 in males and 69 in females) � 60% of CAD deaths in men and 40% of CAD deaths in women occur before the age of 65 (USA -18%) Soman CR, Kutty VR, Safraj S, Vijayakumar K, Rajamohanan K, Ajayan K. All-cause mortality and cardiovascular mortality in Kerala state of India: results from a 5 -year follow-up of 161, 942 rural community dwelling adults. Asia Pac J Public Health [Internet]. 2011 Nov [cited 2015 Apr 23]; 23(6): 896– 903. Available from: http: //www. ncbi. nlm. nih. gov/pubmed/20460280 � 1 month case fatality rate following STEMI- 8. 5% ( around 4 in developed countries) Mohanan PP, Mathew R, Harikrishnan S, Krishnan MN, Zachariah G, Joseph J, et al. Presentation, management, and outcomes of 25 748 acute coronary syndrome admissions in Kerala, India: results from the Kerala ACS Registry. Eur Heart J [Internet]. 2013 Jan 7 [cited 2015 May 8]; 34(2): 121– 9. Available from: http: //eurheartj. oxfordjournals. org/content/early/2012/09/06/eurheartj. ehs 219
Stroke Prevalence stroke among adults (>18 years ) in the state was 0. 3% The age adjusted annual incidence of stroke in Kerala in 2010 was 135 per 100, 000 � were more in males (143 )compared to females (128) Ischemic stroke was the most common type of stroke ( 73 per 100000) #Menon J, Joseph J, Thachil A, Attacheril T V, Banerjee A. Surveillance of noncommunicable diseases by community health workers in Kerala: the epidemiology of noncommunicable diseases in rural areas (ENDIRA) study. Glob Heart [Internet]. 2014 Dec [cited 2015 Apr 1]; 9(4): 409– 17. Available from: http: //www. ncbi. nlm. nih. gov/pubmed/25592794 ##Soman CR, Kutty VR, Safraj S, Vijayakumar K, Rajamohanan K, Ajayan K. All-cause mortality and cardiovascular mortality in Kerala state of India: results from a 5 -year follow-up of 161, 942 rural community dwelling adults. Asia Pac J Public Health [Internet]. 2011 Nov [cited 2015 Apr 23]; 23(6): 896– 903. Available from: http: //www. ncbi. nlm. nih. gov/pubmed/20460280
Stroke No urban rural difference in incidence average of stroke patients was 67 years � stroke in the young( <40 years, )only 4% case fatality rate within one month was 24. 5% for urban and 37. 1% for rural populations which is comparable to national figures Sridharan SE, Unnikrishnan JP, Sukumaran S, Sylaja PN, Nayak SD, Sarma PS, et al. Incidence, types, risk factors, and outcome of stroke in a developing country: the Trivandrum Stroke Registry. Stroke [Internet]. 2009 Apr 1 [cited 2015 May 5]; 40(4): 1212– 8. Available from:
Cancer
Incidence of cancer in Kerala 250 204 200 Per 100, 000 167 150 132 123 males 97 92 100 females 50 0 Kerala (1) India (2) World (2) 1. Three Year Report of PBCR 2009 -2011 [Internet]. [cited 2015 Apr 28]. Available from: http: //www. ncrpindia. org/ALL_NCRP_REPORTS/PBCR_REPORT_2009_2011/ALL_CONTENT/Printed_Ver sion. htm 2 GLOBOCAN Fact Sheets by Population [Internet]. [cited 2015 Apr 27]. Available from:
Trend in incidence of cancer in Kerala Thiruvananthapuram 140 109. 2 96. 6 87. 8 81. 1 87. 1 80 120 80 60 40 115. 9 80 80. 4 118. 5 116. 6 100 80. 4 99. 4 102. 6 76 76. 3 91. 6 60 40 20 20 females Males 11 20 09 - 07 20 05 - 02 19 98 - 97 19 93 - 92 19 91 - males 92 0 0 19 91 - 100 114. 9 140 132. 6 123. 2 In 100, 000 120 132. 3 Kollam Females *CI 5 - Home [Internet]. [cited 2015 Apr 27]. Available from: http: //ci 5. iarc. fr/Default. aspx **Three Year Report of PBCR 2009 -2011 [Internet]. [cited 2015 Apr 28]. Available from: http: //www. ncrpindia. org/ALL_NCRP_REPORTS/PBCR_REPORT_2009_2011/ALL_CONTENT/Printed_Version. htm
Among males lung cancer (14. 5%) was the leading site followed by cancer of oral cavity (14. 2%). Among females cancer of breast (29. 8%) was the leading site of cancer followed by cancer of thyroid( 12. 5%) Children (0 -14 years) constituted 4. 8% of all cancers and leukemia was the predominant cancer among them in both genders ( males 57. 5% and females 47. 5%).
500 0 -100 Kidney etc. Gallbladder etc. Other endocrine Testis Other skin Breast Hodgkin lymphoma rge intestine and anus Thyroid Liver Bladder Eye Leukaemia Lung Bone CNS NHL Nose sinuses etc. Prostate Larynx Pancreas Multiple myeloma Connective tissue Lip oral cavity larynxs Oesophagus Melanoma of skin Stomach Penis % 600 Change in cancer incidence in males from 1991 -92 to 2009 -11 400 300 200 100
0 -50 -100 Multiple myeloma Kidney etc. Corpus uteri Thyroid Gallbladder etc. Hodgkin lymphoma Melanoma of skin Bladder Lung Intestine and anal Breast NHL Ovary etc. Larynx Pancreas CNS Liver Leukaemia Connective tissue Bone Stomach Lip and oral cavity Oesophagus Other skin Nose sinuses etc. Cervix uteri genital organs Eye % Change in cancer incidence in females from 1991 -92 to 2009 -11 350 300 250 200 150 100 50
Chronic Lung diseases
Chronic lung diseases Chronic obstructive pulmonary diseases (COPD) accounted for 5. 2% of the total NCD burden and 12. 2% of the NCD related mortality. In Kerala, 15. 3% of the death were due to respiratory causes of which COPD was the main culprit
Prevalence of chronic respiratory disease in Kerala 12 10 10. 1 % 8 Chronic bronchitis 6 4 3. 1 Asthma 3. 5 1. 9 2 0 Kerala India Jindal SK. Indian Study on Epidemiology of Asthma , Respiratory Symptoms and Chronic Bronchitis ( INSEARCH ) A Multi ‐ Centre Study ( 2006 ‐ 2009 ) Department of Pulmonary Medicine [Internet]. 2010. Available from: http: //icmr. nic. in/final/INSEARCH_Full _Report. pdf
16 12 13. 5 14 11 10 9 12 8 10 8 6 6 5 4 4 1. 9 2 0 3. 7 2. 5 2 0 urban Chronic bronchitis rural Asthma Males Chronic bronchitis Females Asthma
Prevalence of chronic bronchitis Kerala 40. 0 37. 5 35. 0 30. 0 27. 0 25. 0 18. 7 20. 0 15. 0 10. 0 Kerala 14. 6 9. 4 6. 2 5. 0 0. 0 35 -44 45 -54 55 -64 65 -74 75 -84 >84
Chronic Kidney disease Age-adjusted incidence rate of ESRD in India to be 22. 9 per lakh population. � 7500 new chronic kidney diseases every year in Kerala Prevalence in hospitalized patients is 17 % � 33 % in Kerala Main causes are diabetes nephropathy and hypertensive nephrosclerosis *Modi GK, Jha V. The incidence of end-stage renal disease in India: a population-based study. Kidney Int [Internet]. 2006 Dec 25 [cited 2015 May 2]; 70(12): 2131– 3. Available from: http: //dx. doi. org/10. 1038/sj. ki. 5001958 **Singh AK, Farag YMK, Mittal B V, Subramanian KK, Reddy SRK, Acharya VN, et al. Epidemiology and risk factors of chronic kidney disease in India - results from the SEEK (Screening and Early Evaluation of Kidney Disease) study. BMC Nephrol [Internet]. 2013 Jan [cited 2015 Apr 22]; 14(1): 114. Available from: http: //www. biomedcentral. com/1471 -2369/14/114 ***Rajapurkar MM, John GT, Kirpalani AL, Abraham G, Agarwal SK, Almeida AF, et al. What do we know about chronic kidney disease in India: first report of the Indian CKD registry. BMC Nephrol [Internet]. 2012 Jan [cited 2015 Apr 17]; 13: 10. Available from: http: //www. pubmedcentral. nih. gov/articlerender. fcgi? artid=3350459&tool=pmcentrez&rendertype=abstract
Diabetes
Age-standardized prevalence of diabetes, 2014
Comparison of current age standardized prevalence of diabetes in above 18 years Age standardized prevalence of diabetes among >18 years 16 14. 8 14 12 10 9. 5 9 India world 8 6 4 2 0 Kerala Thankappan KR, Shah B, Mathur P, Sarma PS, Srinivas G, Mini GK, et al. Risk factor profile for chronic noncommunicable diseases: Results of a community-based study in Kerala, Indian J Med Res. 2010; 131(1): 53 – 63.
Diabetes in Kerala over last 25 year
Prevalence of diabetes (%) 25 20. 6 20 15 20 14. 8 15 10 10 5 5 0 0 Urban Rural 17. 8 14. 3 Males Females Thankappan KR, Shah B, Mathur P, Sarma PS, Srinivas G, Mini GK, et al. Risk factor profile for chronic non-communicable diseases: Results of a community-based study in Kerala, Indian J Med Res. 2010; 131(1): 53– 63.
Prevalence of diabetes in age group 30 -40 years 13. 1 14 12 10 8 6 4 3. 4 2 0 1999 2010 Kutty VR, Soman CR, Joseph A, Pisharody R, Vijayakumar K. Type 2 diabetes in southern Kerala: variation in prevalence among geographic divisions within a region. Natl Med J India [Internet]. Jan [cited 2015 Apr 23]; 13(6): 287– 92 Jose R, Manojan KK, Augustine P, Nujum ZT, Althaf A, Haran JC, et al. Prevalence of Type 2 Diabetes and Prediabetes in Neyyattinkara Taluk of South Kerala [Internet]. Academic Medical Journal of India. 2013 [cited 2015 Apr 23]. Available from: http: //medicaljournal. in/prevalence-of-type-2 -diabetes-prediabetes
Detection , treatment and control of diabetes in Kerala 80 72 73 71 70 68 65 70 60 50 All 40 males 31 30 females 22 20 15 10 0 Aware Treated Controled
Hypertension
Age standardized prevalence of hypertension in above 18 years % 30 28 25 23 22 India World 20 15 10 5 0 Kerala Thankappan KR, Shah B, Mathur P, Sarma PS, Srinivas G, Mini GK, et al. Risk factor profile for chronic noncommunicable diseases: Results of a community-based study in Kerala, Indian J Med Res. 2010; 131(1): 53 – 63.
Trend in prevalence of hypertension in Kerala (above 30 year of age)
Burden of hypertension The prevalence was almost same in both genders as well as in urban and rural areas. The burden of hypertension increases with age � studies reports that 60 -80% of people above age of 60 were hypertensive proportion of people in pre-hypertension stage is also very high (upto 40%).
Detection , treatment and control of hypertension in Kerala 50 44 45 40 35 30 37 30 25 33 27 All 21 males 20 females 15 9 10 11 6 5 0 Aware Treated Controlled
Status of risk factors in Kerala
Tobacco use in Kerala 40 34 35 30 25 26 21 Kerala 20 13 15 India 14 11 10 5 0 Tobacco Smoked Smokeless International Institute for Population Sciences. Ministry of Health and Family Welfare. Government of India. Global adult tobacco survey India 2009 2010. Global adult tobacco survey India 2009 -10. Mumbai: International Institute for
Tobacco use in Kerala 40 35 35 28 30 25 Males 20 10 Females 13 15 8. 5 5 0 0 Tobacco Smoked Smokeless International Institute for Population Sciences. Ministry of Health and Family Welfare. Government of India. Global adult tobacco survey India 2009 2010. Global adult tobacco survey India 2009 -10. Mumbai: International Institute for
Smoking in Kerala over past 30 years Current smoking in males Current smoking 25 20 60 21. 9 50 17. 8 13. 3 13 10 5 0 1987 40 R 2 = 0. 9748 % % 15 30 50 43 38. 7 2828 20 10 1997 2007 year 2017 0 1983 R 2 = 0. 7959 1993 2003 2013 Year
Alcohol use in Kerala Current use of alcohol ( within one month ) was seen in 20 -23% of males aged above 15 years in Kerala. Annual Per capita alcohol consumption was 10. 2 L which is comparable to national average (11. 4 L) ICMR. NON-COMMUNICABLE DISEASE RISK FACTORS SURVEY India Phase - I 2008 -09. 2007.
Obesity The prevalence of overweight and obese (BMI>=25) in the state was estimated to around 30 % and is showing an upward trend. Central obesity (based on waste circumference, WC) is more prevalent affecting as much as 40% of the population. Obesity/overweight was more common in females (BMI-38%, WC-52%) when compared to males (BMI -24%, WC-26%).
Hyper-cholestrolemia 70 60 62 57 51 50 41 37 40 all 30 30 males females 20 13. 9 10 0 Thankappan et al Vijayakumar etal INDIAB study
Dietary practice in Kerala Major cooking oil 100 90 80 70 60 50 40 30 20 10 0 87. 9 9. 9 Coconut oil palm oil 3. 5 Oil rich in unsaturated fatty acid
Dietary practice in Kerala
Physical inactivity Low level of physical activity was seen in 75% of the population as per the STEPS survey report. Lack of physical activity was more common in women when compared to men. The low level of physical activity was same in both urban and rural areas as well as across different age groups
Is there a solution?
Prevention oriented health care
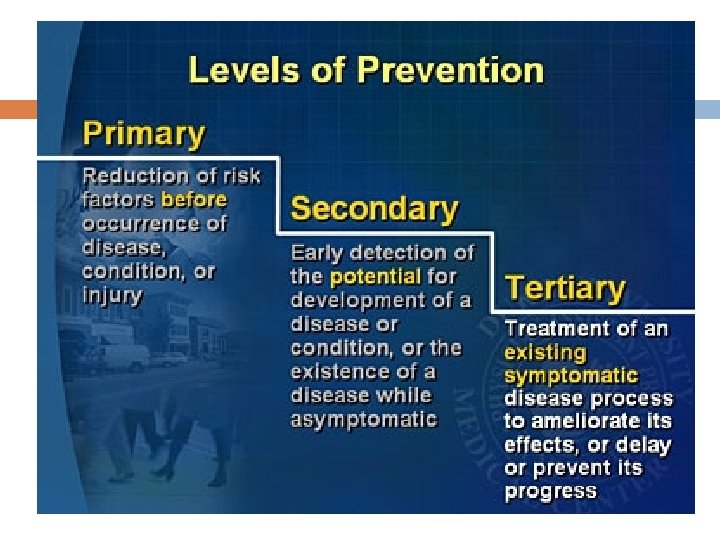
Levels of prevention
Levels of prevention
Secondary and tertiary prevention Primodial prevention Primary prevention
Primary prevention Promoting healthy diet Promoting recreational physical activity Avoiding tobacco , alcohol Stress management
Primary prevention Health promotion � Health education � Environmental modification � Lifestyle and behavioral changes Specific protection � Legislation and its proper implementation � Immunization
Secondary prevention Early diagnosis � Screening Proper treatment