Press release from ERL 2 readings 1 2


 OMI s h")


")
")


 of ship presence")


- Slides: 21
Press release from ERL: 2 readings 1. 2.
Motivation Ships are strong sources of greenhouse gases and air pollutants: • 3% of global CO 2 emissions • ± 13% of global NOx emissions (5 -20%) • ± 12% of global SO 2 emissions IMO, 2014
Motivation Shipping sector shows a degree of awareness • Claims to be a relatively clean mode of transportation • Reduce emissions by speed reductions and other measures Ship CO 2 efficiencies
Motivation Legal framework to reduce ship emissions slow in making IMO initiatives to implement NECA and SECA 2000 2011 Implemented in US waters in 2016
Very few measurements on open sea OMI overpass time: 13: 40 hrs
Estimating NOx emissions from NO 2 observations • Lifetime of NO 2 at noon is generally short (few hours) • Close relationship between NOx emissions and local NO 2 columns • Simple mass balance approach (Martin et al. [2003]): NO 2 column measured by OMI Emission inventory used in CTM NO 2 column simulated by CTM Practical difficulties: 1. Standard CTM chemistry not appropriate for plumes 2. Emissions may be misplaced (Eapriori) 3. Eapriori: NCTM varies in time and space (non-linear local chemistry) 4. Smearing, weak signal (poster Huan Yu)
1. Account for plume chemistry in GEOS-Chem plume-in-grid approach for ship emissions OH NO 2 Higher OH in early stages of the plume t Improved simulations with plume-in-grid show 50% lower NOx concentrations than instant dilution! Vinken et al. , ACP, 2011
2. Detecting emission patterns with OMI (3. 7 Tg NO 2) OMI s h EMEP ows that are m emission s ispla ced (2. 5 Tg NO 2)
3. Account for non-linear chemistry in providing constraints on emissions Model Satellite 2 1 3 3 4 4 β describes local, monthly mean clear-sky sensitivity of NO 2 columns to (changes in) NOx emissions (Lamsal) For clear-sky European Seas: β = 0. 5 -1. 0 (0. 7)
4. Avoid smearing Select days without clouds and without outflow of continental pollution
NOx emission estimates ships in Europe: 2005 before OMI top down inventory (0. 9 Tg N/yr)
Changes in 2005 -2012 ship NOx emissions over European Seas (in Tg. N yr-1) • 4 lanes represent 30% of European shipping NOx emissions • Estimates mostly based on Spring & Summer observations • Increase from 2005 -2008, then decrease in 2009
NOx pollution from ships increasing in relevance Annual changes in NOx emissions (2005 -2008) Changes inferred from OMI by Curier et al. [2014] Changes inferred from OMI in this work
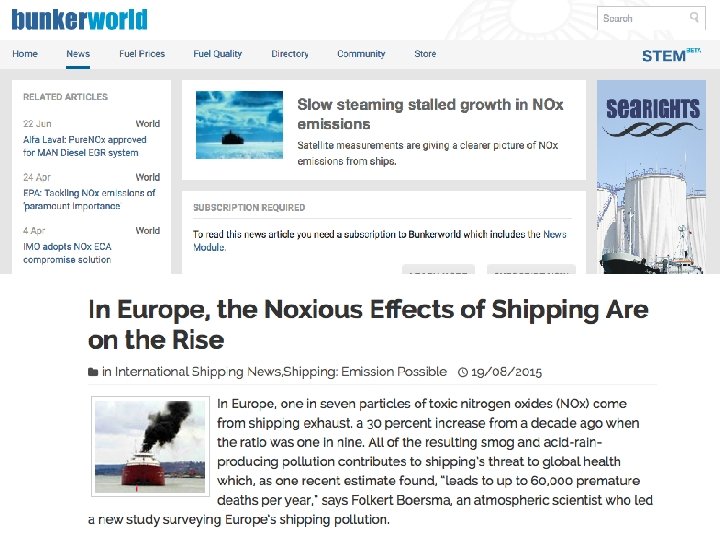
Comparison to changes in economic indicators No net change in European ship NOx emissions between 2005 and 2012 Increase in share of shipping sector to NOx emissions from 1 in 9 to 1 in 7
Slow steaming? Economic recession in Autumn 2008; shipping sector responded • Cutting costs by saving on fuel • Reducing overcapacity (less demand) Slow steaming: • Reducing vessel speed from 20 -25 knots to 16 -19 knots • This would reduce CO 2 and NOx emissions
Slow steaming observed from space 1. Long-term data set (1992 -2012) of ship presence detected by satellite altimeter instruments 2. Registration of the number of ships passing the Suez Canal
Slow steaming from space: Mediterranean Sea
Slow steaming from space • Number of ships through the Suez Canal relatively constant • Number of ships detected over Mediterranean increases • Indication for a longer residence time in the Mediterranean • Ratio Suez : altimeter ~ ship speed • Ratio OMI NOx : altimeter ~ per ship emission factor Normal (20 -25 knots; 37 – 46 km/hr) Slow steaming (14 -20 knots; 25 – 37 km/hr)
Summary • • OMI allows detection of ship emissions on open sea European ship NOx emissions increased from 2005 -2008 Back at their 2005 levels in 2012 (in line with trade) Because land-based emissions decreased by 25%, ship emissions now make up a larger fraction (1 in 7) of European NOx emissions • Direct evidence of slow steaming from altimeter in combination with Suez Canal passages • Ship speeds reduced by 30% in the Mediterranean • Accompanied by large NOx emission reductions 21 st century • ECA’s will be enforced in 2016 • Demand will increase • Oil will still be used as fuel