Presenting Statistical Data The heights in centimeters of
 of a class of 10 th grade")
 of a class of 10 th grade")
 of a class of 10 th grade")
 of a class of 10 th grade")
 of a class of 10 th grade")
 of a class of 10 th grade")
 of a class of 10 th grade")
 of a class of 10 th grade")
 of a class of 10 th grade")
 of a class of 10 th grade")
 of a class of 10 th grade")


")


 The accompanying box-andwhisker plot represents the cost, in dollars, of")


 The stem-and-leaf plot to the right shows the number of")
 The stem-and-leaf plot to the right shows the number of")

")


 Very")
 A set of student test scores has a mean of")
 Out of 300 high school students with normally distributed heights,")


 Draw a scatter plot of the data found in the table to")


 Using the scatter plot created for experience and salary, describe the nature")
 Using the scatter plot created for experience and salary, describe the nature")
 Suppose x represents experience and y represents salary. Determine the correlation coefficient")


 Using part (d), determine an equation for the regression line of the")
 Find the expected salary of someone who works for 45 years.")

 Performance Task due Monday!")


 You go to Best Buy to purchase a new")
 In how many ways can a 5 -question multiple")
 How many odd 2 -digit whole numbers are less")
: To get to school, Rita can either ride")


 How many positive integers less than 100 can be")
 How many license plates of 3 symbols (letters and")
 How many seven-digit phone numbers can be created if")

")
 Which of the following represents ? A) B) C)")
 What is the standard form of the conic below?")
 Find the first 3 terms in the expansion of:")
 Find the sixth term of the sequence: A) B)")
 Solve for x: A) B) C) D)")
 Solve for x: A) B) C) D)")
 Find an explicit formula for the sequence: A) B)")


 Suppose a password requires three distinct letters. Find the number of")


")


 There are seven people who meet for the first time at")
 At a particular restaurant, you must choose two different side dishes")
 Brett has ten distinct t-shirts. He is planning on going on")
 How many three-topping pizzas can be ordered from the list of")


 Pg. 740 ~ 1 -16 (all)")
 Review: How many ways can the letters in WORD be rearranged? Does")
 In how many ways can the letters in DAD be rearranged? a)")
 Permutations of n Elements (with repeating elements) If a set of n")
 Ex 1) Find the number of ways the letters in the word")
 Ex 2) There are 6 plain towels on a laundry line. 3")

")


 For the rolling of a die, specify: a)")
 Suppose you roll two dice, one red and")
 Suppose you roll two dice, one red and")
 Suppose you roll two dice, one red and")


 will occur, given a sample space with")
 A die is rolled. Find the probability of each event. a)")
 There are 12 food items wrapped in identical aluminum foil packaging.")
 There are 3 red, 2 blue, and 3 yellow marbles in")

 Pg. 748 ~ 1 -8 (all)")
- Slides: 122
Presenting Statistical Data The heights (in centimeters) of a class of 10 th grade students is shown to the right. A frequency distribution is a table that shows how many times each data value appears in a set.
Presenting Statistical Data The heights (in centimeters) of a class of 10 th grade students is shown to the right. Part 1 – Create a frequency distribution.
Presenting Statistical Data The heights (in centimeters) of a class of 10 th grade students is shown to the right. A histogram can be used to display the frequency of data in certain convenient intervals. It does not display the individual data.
Presenting Statistical Data The heights (in centimeters) of a class of 10 th grade students is shown to the right. Part 2 – Create a histogram.
Presenting Statistical Data The heights (in centimeters) of a class of 10 th grade students is shown to the right. Part 3 – Use the histogram to answer the questions: • What interval contains the most students? • What interval contains the fewest students? • How many students are 175 cm or taller? • How many students are less than 170 cm tall?
Presenting Statistical Data The heights (in centimeters) of a class of 10 th grade students is shown to the right. A stem-and-leaf plot displays the actual data as the first part of the number (stem) and last digit (leaf).
Presenting Statistical Data The heights (in centimeters) of a class of 10 th grade students is shown to the right. Part 4 – Create a stem-andleaf plot.
Presenting Statistical Data The heights (in centimeters) of a class of 10 th grade students is shown to the right. Part 5 - Numbers used to describe a set of data are called statistics. Three different statistics used to measure the central tendency of a distribution are mean, median, and mode.
Presenting Statistical Data The heights (in centimeters) of a class of 10 th grade students is shown to the right. The mode is the number that occurs most frequently. Find the mode of this data.
Presenting Statistical Data The heights (in centimeters) of a class of 10 th grade students is shown to the right. The median is the middle number of the ordered set of data. Find the median of this data.
Presenting Statistical Data The heights (in centimeters) of a class of 10 th grade students is shown to the right. The mean is the arithmetic average of the numbers. Find the mean of this data.
Presenting Statistical Data Part 6 - Use the distribution of the number of sit-ups performed by students in a PE class in the stemand leaf plot to: Find the mode: Find the median: Find the mean:
Learning Log Summary LT 1 – I can display data using a frequency distribution, histogram, and stem-and-leaf plot and compute the measures of central tendency. A histogram / stem-and-leaf plot is… The measures of central tendency are…
Closure Homework pg. 711 ~ 1 -13 (All)
Presenting Statistical Data The accompanying stem-and-leaf plot represents Ben’s test scores for the year. Find the median of the data: Find the median of the lower half of the data: Find the median of the upper half of the data:
Analyzing Statistical Data The accompanying stem-and-leaf plot represents Ben’s test scores for the year. Dispersion describes how spread a data set is.
Analyzing Statistical Data The accompanying stem-and-leaf plot represents Ben’s test scores for the year. One measure of dispersion is the range. It is the distance between the largest and smallest numbers in the data set. The range of Ben’s test scores is…
Analyzing Statistical Data The accompanying stem-and-leaf plot represents Ben’s test scores for the year. A box-and-whisker plot shows the median, first and third quartiles, and the range of a distribution.
Analyzing Statistical Data Ex) The accompanying box-andwhisker plot represents the cost, in dollars, of twelve CD’s. Which cost is the upper quartile? What is the median? How many CDs cost between $14. 50 and $26? What is the range of the costs? Which cost represents the 100 th percentile? How many CDs cost less than $14. 50?
Analyzing Statistical Data The average number of hours of sleep of several people is shown in the table. Measures of dispersion describe how scattered a set of data is. Along with a measure of central tendency, you can provide a good description of a data set.
Analyzing Statistical Data The average number of hours of sleep of several people is shown in the table. If are n numbers and M is their mean, then the variance of the distribution is…
Analyzing Statistical Data The average number of hours of sleep of several people is shown in the table. Ex) Find the variance of the distribution of the number of hours slept by participants in the table.
Analyzing Statistical Data The average number of hours of sleep of several people is shown in the table. The standard deviation is the square root of the variance.
Analyzing Statistical Data Ex) The stem-and-leaf plot to the right shows the number of yards gained by several students on the football team. a) Find the mean of the distribution and explain its meaning.
Analyzing Statistical Data Ex) The stem-and-leaf plot to the right shows the number of yards gained by several students on the football team. b) Find the standard deviation of the distribution.
Learning Log Summary LT 2 – I can compute measures of dispersion and use them describe a distribution. A measure of dispersion tells you… To find the variance and standard deviation…
Closure Homework pg. 717 ~ 1 -13 (All)
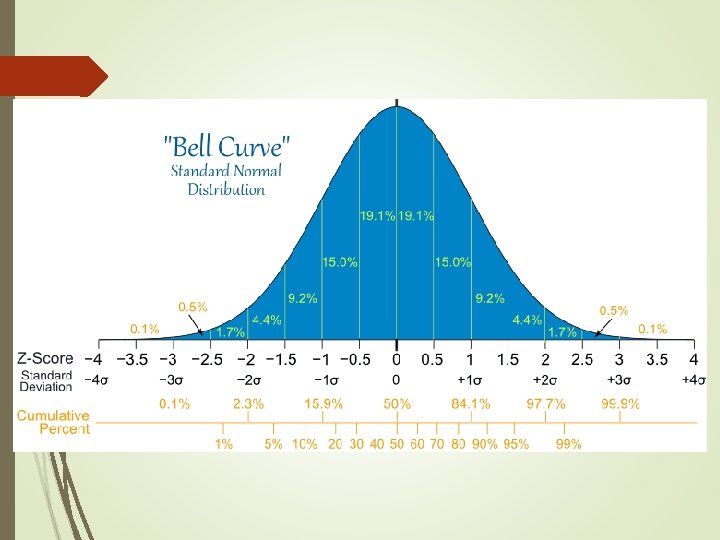
The Normal Distribution Data can be distributed in different ways:
The Normal Distribution When it is distributed around a central value:
The Normal Distribution
The Normal Distribution The data is distributed in the following way:
Likely to be within 1 standard deviation (68 out of 100 should be) Very likely to be within 2 standard deviations (95 out of 100 should be) Almost certainly within 3 standard deviations (997 out of 1000 should be)
The Normal Distribution Ex) A set of student test scores has a mean of 75 points and a standard deviation of 8 points. What percentage of students scored between 67 and 83? 19 out of 20 students has a score in between what two numbers? What percentage of students scored below a 59?
The Normal Distribution Ex) Out of 300 high school students with normally distributed heights, 95% of students are between 61 and 73 inches tall. How many students are between 64 and 70 in tall? What percentage of students are taller than 70 in? How many students are less than 61 in tall?
Ex. 1: Understanding Mean & Standard Deviation 1. Which normal curve has a greater mean? 2. Which normal curve has a greater standard deviation?
The Normal Distribution Consider the normal curves shown below. Which normal curve has the greatest mean? Which normal curve has the greatest standard deviation? Justify your answers.
Learning Log Summary LT 3 – I can recognize a normal distribution and use it to determine the percentage of the data that falls within a given range. A normal distribution is… To find the percentage of data within a certain number of standard deviations of the mean…
Closure Homework Normal Distribution Worksheet
Correlation A survey of several professionals in a neighborhood asked the number of years they have been working and what their current salary is. a)How do you expect years of experience to influence salary?
Correlation b) Draw a scatter plot of the data found in the table to the right. Experience in Years Salary (in thousands) 0 5 20 25 10 35 5 15 10 30 20 40 60 50 50 55 30 50 30 70
Correlation A statistic called the correlation coefficient is used to characterize how closely the points in a scatter plot cluster about a line. Given a set of ordered pairs, the correlation coefficient, denoted by ‘r’, is: where and are the mean and S. D. of the x-values, and are the mean and S. D. of the y-values, And is the mean of the products of the ordered pairs.
Correlation A statistic called the correlation coefficient is used to characterize how closely the points in a scatter plot cluster about a line.
Correlation c) Using the scatter plot created for experience and salary, describe the nature of the correlation.
Correlation c) Using the scatter plot created for experience and salary, describe the nature of the correlation.
Correlation d) Suppose x represents experience and y represents salary. Determine the correlation coefficient of the ordered pairs from the table given that , and .
Correlation When correlation between two variables is high, you can draw a regression line, which is a line that best fits the known values of the variables. An example is shown below:
Correlation The regression line contains the point and has a slope of .
Correlation e) Using part (d), determine an equation for the regression line of the salary data.
Correlation f) Find the expected salary of someone who works for 45 years.
Learning Log Summary LT 4 – I can draw a scatterplot of data and use it to determine the correlation coefficient and regression line that models the data. A correlation coefficient is… To find the correlation coefficient and regression equation…
Closure Homework Pg. 727 ~ 1 -8 (all) Performance Task due Monday!
Fundamental Counting Principle Intro: You are at an awards dinner and are about to place your food order. The card placed at your seat describes the menu options as follows: How many possible dinner orders are there? Explain or show you know.
Fundamental Counting Principle If there are “m” ways to make a first choice and “n” ways to make a second choice, etc. then there are m· n ways to make both choices.
Fundamental Counting Principle Ex 1) You go to Best Buy to purchase a new television. You have the following choices: LCD or plasma; screen size 27”, 32”, 36”, 41”, 51”, or 63” and manufacturer Sony, Vizio or Phillips. How many different televisions does the store have to offer?
Fundamental Counting Principle Ex 2) In how many ways can a 5 -question multiple choice quiz (with options A-D for each choice) be answered if it is ok to leave questions blank?
Fundamental Counting Principle Ex 3) How many odd 2 -digit whole numbers are less than 70?
Fundamental Counting Principle Intro (Pt 2): To get to school, Rita can either ride her bike or take the bus. There are three possible bus routes and two routs she knows on her bike. How many ways can she get to school? Explain or show you know.
Fundamental Counting Principle Mutually exclusive events are events that do not influence or cause one another. They can not happen simultaneously. For example, flipping a coin and rolling a die are mutually exclusive. Picking a card from a deck and picking another card without replacing the first are not mutually exclusive events.
Fundamental Counting Principle If the possibilities being counted can be grouped into mutually exclusive cases, then the total number of possibilities is the sum of the number of possibilities in each case.
Fundamental Counting Principle Ex 4) How many positive integers less than 100 can be written using the digits 6, 7, 8, and 9?
Fundamental Counting Principle Ex 5) How many license plates of 3 symbols (letters and digits) can be made using at least one letter?
Fundamental Counting Principle Ex 6) How many seven-digit phone numbers can be created if the first digit must be 8, the second digit must be 5, and the third digit must be 2 or 3?
Learning Log Summary LT 5 – I can use the Fundamental Counting Principle to determine the number of ways various choices can be made. The Fundamental Counting Principle says… If there are m ways to make a first selection…
Closure Homework Pg. 732 ~ 1 -10 (all)
Q 3 Benchmark Warm-Up 1) Which of the following represents ? A) B) C) D)
Q 3 Benchmark Warm-Up 2) What is the standard form of the conic below? A) B) C) D)
Q 3 Benchmark Warm-Up 3) Find the first 3 terms in the expansion of: A) B) C) D)
Q 3 Benchmark Warm-Up 4) Find the sixth term of the sequence: A) B) C) D)
Q 3 Benchmark Warm-Up 5) Solve for x: A) B) C) D)
Q 3 Benchmark Warm-Up 6) Solve for x: A) B) C) D)
Q 3 Benchmark Warm-Up 7) Find an explicit formula for the sequence: A) B) C) D)
Fundamental Counting Principle Review
Fundamental Counting Principle Review The store at your school wants to stock sweatshirts that come in four sizes (small, medium, large, xlarge) and in two colors (red and white). How many different types of sweatshirts will the store have to stock?
Fundamental Counting Principle Review
Learning Log Summary LT 5 – I can use the Fundamental Counting Principle to determine the number of ways various choices can be made. The Fundamental Counting Principle says… If there are m ways to make a first selection…
Permutations An arrangement of four digits with no repeats is an example of a permutation. A permutation is an arrangement in a certain order (a sequence).
Permutations How many ways can you arrange “n” items? “n factorial” How many ways can you arrange 5 books on a shelf?
Permutations Ex 1) Suppose a password requires three distinct letters. Find the number of permutations for the three letters in the code, if the letters may not be repeated.
Permutations
Permutations
Permutations Now imagine you are making a passcode out of different characters. There are “n” options, and you need to create a password that is “r” items long. Write an expression for the number of passcodes you could create:
Permutations To find the number of permutations of n objects, taken r at a time:
Permutations
Learning Log Summary LT 6 – I can find the number of permutations of the elements of a set and apply it to real-world problems. A permutation is… To find the number of permutations of n objects, taken r at a time…
Closure Homework Pg. 732 ~ 1 -10 (all)
Combinations Intro: Seven speed skaters are competing in an Olympic race. The first-place skater earns the gold medal, the second-place skater earns the silver medal, and the third-place skater earns the bronze medal. In how many different ways could the gold, silver, and bronze medals be awarded? The letters A, B, C, D, E, F, and G will be used to represent these seven skaters. a) How can we determine the number of different possible outcomes? How many are there?
Combinations Intro: Seven speed skaters are competing in an Olympic race. The first-place skater earns the gold medal, the second-place skater earns the silver medal, and the third-place skater earns the bronze medal. In how many different ways could the gold, silver, and bronze medals be awarded? The letters A, B, C, D, E, F, and G will be used to represent these seven skaters. b) Now consider a slightly different situation. Seven speed skaters are competing in an Olympic race. The top three skaters move on to the next round of races. How many different "top three" groups can be selected? How is this situation different from the first situation? Would you expect more or fewer possibilities in this situation? Why?
Combinations A permutation is… A combination is…
Combinations To find the number of combinations of n objects, taken r at a time: Consider the figure skating problem, and use the formula to find the number of ways the “top three” can be formed.
Combinations
Combinations
Combinations Ex 3) There are seven people who meet for the first time at a meeting. They shake hands with each other and introduce themselves. How many handshakes have been exchanged?
Combinations Ex 4) At a particular restaurant, you must choose two different side dishes to accompany your meal. If there are eight side dishes to choose from, how many different possibilities are there?
Combinations Ex 5) Brett has ten distinct t-shirts. He is planning on going on a short weekend trip to visit his brother in college. He has enough room in his bag to pack four t-shirts. How many different ways can he choose four t-shirts for his trip?
Combinations Ex 6) How many three-topping pizzas can be ordered from the list of toppings below? Did you calculate the number of permutations or the number of combinations to get your answer? Why did you make this choice? sausage pepperoni meatball onions olives pineapple ham green peppers mushrooms bacon spinach hot peppers
Learning Log Summary LT 7 – I can find the number of combinations of the elements of a set and apply it to real-world problems. A combination is… To find the number of combinations of n objects, taken r at a time… The difference between a combination and permutation is…
Combinations and Permutations on the Graphing Calculator
Self-Check 1.
Closure Homework Pg. 737 ~ 1 -14 (all) Pg. 740 ~ 1 -16 (all)
Permutations (Re-Visited) Review: How many ways can the letters in WORD be rearranged? Does this require a combination or permutation? Explain.
Permutations (Re-Visited) In how many ways can the letters in DAD be rearranged? a) Write out the possibilities. b) How many of these permutations are unique?
Permutations (Re-Visited) Permutations of n Elements (with repeating elements) If a set of n element has n 1 elements of one kind alike, n 2 of another kind alike, etc. , then the number of permutations P of the n elements taken n at a time is:
Permutations (Re-Visited) Ex 1) Find the number of ways the letters in the word HUBBUB can be arranged.
Permutations (Re-Visited) Ex 2) There are 6 plain towels on a laundry line. 3 are blue, 2 are red, and 1 is white. Find the number of ways these towels can be arranged on the line.
Learning Log Summary LT 6 – I can find the number of permutations of the elements of a set and apply it to real-world problems. To find the number of permutations of n objects where there are repeated objects…
Closure Homework Pg. 737 ~ 15 -23 (all)
Sample Space and Events A random experiment is an experiment in which you do not necessarily get the same outcome when it is repeated with the same conditions.
Sample Space and Events The sample space of an experiment is the set of all possible outcomes of a random experiment.
Sample Space and Events An event is any subset of the possible outcomes for an experiment.
Sample Space and Events Ex 1) For the rolling of a die, specify: a) The sample space for the experiment. b) The event that you roll a number greater than 2. c) The event that you roll an odd number.
Sample Space and Events Ex 2) Suppose you roll two dice, one red and one blue. An outcome in this experiment can be represented by the ordered pair (r, b) where r is the number showing on the red die and b is the number showing on the blue die. a) How many items are in the sample space? Explain.
Sample Space and Events Ex 2) Suppose you roll two dice, one red and one blue. An outcome in this experiment can be represented by the ordered pair (r, b) where r is the number showing on the red die and b is the number showing on the blue die. b) Specify the event that the red die shows 5.
Sample Space and Events Ex 2) Suppose you roll two dice, one red and one blue. An outcome in this experiment can be represented by the ordered pair (r, b) where r is the number showing on the red die and b is the number showing on the blue die. c) Specify the event that the sum of the dice is 7.
Learning Log Summary LT 8 – I can identify the sample spaces and events for random experiments. The sample space of an experiment is… An event is…
Probability Intro: If you roll a 6 -sided die, what are the chances you will roll a 5? Explain how you know.
Probability The probability that an event (E) will occur, given a sample space with n items, is:
Probability Ex 1) A die is rolled. Find the probability of each event. a) Event A: The number showing is less than 5. b) Event B: The number showing is between 2 and 6. c) Event C: The number showing is even.
Probability Ex 3) There are 12 food items wrapped in identical aluminum foil packaging. 9 of them are cheeseburgers and 3 of them are hamburgers. If two items are selected at random, find the probability of each event. Brainstorming Questions… a) Event A: Both items are hamburgers. b) Event B: One item will be a hamburger and one will be a cheeseburger.
Probability Ex 4) There are 3 red, 2 blue, and 3 yellow marbles in a bag. Jeff randomly selects one, returns it to the bag, then randomly selects another. Find the probability of each event. Brainstorming Questions… a) Event A: The first marble is blue and the second is yellow. b) Event B: Both marbles selected are red.
Learning Log Summary LT 9 – I can calculate the probability that an event will occur based on the size of the sample space. Probability describes… The probability of an event can be calculated by…
Closure Homework Pg. 744 ~ 1 -6 (all) Pg. 748 ~ 1 -8 (all)