
Presented by Tonya Drake Vice President for Student
Presented by Tonya Drake Vice President for Student Success Shoreline Community College August 24 -25, 2010 Trends and Analysis
General Expectations Information is provided for general knowledge and understanding Information has limitations on scope and time for presentation Intended to be informative and conversational Additional information is available and can be provided as follow up Different data sets were used to best illustrate content per topic area
Enrollment Management
Overview Enrollment Management Framework Enrollment Projections FTE Targets 5 Star Consortium Comparisons
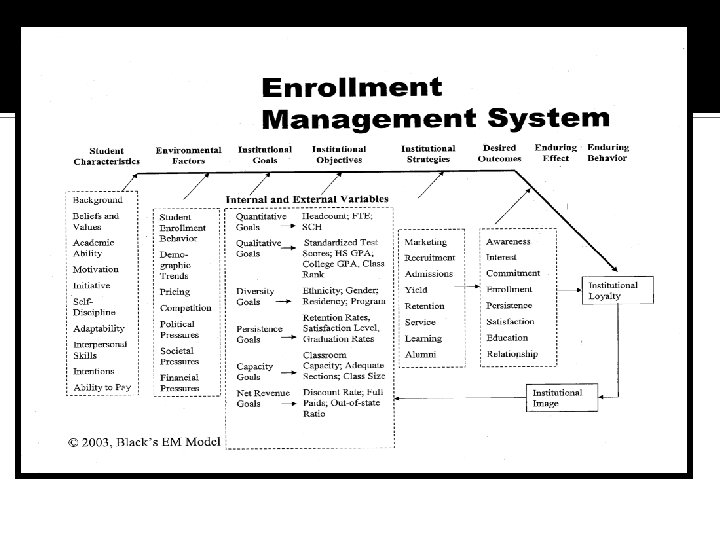
Enrollment Management Framework
2013 Enrollment Forecast
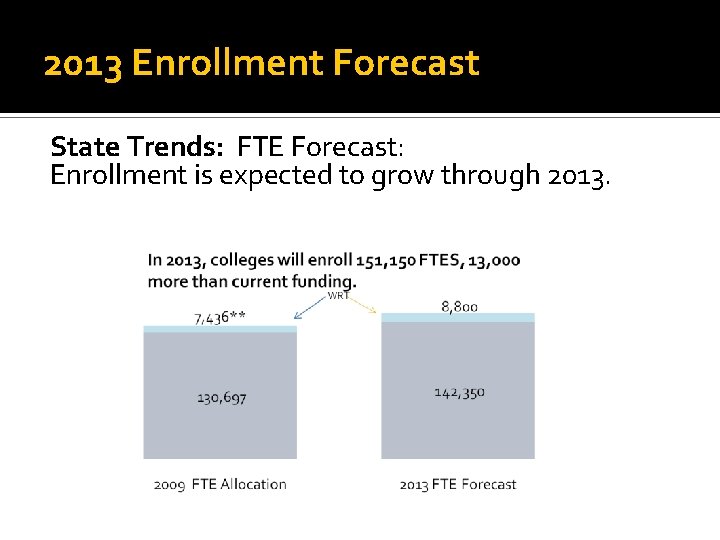
2013 Enrollment Forecast State Trends: FTE Forecast: Enrollment is expected to grow through 2013.
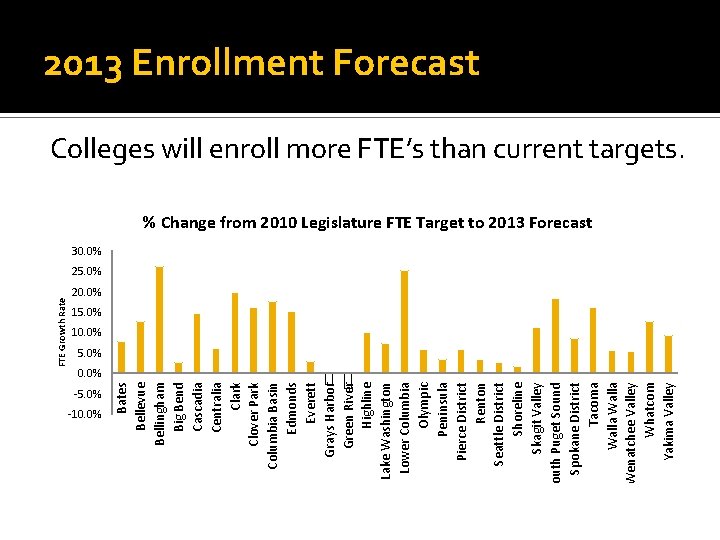
-5. 0% -10. 0% Bates Bellevue Bellingham Big Bend Cascadia Centralia Clark Clover Park Columbia Basin Edmonds Everett Grays Harbor Green River Highline Lake Washington Lower Columbia Olympic Peninsula Pierce District Renton Seattle District Shoreline Skagit Valley South Puget Sound Spokane District Tacoma Walla Wenatchee Valley Whatcom Yakima Valley FTE Growth Rate 2013 Enrollment Forecast Colleges will enroll more FTE’s than current targets. % Change from 2010 Legislature FTE Target to 2013 Forecast 30. 0% 25. 0% 20. 0% 15. 0% 10. 0% 5. 0% 0. 0%
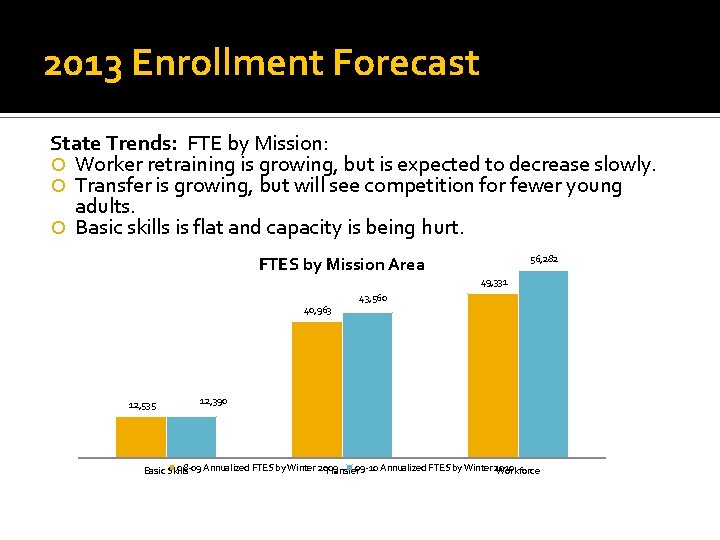
2013 Enrollment Forecast State Trends: FTE by Mission: Worker retraining is growing, but is expected to decrease slowly. Transfer is growing, but will see competition for fewer young adults. Basic skills is flat and capacity is being hurt. 56, 282 FTES by Mission Area 49, 331 40, 963 12, 535 43, 560 12, 390 08 -09 Annualized FTES by Winter 2009 Basic Skills Transfer 09 -10 Annualized FTES by Winter 2010 Workforce
2013 Enrollment Forecast Population by Age: Ages 18 -19 will decline for most of the coming decade reversing nearly two decades of growth. Ages 20 -24 will continue to grow through the 20112013 biennium, but at a slower rate than the past decade, then will decline in size until the close of this decade. Ages 25 -29 will continue to grow to near the end of the decade but at a slower rate than the past five years. Ages 30 -34 will grow in the next decade similar to the growth in the 1990’s and in significant contrast to the past 15 years.
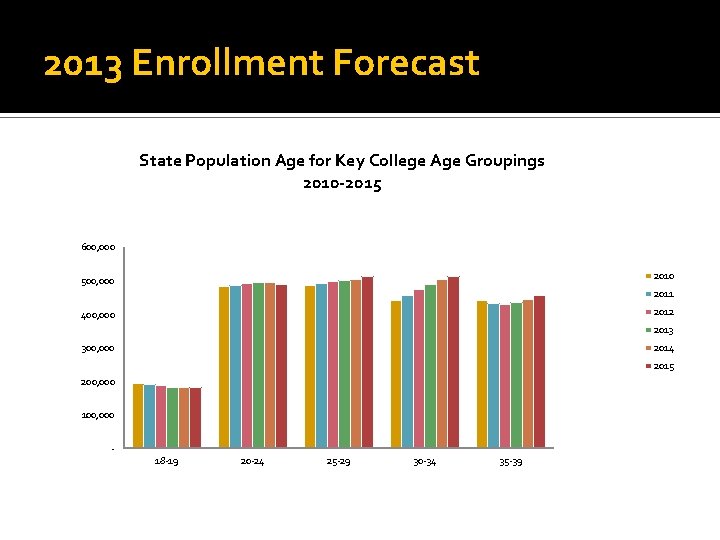
2013 Enrollment Forecast State Population Age for Key College Age Groupings 2010 -2015 600, 000 2010 500, 000 2011 2012 400, 000 2013 300, 000 2014 2015 200, 000 18 -19 20 -24 25 -29 30 -34 35 -39
FTE Targets
FTE Targets Overview Annual FTE targets are set by the State Board for Community and Technical Colleges (SBCTC). Each college receives a budget allocation which includes an annualized FTE number or target. Allocation for this year includes a base (general & high demand) plus growth targets. Each college is expected to meet a threshold of 96% of the annual target (rebased using a biennial average).
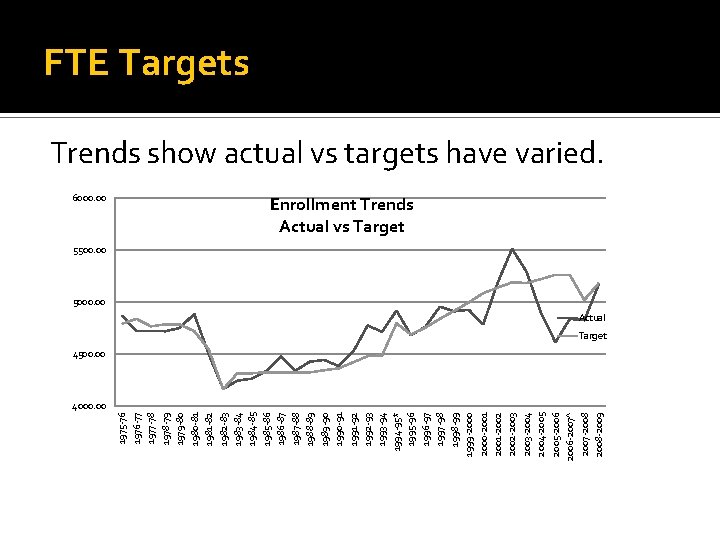
6000. 00 1975 -76 1976 -77 1977 -78 1978 -79 1979 -80 1980 -81 1981 -82 1982 -83 1983 -84 1984 -85 1985 -86 1986 -87 1987 -88 1988 -89 1989 -90 1990 -91 1991 -92 1992 -93 1993 -94 1994 -95* 1995 -96 1996 -97 1997 -98 1998 -99 1999 -2000 -2001 -2002 -2003 -2004 -2005 -2006 -2007^ 2007 -2008 -2009 FTE Targets Trends show actual vs targets have varied. Enrollment Trends Actual vs Target 5500. 00 5000. 00 Actual Target 4500. 00 4000. 00
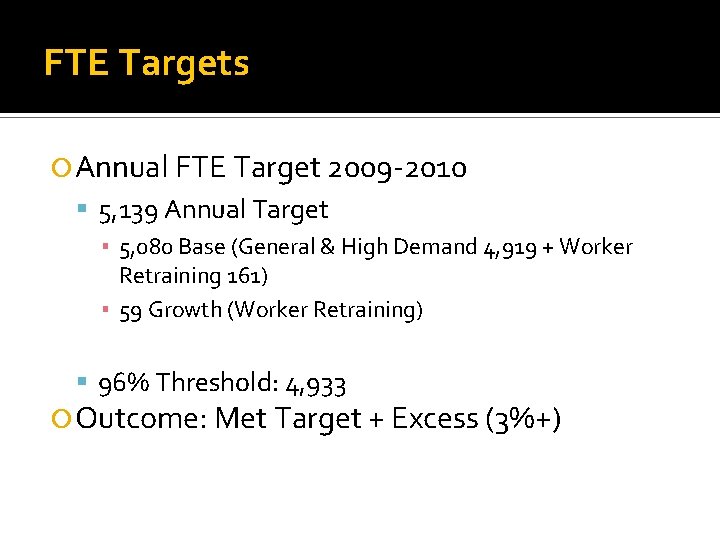
FTE Targets Annual FTE Target 2009 -2010 5, 139 Annual Target ▪ 5, 080 Base (General & High Demand 4, 919 + Worker Retraining 161) ▪ 59 Growth (Worker Retraining) 96% Threshold: 4, 933 Outcome: Met Target + Excess (3%+)
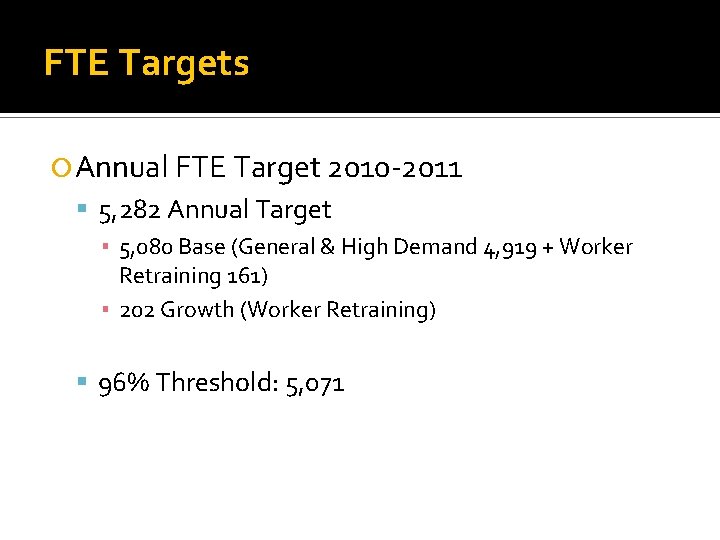
FTE Targets Annual FTE Target 2010 -2011 5, 282 Annual Target ▪ 5, 080 Base (General & High Demand 4, 919 + Worker Retraining 161) ▪ 202 Growth (Worker Retraining) 96% Threshold: 5, 071
Five Star Consortium Comparisons
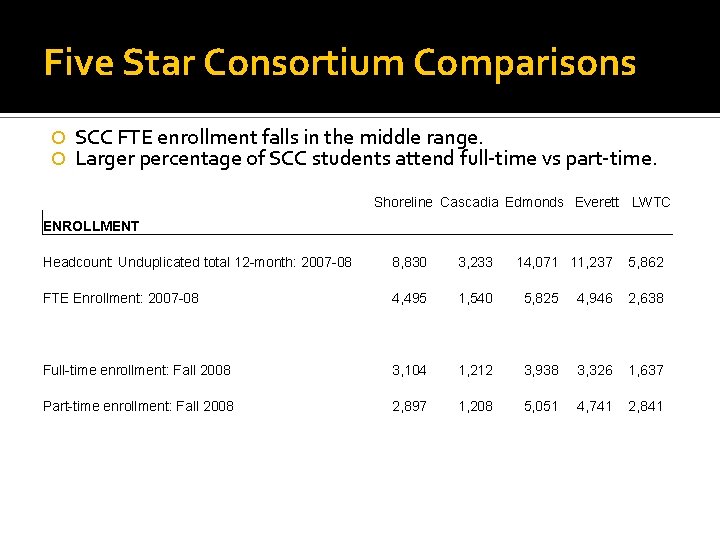
Five Star Consortium Comparisons SCC FTE enrollment falls in the middle range. Larger percentage of SCC students attend full-time vs part-time. Shoreline Cascadia Edmonds Everett LWTC ENROLLMENT Headcount: Unduplicated total 12 -month: 2007 -08 8, 830 3, 233 14, 071 11, 237 5, 862 FTE Enrollment: 2007 -08 4, 495 1, 540 5, 825 4, 946 2, 638 Full-time enrollment: Fall 2008 3, 104 1, 212 3, 938 3, 326 1, 637 Part-time enrollment: Fall 2008 2, 897 1, 208 5, 051 4, 741 2, 841
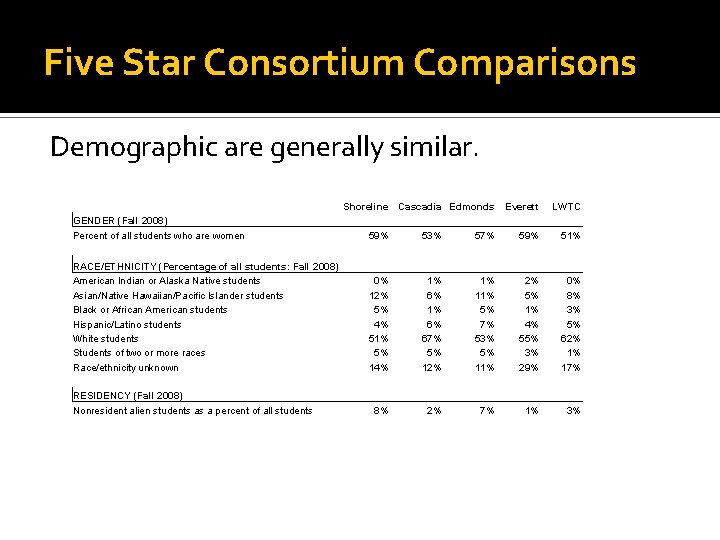
Five Star Consortium Comparisons Demographic are generally similar. GENDER (Fall 2008) Percent of all students who are women Shoreline Cascadia Edmonds Everett LWTC 59% 53% 57% 59% 51% RACE/ETHNICITY (Percentage of all students: Fall 2008) American Indian or Alaska Native students Asian/Native Hawaiian/Pacific Islander students Black or African American students Hispanic/Latino students White students Students of two or more races Race/ethnicity unknown RESIDENCY (Fall 2008) Nonresident alien students as a percent of all students 0% 12% 5% 4% 51% 5% 14% 1% 6% 67% 5% 12% 8% 1% 11% 5% 7% 53% 5% 11% 2% 2% 5% 1% 4% 55% 3% 29% 7% 0% 8% 3% 5% 62% 1% 17% 1% 3%
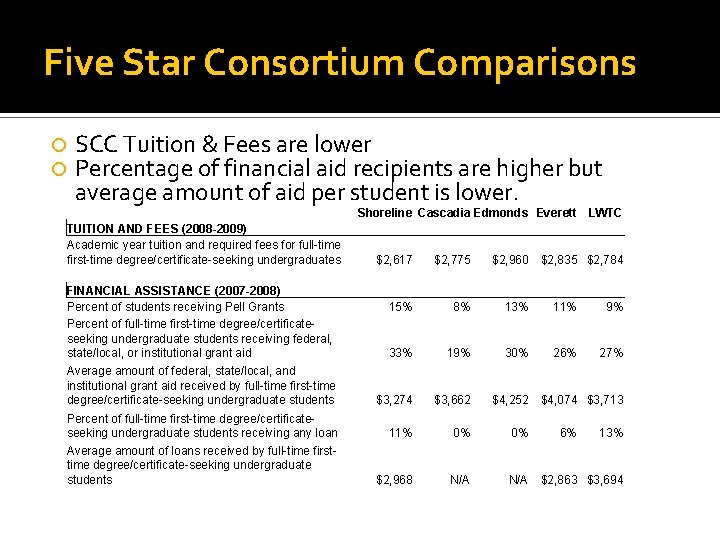
Five Star Consortium Comparisons SCC Tuition & Fees are lower Percentage of financial aid recipients are higher but average amount of aid per student is lower. TUITION AND FEES (2008 -2009) Academic year tuition and required fees for full-time first-time degree/certificate-seeking undergraduates FINANCIAL ASSISTANCE (2007 -2008) Percent of students receiving Pell Grants Percent of full-time first-time degree/certificateseeking undergraduate students receiving federal, state/local, or institutional grant aid Average amount of federal, state/local, and institutional grant aid received by full-time first-time degree/certificate-seeking undergraduate students Percent of full-time first-time degree/certificateseeking undergraduate students receiving any loan Average amount of loans received by full-time firsttime degree/certificate-seeking undergraduate students Shoreline Cascadia Edmonds Everett LWTC $2, 617 $2, 775 $2, 960 $2, 835 $2, 784 15% 8% 13% 11% 9% 33% 19% 30% 26% 27% $3, 274 $3, 662 11% 0% 0% $2, 968 N/A $4, 252 $4, 074 $3, 713 6% 13% $2, 863 $3, 694
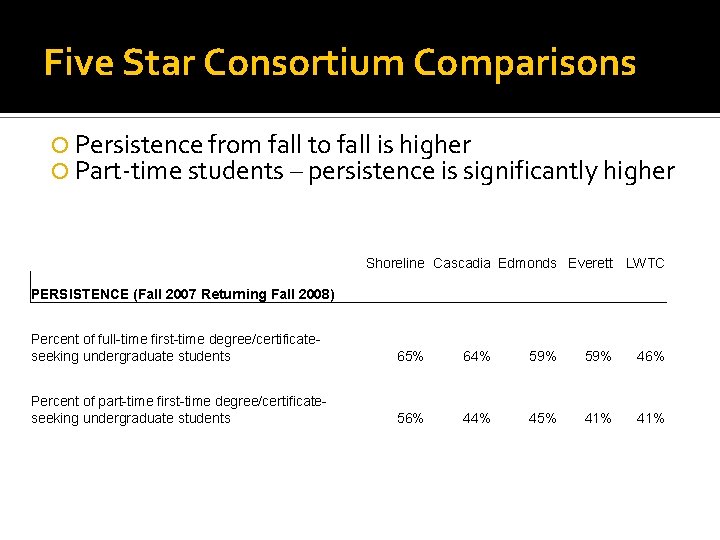
Five Star Consortium Comparisons Persistence from fall to fall is higher Part-time students – persistence is significantly higher Shoreline Cascadia Edmonds Everett LWTC PERSISTENCE (Fall 2007 Returning Fall 2008) Percent of full-time first-time degree/certificateseeking undergraduate students 65% 64% 59% 46% Percent of part-time first-time degree/certificateseeking undergraduate students 56% 44% 45% 41%
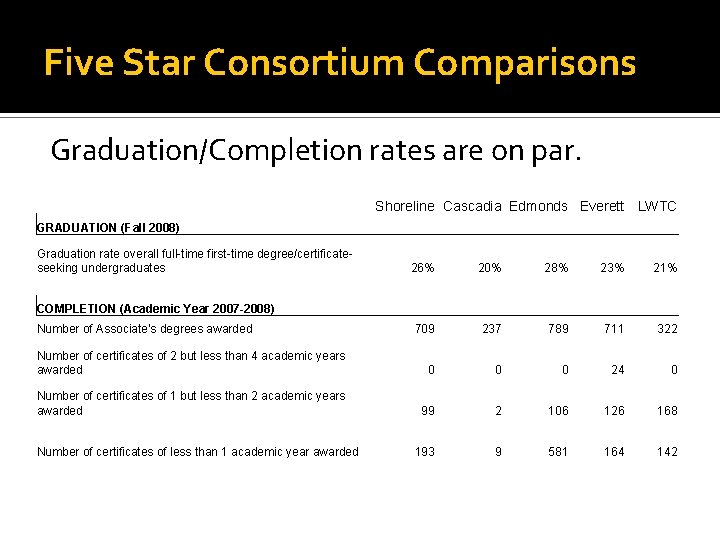
Five Star Consortium Comparisons Graduation/Completion rates are on par. Shoreline Cascadia Edmonds Everett LWTC GRADUATION (Fall 2008) Graduation rate overall full-time first-time degree/certificateseeking undergraduates COMPLETION (Academic Year 2007 -2008) Number of Associate's degrees awarded 26% 20% 28% 23% 21% 709 237 789 711 322 Number of certificates of 2 but less than 4 academic years awarded 0 0 0 24 0 Number of certificates of 1 but less than 2 academic years awarded 99 2 106 126 168 193 9 581 164 142 Number of certificates of less than 1 academic year awarded
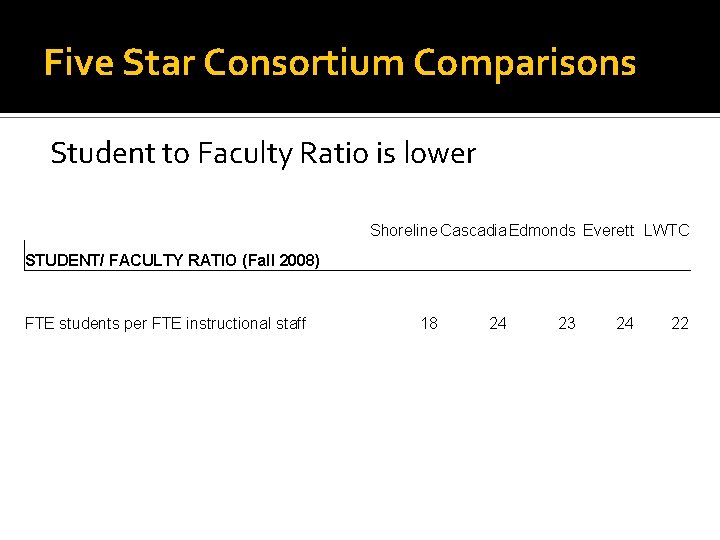
Five Star Consortium Comparisons Student to Faculty Ratio is lower Shoreline Cascadia Edmonds Everett LWTC STUDENT/ FACULTY RATIO (Fall 2008) FTE students per FTE instructional staff 18 24 23 24 22
Presented by John Backes Vice President for Academic Affairs Shoreline Community College August 24 -25, 2010 Responses to Federal and State Challenges and Opportunities
Transfer Education Challenges
Transfer Education Challenges Transfer Education Professional-Technical Education Basic Skills and ESL Education Non-Credit Education
Transfer Education Challenges Proximity Matters Time for Family Impacts Transfer Especially for Women Full Time Work Impacts Transfer Goal Clarity Is Important For Transfer Costs Of College Older Adults Have Lower Transfer Rates Lack of Major Specific Information For Transfer SBCTC Research Report No. 10 -1 March 2010
Transfer Education Challenges Related Findings: Degrees Do Matter For Successful Transfer Not Every Successful “Transfer” Student Transfers 2 of 10 Who Transfer Within 10 Years Do So After A Delay of 1 to 9 years SBCTC Research Report No. 10 -1 March 2010
SCC Transfer Rates And General Education Requirements SCC Graduation Rates On Par No Evidence That SCC Degree Requirements Are A Barrier Compared To Sister Colleges Progress In Extending Access To General Education Requirements Continues
SCC Transfer Rates And General Education Requirements Mathematics Communication Multicultural Understanding
Professional-Technical Education Challenges
Professional-Technical Education Challenges Keeping Program Outcomes Strong (employment rates, job retention, wage recovery) Record Enrollments In High Demand Fields Changing Enrollment Patterns and Demographic Characteristics SBCTC Research Report No. 10 -2 March 2010
Professional-Technical Education SCC offers 107 Degrees/Certificates Record state enrollments in Business, IT, Nursing, Manufacturing and Health Services/Tech SCC 2009 Fall Quarter Enrollments Up 68. 6%
Professional-Technical Education Workforce Allocations 2009 -2010 Total State Workforce Allocation = $35. 3 million SCC’s Allocation = $1. 7 million
Basic Skills Education
Basic Skills Education Adult Basic Education/GED ESL and ESL Academic/International Career Education Options (CEO) (Learning Center North)
Basic Skills Education Strategies To Improve Student Transition To College Level Work ▪ Bridge Classes: Math, A & P, Medical Terminology, Health Care Overview ▪ ESL Lab Updates ▪ Automotive Transitional Education Program ▪ IBEST (Integrated Basic Education & Skills Training) ▪ Expanded WEB/e. Learning Presence ▪ Ameri-Corps Retention Monitoring Project ▪ SAI GED Advising Project
Non-Credit Education
Non-Credit Education ▪ Personal Enrichment Program Terminated–Budget Reduction ▪ Re-focus on 50+ Program And Targeted Contract Training
Non-Credit Education ▪ 50+ Programs Often Include: • • • Introductory Computer Courses Social Networking Internet Skills Connected To Jobs Career Re-creation Self Directed Job Search Basic Skills (brush-up classes) Volunteerism As A Means To Hire Skills Transfer Workshops Community Resource Workshops
Non-Credit Education Targeted Contract Training In: • • • Automotive Sales & Service Manufacturing Allied Health Sciences Clean Technologies Biotechnology Education
Library, e. Learning, Instructional Technology
Library, e. Learning, Instructional Technology ▪ Library E Reference Services 24 x 7 20 Major Journal Databases Over 10, 000 Titles Online Music Library elibrary Collection (additional 43, 000 books) 30 New Computers including Macs Wi-Fi Hotspot Imbedded Information Literacy Skills In Selected English Composition Classes • Online Tutorials: • IRIS Information & Research Instruction Suite • WEB Search Strategies • OWL Online Writing Lab • •
Library, e. Learning, Instructional Technology ▪ e. Learning • SCC e. Learning Classes Offered As Of Spring 2010: 586 • About 11, 000 Students Currently Enrolled (duplicated headcount) • Spring Quarter 2010 67% Of FTE’s Enrolled In e. Learning Classes • 84% Rated e. Learning Classes As Good, Very Good Or Excellent • 54% Take e. Learning Courses For Schedule Flexibility • Student And Faculty Online Orientations Including Video • Faculty Development Initiatives: Quality Matters Grant • Added Elluminate Meeting Software To Classrooms • Added Tegrity Lecture Capture Software For Faculty • Leading College In The System In Using Current Bb Services
Library, e. Learning, Instructional Technology ▪ Instructional Technology • About 33% Of Classrooms Are “Smart Classrooms” • Another 33% Of All Classrooms Will Become “Smart” • Over 1, 200 Computers Are Supported • Over 400 Peripherals Are Supported • Over 35, 000 WEB Pages (About 66% Instructional) Supported
Equipment • $286, 000 Annually From General Fund • $160, 000 Annually From WRT And Perkins
Instructional Values ▪ Focus On Learning ▪ Access And Success For Our Diverse Student Population ▪ Excellence And Innovation In Teaching, Learning, Service ▪ Support Services That Meet The Educational Learning Needs Of Our Diverse Community ▪ Integration Of Multicultural And Global Competencies ▪ Learning Across All Areas Of The College
Co-Curricular Learning • Service Learning • Honors/Phi Theta Kappa • Global Affairs Center • Plays • Ebbtide Newspaper • Spindrift Magazine • Delta Epsilon Chi (Business) • Music: Musical, Funkn’ Groove, Choral Groups, Community Band, Opera Workshop, Instrumental Ensembles
The Challenges • Integration Of Classroom Instruction, Co-Curricular Activities And High Quality Accessible Advising • Efficient And Effective Program Planning And Assessment • Maintaining And Advancing The Quality Of Student Experience • Providing Educational Opportunities And Information To All Of Our Students, Not Just Some Of Our Students • Developing A Campus Culture Of Learning Inside And Outside Of The Classroom • Providing Appropriate Academic Support Services For All Of Our Students • Increasing National And International Learning Opportunities And Certifications
Presented by Stephen Smith Vice President for Human Resources and Legal Affairs Shoreline Community College August 24 -25, 2010 Human Resources and Employee Relations
Staffing
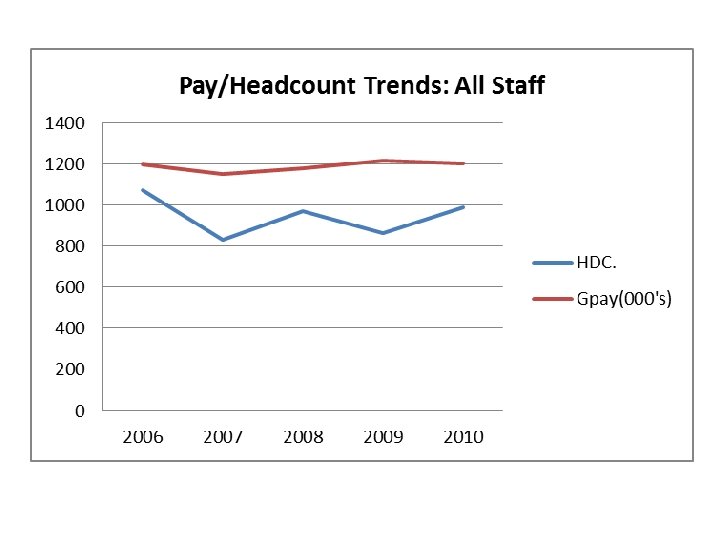
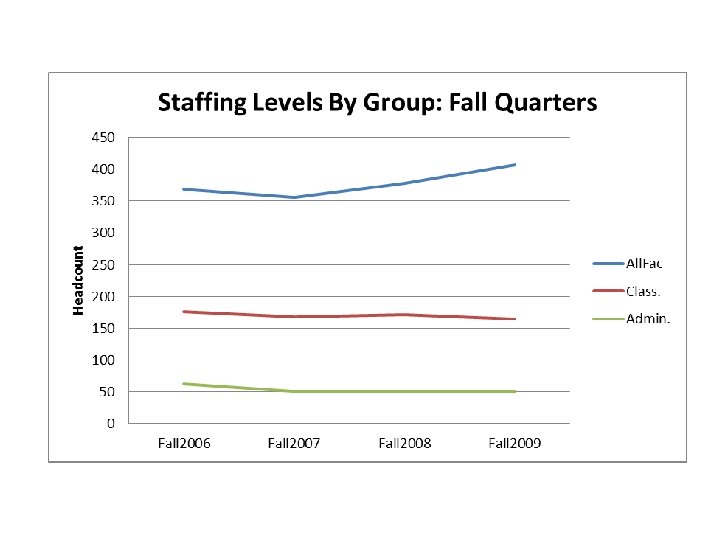
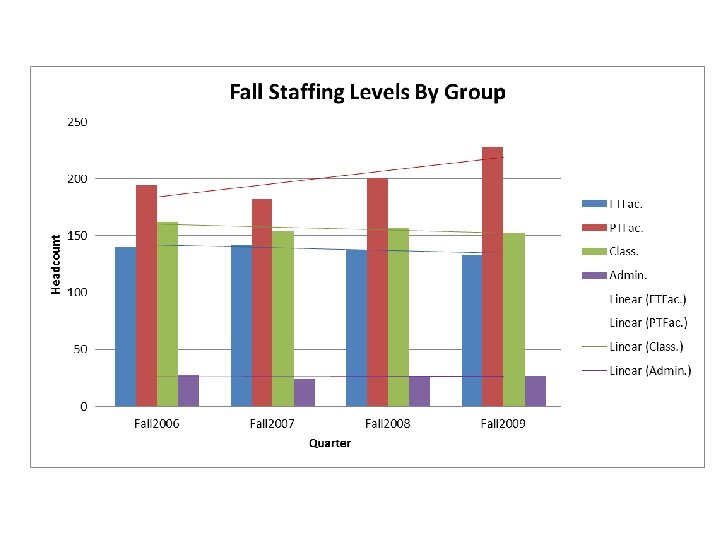
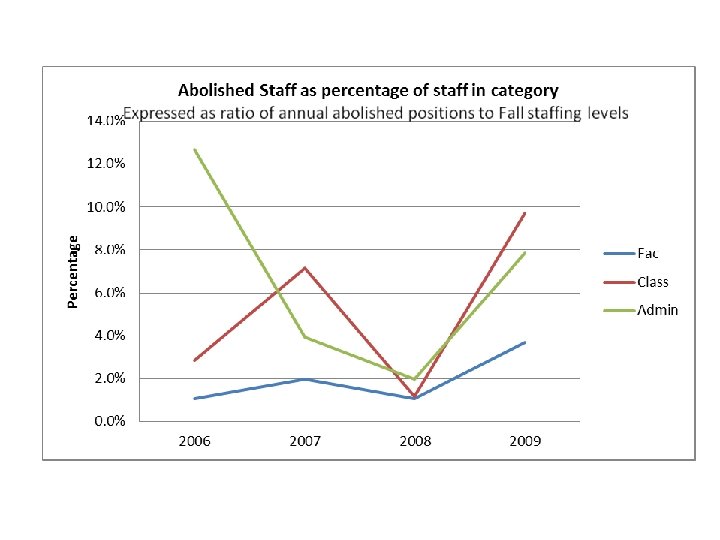
5 -Star Consortium
5 -Star Comparison
5 -Star Comparison
5 -Star Comparison
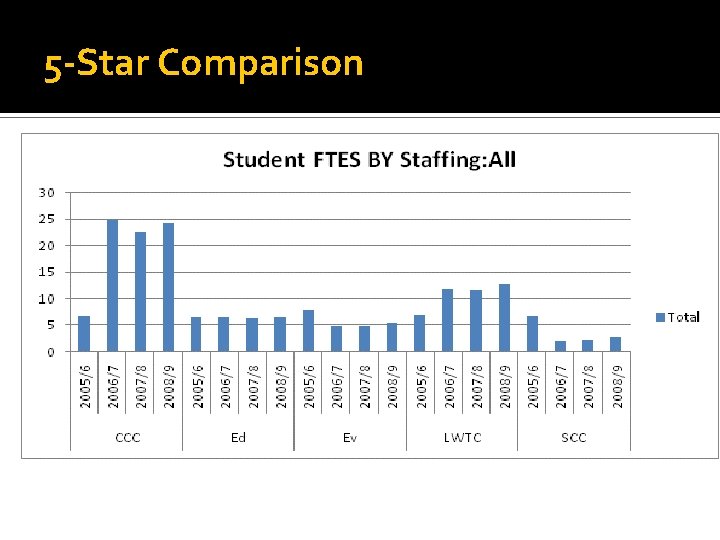
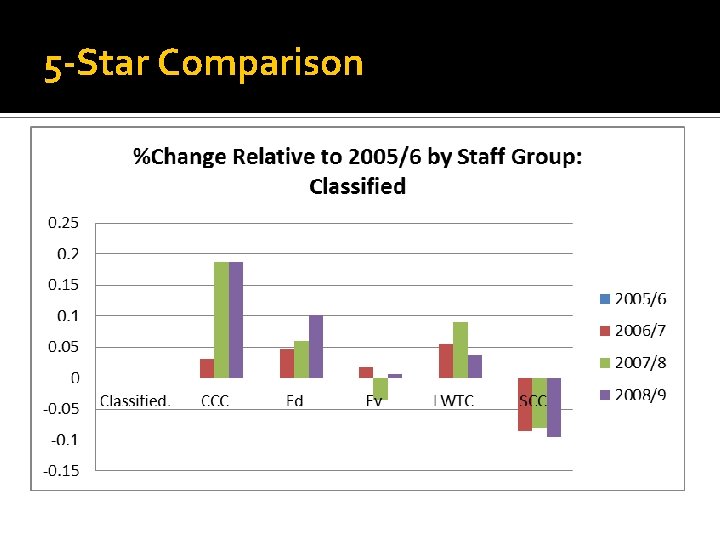
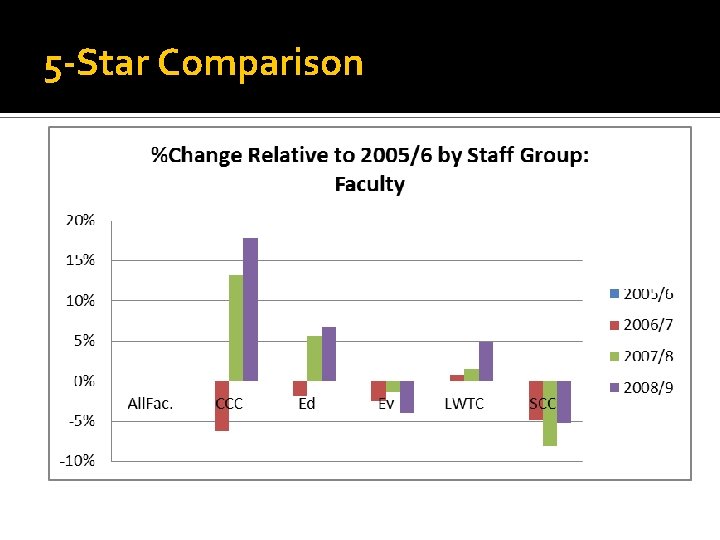
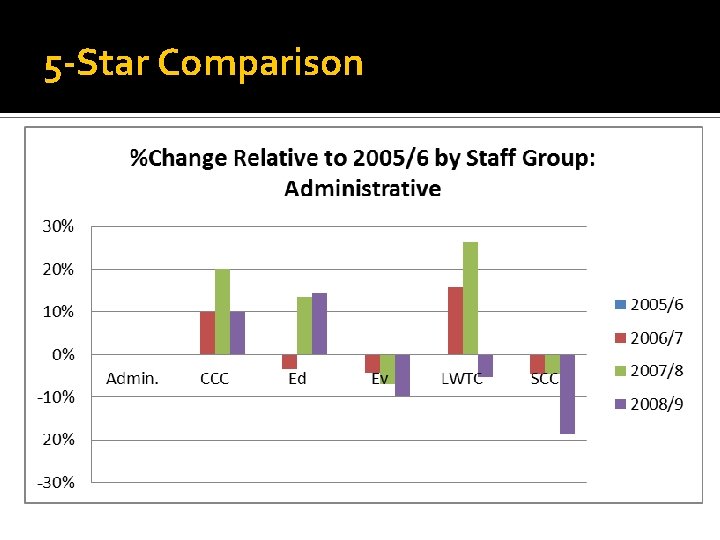
5 -Star Comparison
SCC Current Performance Measurements Classified Staff Evaluations In the two prior fiscal years, 2008 -09 and 2009 -10, updated evaluations were received for 66 of 159 total classified employees (approximately 42%). Annual evaluations, at a minimum, are required by our classified union collective bargaining agreement.
SCC Current Performance Measurements Full Time Faculty Evaluations (FEP) 2009 -10 11 faculty evaluations scheduled 2 deferrals due to retirement occurring in evaluation year 2 no reason documented by dean or employee for non-completion 2008 -09 24 faculty evaluations were scheduled 21 completed on schedule 2 deferrals (1 due to sabbatical, 1 FML) 1 no reason documented by dean or employee for non-completion
SCC Current Performance Measurements Part-Time Faculty Evaluations In 2008, the faculty contract introduced a new process for part-time faculty (PTF). Due to the staggered cycles for the PTF process*, insufficient data has been collected for relevant presentation. *Reduced HR staffing has also limited our data tracking and analysis capacity
Staffing Challenges and Opportunities “Resources” Minimum staffing to fulfill legal, contractual, and regulatory requirements Sufficient staffing to sustain the College consistent with business needs, such as building enrollments Technical infrastructure to efficiently deliver services, e. g. “HP-3000”
Staffing Challenges and Opportunities “Rules” Directive legislation and rules, such as hiring and spending restrictions System-driven limitations, e. g. centralized payroll system Increasing complexity of regulatory requirements that require additional compliance work
Staffing Challenges and Opportunities “Paradox” Current economy has created a rich labor supply -- while hiring restrictions limit our ability to access the right people for the right jobs … right now. Increasing business processes (tracking and analysis) is necessary to meet significant managerial, regulatory, Accreditation and Policy Governance requirements. Human capacity to meet workload demands are reflected in increasing absenteeism and health issues that require more administrative process to manage.
Moving Forward Use internal College capacity to develop and deploy online training resources Deploy fully-hosted online services to support recruitment process and applicant tracking Renegotiation of faculty contract focusing on increasing efficiency and capacity to meet needs Increasing accountability for administrators
Presented by Daryl Campbell Vice President for Administrative Services Shoreline Community College August 24 -25, 2010 Budget and Financial Data and Analyses
Current Funds and Projections
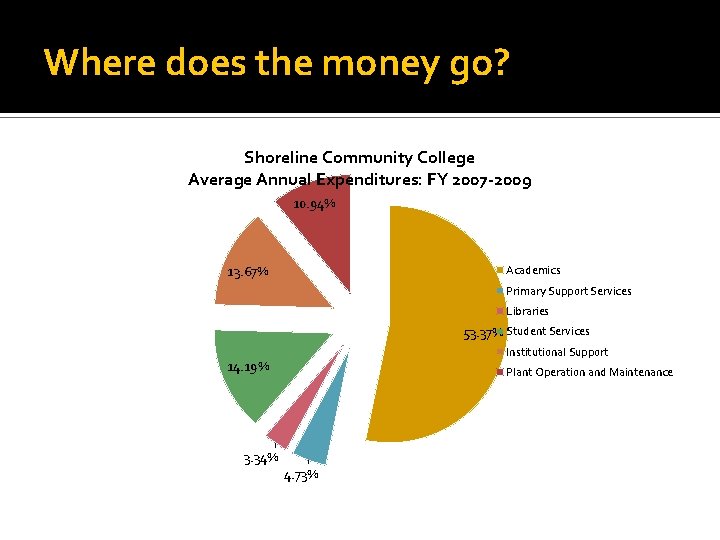
Where does the money go? Shoreline Community College Average Annual Expenditures: FY 2007 -2009 10. 94% Academics 13. 67% Primary Support Services Libraries 53. 37% Student Services Institutional Support 14. 19% 3. 34% Plant Operation and Maintenance 4. 73%
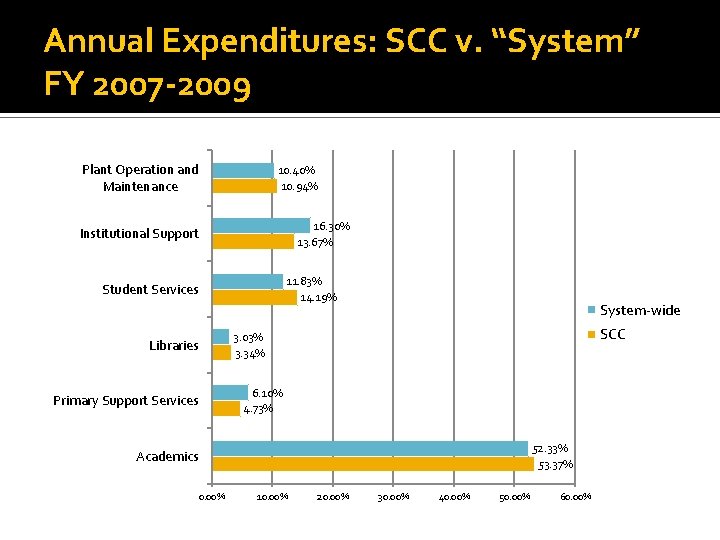
Annual Expenditures: SCC v. “System” FY 2007 -2009 Plant Operation and Maintenance 10. 40% 10. 94% 16. 30% 13. 67% Institutional Support 11. 83% 14. 19% Student Services Libraries Primary Support Services System-wide SCC 3. 03% 3. 34% 6. 10% 4. 73% 52. 33% 53. 37% Academics 0. 00% 10. 00% 20. 00% 30. 00% 40. 00% 50. 00% 60. 00%
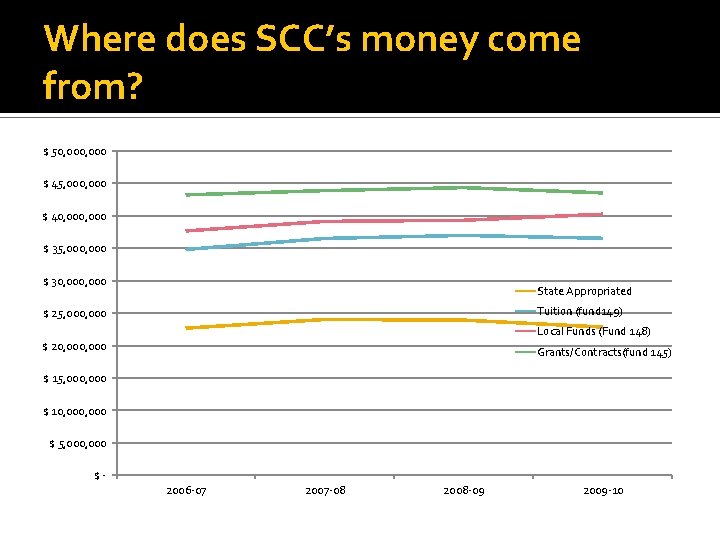
Where does SCC’s money come from? $ 50, 000 $ 45, 000 $ 40, 000 $ 35, 000 $ 30, 000 State Appropriated Tuition (fund 149) $ 25, 000 Local Funds (Fund 148) $ 20, 000 Grants/Contracts(fund 145) $ 15, 000 $ 10, 000 $ 5, 000 $2006 -07 2007 -08 2008 -09 2009 -10
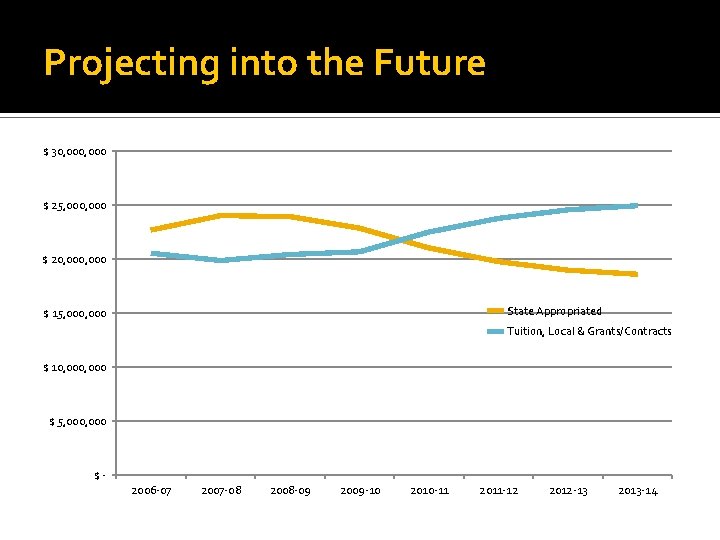
Projecting into the Future $ 30, 000 $ 25, 000 $ 20, 000 State Appropriated $ 15, 000 Tuition, Local & Grants/Contracts $ 10, 000 $ 5, 000 $2006 -07 2007 -08 2008 -09 2009 -10 2010 -11 2011 -12 2012 -13 2013 -14
The Cost to Educate
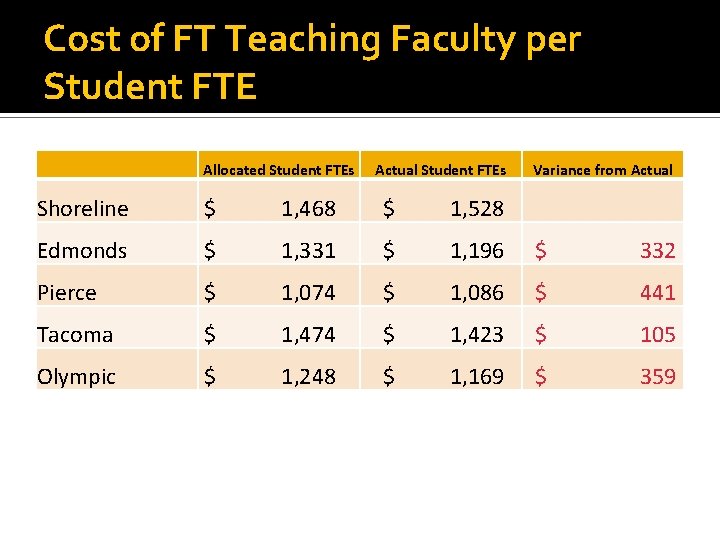
Cost of FT Teaching Faculty per Student FTE Allocated Student FTEs Actual Student FTEs Variance from Actual Shoreline $ 1, 468 $ 1, 528 Edmonds $ 1, 331 $ 1, 196 $ 332 Pierce $ 1, 074 $ 1, 086 $ 441 Tacoma $ 1, 474 $ 1, 423 $ 105 Olympic $ 1, 248 $ 1, 169 $ 359
The “Big Picture”
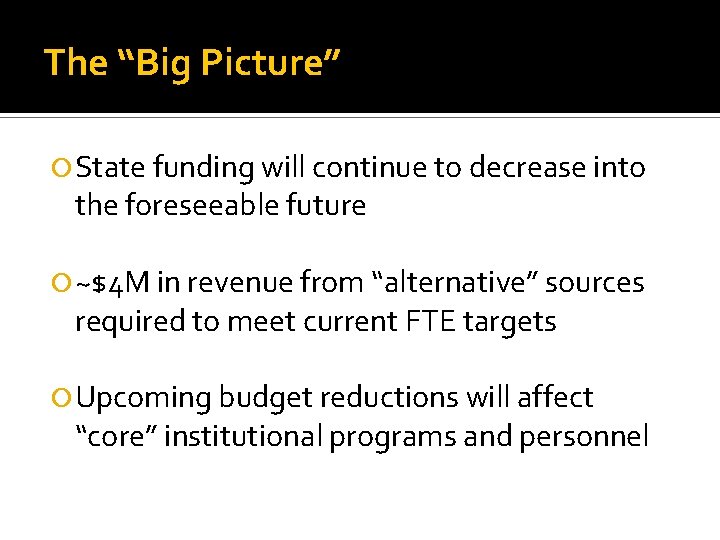
The “Big Picture” State funding will continue to decrease into the foreseeable future ~$4 M in revenue from “alternative” sources required to meet current FTE targets Upcoming budget reductions will affect “core” institutional programs and personnel
Financial Challenges and Opportunities
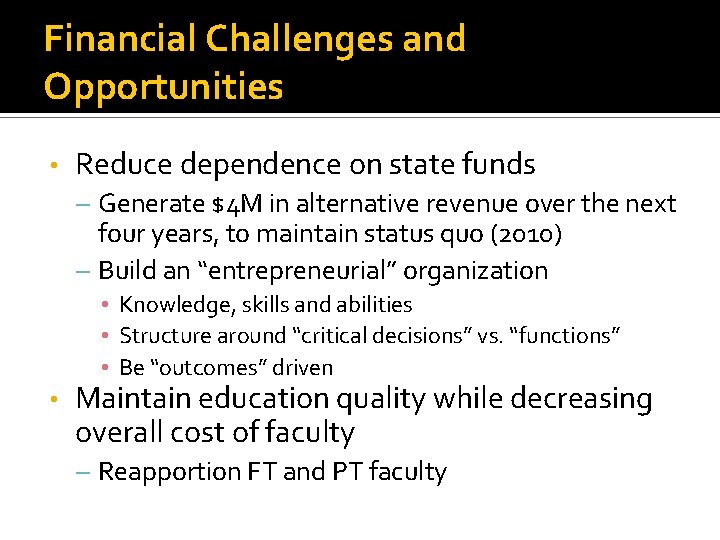
Financial Challenges and Opportunities • Reduce dependence on state funds – Generate $4 M in alternative revenue over the next four years, to maintain status quo (2010) – Build an “entrepreneurial” organization • Knowledge, skills and abilities • Structure around “critical decisions” vs. “functions” • Be “outcomes” driven • Maintain education quality while decreasing overall cost of faculty – Reapportion FT and PT faculty
Financial Challenges and Opportunities • Increase Enrollment – Key Investments: • • 21 st Century Technology International Students Innovation (R&D) “Entrepreneurial” shift – Personnel with appropriate knowledge, skills and abilities – Agility: resource allocation and decision-making • • • Marketing and Recruitment Adults e. Learning Program development Buildings and maintenance
Questions
- Slides: 82