
Presented by Alex Kelson Ben Sparks Drew Walsh
Presented by: Alex Kelson, Ben Sparks, Drew Walsh, Oyebola Akinmulero, Shaghayegh Tareh, Tim Pearson, Tina Tran 1
Table of Contents 1. Find a statistical question to answer • Located on Page 3 2. Come up with your own hypothesis • Located on Page 3 3. Collect data • Raw Data Located on Page 4 (Table 1 and Graph 1) 4. Organize and summarize the data • Located on Pages 5 -6 5. Plot x vs. y and calculate linear correlation coefficient, r • Located on Page 7 6. Predicted Y • Located on page 8 Residual • Located on page 9 7. Check to see if the linear model assumption is valid • Located on Page 10 8. Make a few predictions • Located on Page 11 9. Afterthought • Located on Page 12 Sources • located on page 13 2
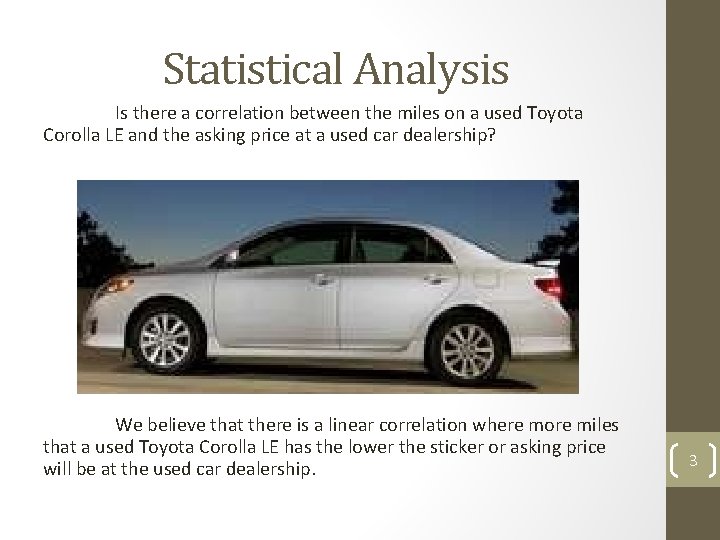
Statistical Analysis Is there a correlation between the miles on a used Toyota Corolla LE and the asking price at a used car dealership? We believe that there is a linear correlation where more miles that a used Toyota Corolla LE has the lower the sticker or asking price will be at the used car dealership. 3
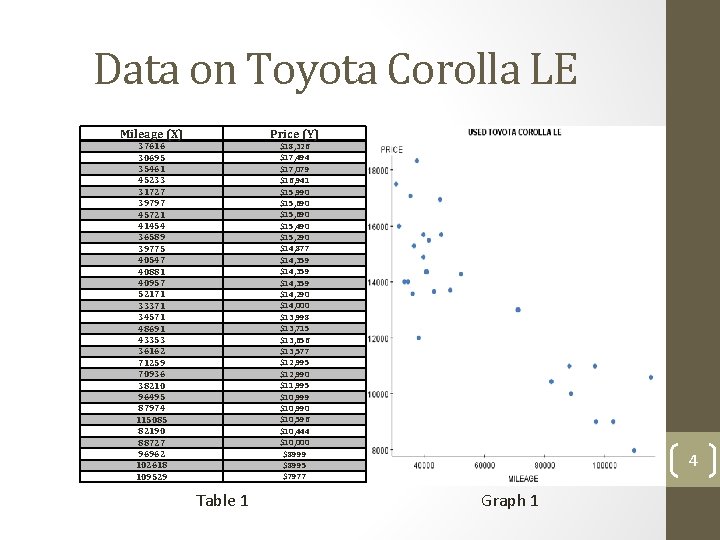
Data on Toyota Corolla LE Mileage (X) Price (Y) 37616 30695 35461 45233 31727 39797 45721 41454 36589 39775 40547 40881 40957 52171 33371 34571 48691 43353 36162 71259 70936 38210 96495 87974 115085 82190 88727 96962 102618 109529 $18, 326 $17, 494 $17, 079 $16, 941 $15, 990 $15, 690 $15, 490 $15, 290 $14, 877 $14, 359 $14, 290 $14, 000 $13, 998 $13, 715 $13, 656 $13, 577 $12, 995 $12, 990 $11, 995 $10, 999 $10, 990 $10, 596 $10, 444 $10, 000 $8999 $8995 $7977 Table 1 4 Graph 1
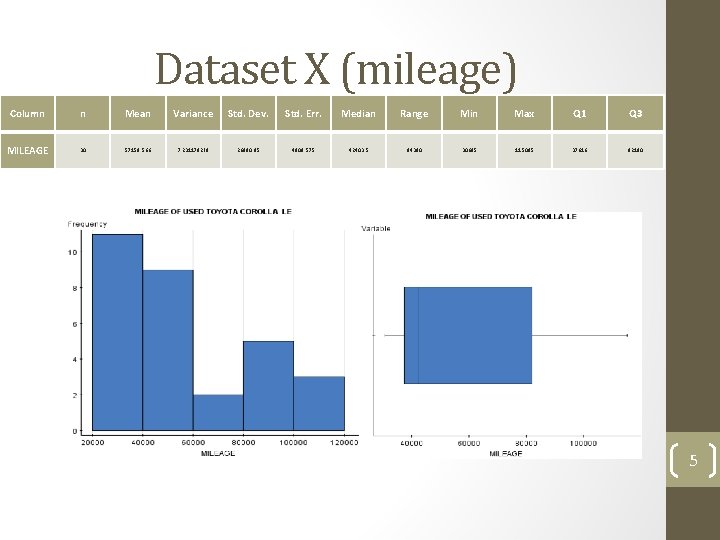
Dataset X (mileage) Column n Mean Variance Std. Dev. Std. Err. Median Range Min Max Q 1 Q 3 MILEAGE 30 57158. 566 7. 2311782 E 8 26890. 85 4909. 575 42403. 5 84390 30695 115085 37616 82190 5
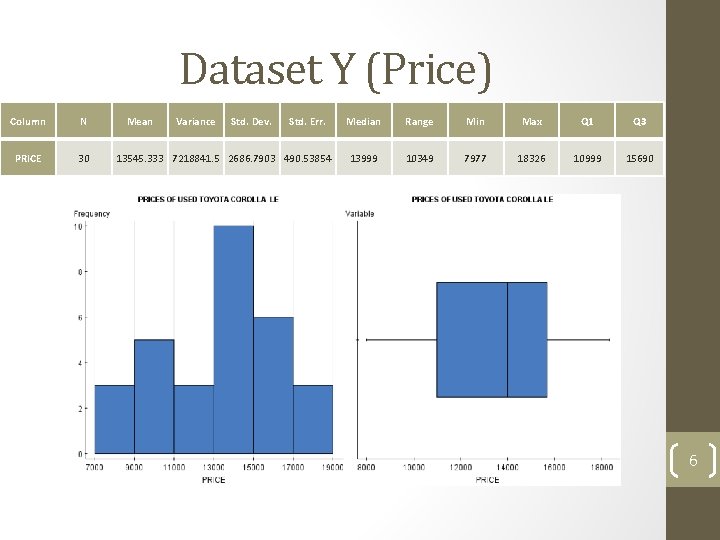
Dataset Y (Price) Column N PRICE 30 Mean Variance Std. Dev. Std. Err. 13545. 333 7218841. 5 2686. 7903 490. 53854 Median Range Min Max Q 1 Q 3 13999 10349 7977 18326 10999 15690 6
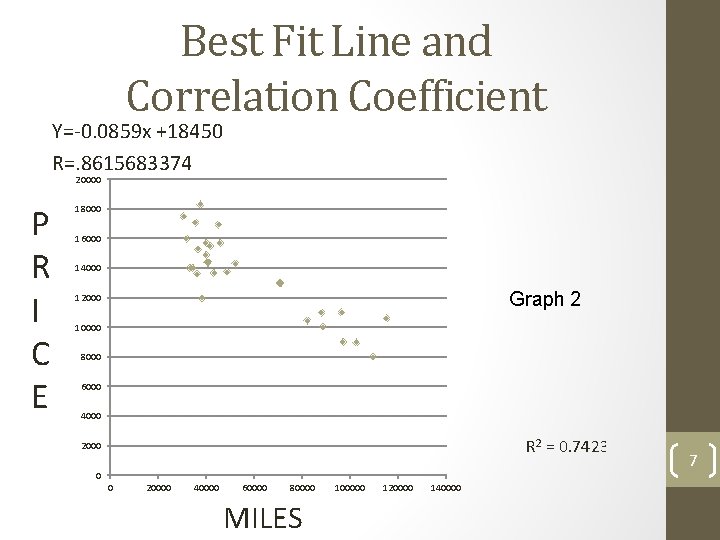
Best Fit Line and Correlation Coefficient Y=-0. 0859 x +18450 R=. 8615683374 20000 P R I C E 18000 16000 14000 Graph 2 12000 10000 8000 6000 4000 R 2 = 0. 7423 2000 0 0 20000 40000 60000 80000 MILES 100000 120000 140000 7
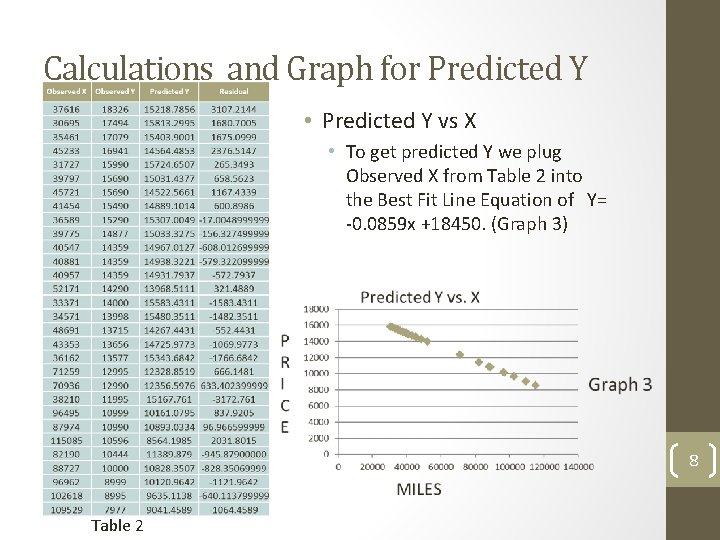
Calculations and Graph for Predicted Y • Predicted Y vs X • To get predicted Y we plug Observed X from Table 2 into the Best Fit Line Equation of Y= -0. 0859 x +18450. (Graph 3) 8 Table 2
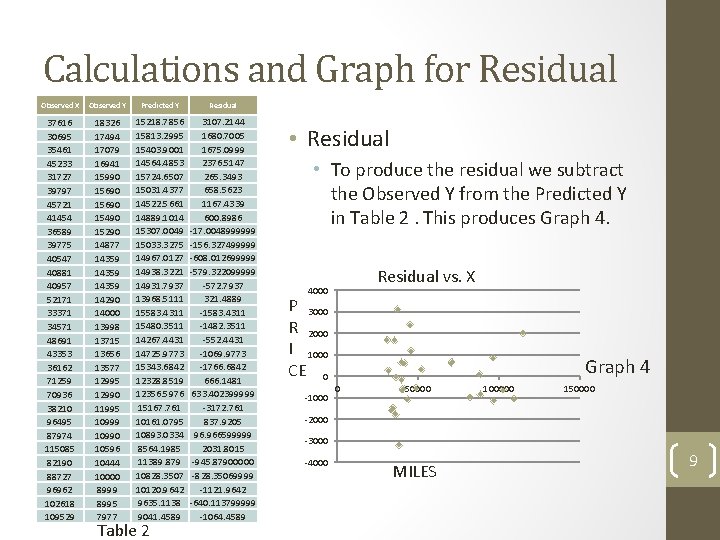
Calculations and Graph for Residual Observed X Observed Y Predicted Y Residual 37616 30695 35461 45233 31727 39797 45721 41454 36589 39775 40547 40881 40957 52171 33371 34571 48691 43353 36162 71259 70936 38210 96495 87974 115085 82190 88727 96962 102618 109529 18326 17494 17079 16941 15990 15690 15490 15290 14877 14359 14290 14000 13998 13715 13656 13577 12995 12990 11995 10999 10990 10596 10444 10000 8999 8995 7977 15218. 7856 15813. 2995 15403. 9001 14564. 4853 15724. 6507 15031. 4377 14522. 5661 14889. 1014 15307. 0049 15033. 3275 14967. 0127 14938. 3221 14931. 7937 13968. 5111 15583. 4311 15480. 3511 14267. 4431 14725. 9773 15343. 6842 12328. 8519 12356. 5976 15167. 761 10161. 0795 10893. 0334 8564. 1985 11389. 879 10828. 3507 10120. 9642 9635. 1138 9041. 4589 3107. 2144 1680. 7005 1675. 0999 2376. 5147 265. 3493 658. 5623 1167. 4339 600. 8986 -17. 0048999999 -156. 327499999 -608. 012699999 -579. 322099999 -572. 7937 321. 4889 -1583. 4311 -1482. 3511 -552. 4431 -1069. 9773 -1766. 6842 666. 1481 633. 402399999 -3172. 761 837. 9205 96. 966599999 2031. 8015 -945. 87900000 -828. 35069999 -1121. 9642 -640. 113799999 -1064. 4589 Table 2 • Residual • To produce the residual we subtract the Observed Y from the Predicted Y in Table 2. This produces Graph 4. Residual vs. X 4000 P 3000 R 2000 I 1000 CE 0 -1000 Graph 4 0 50000 100000 150000 -2000 -3000 -4000 MILES 9
Linear Model Assumption Due to the fact that there is a linear correlation using the best fit line model we have met the criteria for section A on #7 Since there was no discernible pattern in the graph of “Residual vs X” (found on Page 8), the data is linearly related. Since we have used 30 points in our data set and our correlation coefficient or R =. 8615 this is much higher than the required. 361 we have found a strong positive correlation. We have concluded that using the data from cars. com, a strong correlation between the miles on a used vehicle will lower the sticker/asking price of a Toyota Corolla LE. 10
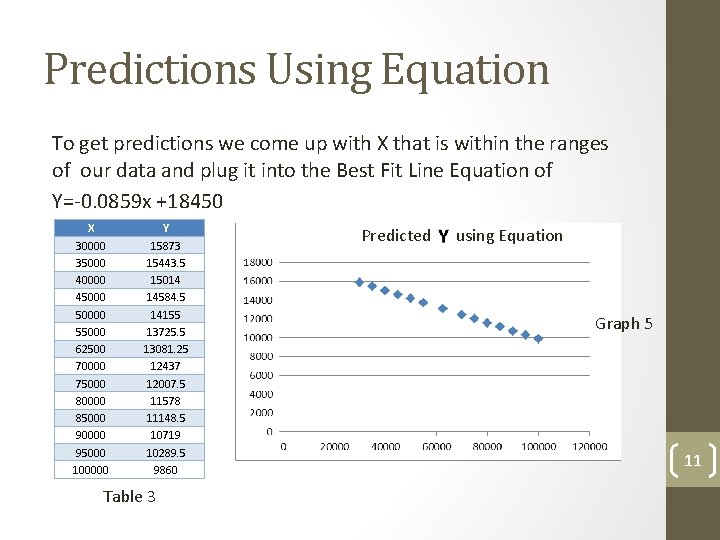
Predictions Using Equation To get predictions we come up with X that is within the ranges of our data and plug it into the Best Fit Line Equation of Y=-0. 0859 x +18450 X 30000 35000 40000 450000 55000 62500 70000 75000 80000 85000 90000 95000 100000 Y 15873 15443. 5 15014 14584. 5 14155 13725. 5 13081. 25 12437 12007. 5 11578 11148. 5 10719 10289. 5 9860 Table 3 Predicted using Equation Graph 5 11
After Thought • Did you just do a convenience or voluntary-response sampling to collect your data? sampling data was convenience based. We found it through an internet search. The • Did your study suffer from too few data points? We don’t believe the study suffered from too few data points, it points out clearly that car value decreases with increased mileage. • Are you misrepresenting the data? No we are not misrepresenting the data. • Is your analysis correct? The analysis is correct. • Does your conclusion make sense? Yes our conclusion makes sense. • We believe that the study was useful for our reader. However, most of this knowledge is considered common sense. We think it would have been helpful to research a variety of cars and compare resale value based on mileage. This study could have more value by comparing upgrades vs. stock resale value and this could be done for multiple makes and models. This could influence the reader’s decision between makes and models and the upgrades purchased depending on the added resale value. 12
Sources • All statistical data was acquired using the Cars. com search engine for “Used Toyota Corolla LE” search grid within 10 miles of 84070 accessed on 11/14/11 http: //www. cars. com/for-sale/used/toyota/corolla/le/_/Nma 9 Zfi 0 Zg 3 h. Zinq. Zm 5 d? sf 1 Dir=DESC&mk. Id=20088&md. Id=20861&rd=10&zc=84070&PMmt=1 -10&stk. Typ. Id=28881&sf 2 Dir=ASC&sf 1 Nm=price&sf 2 Nm=miles&rpp=50&feed. Seg. Id=28705&search. Source =GN_REFINEMENT&cr. Srt. Flds=stk. Typ. Id-feed. Seg. Id-mk. Id-md. Id-tr. Id&pg. Id=2102&tr. Id=24182 13
- Slides: 13