
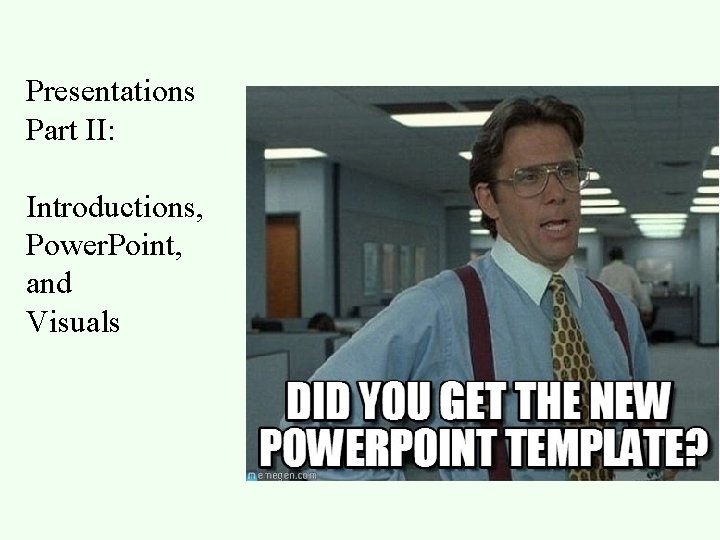
Presentations Part II Introductions Power Point and Visuals


- Slides: 59
Presentations Part II: Introductions, Power. Point, and Visuals
Office Hours: 2: 30 -3: 30 Wednesday (new time) For Thursday: bring in draft of introduction; work on scope statement
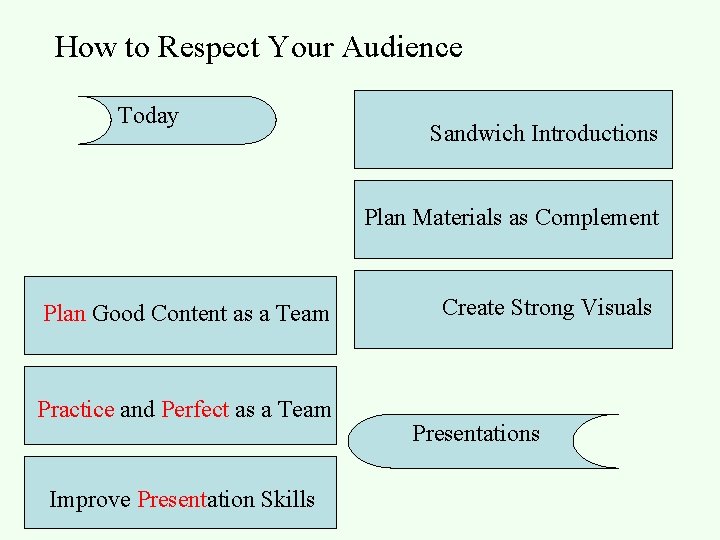
How to Respect Your Audience Today Sandwich Introductions Plan Materials as Complement Plan Good Content as a Team Practice and Perfect as a Team Improve Presentation Skills Create Strong Visuals Presentations
Reflections on Expertise/Spice Design
T is for Timing and Transitions E is for Energy and Engagement A is for Appearance M is for Materials Q is for Questions
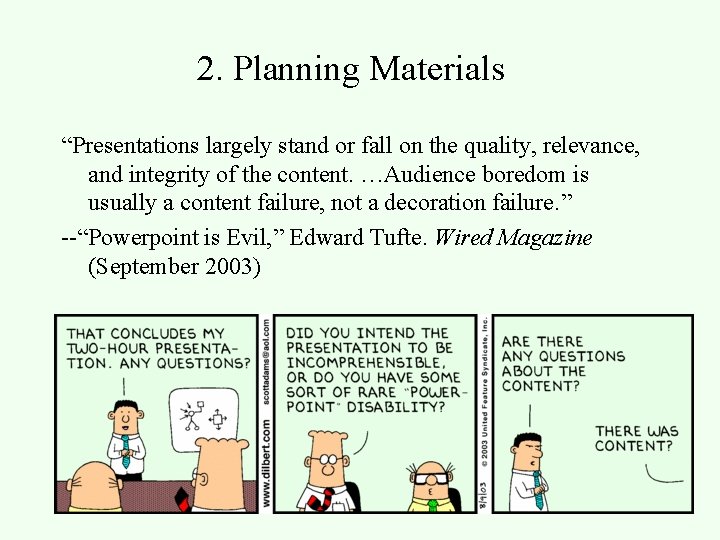
“Presentations largely stand or fall on the quality, relevance, and integrity of the content. …Audience boredom is usually a content failure, not a decoration failure. ” --“Powerpoint is Evil, ” Edward Tufte. Wired Magazine (September 2003)
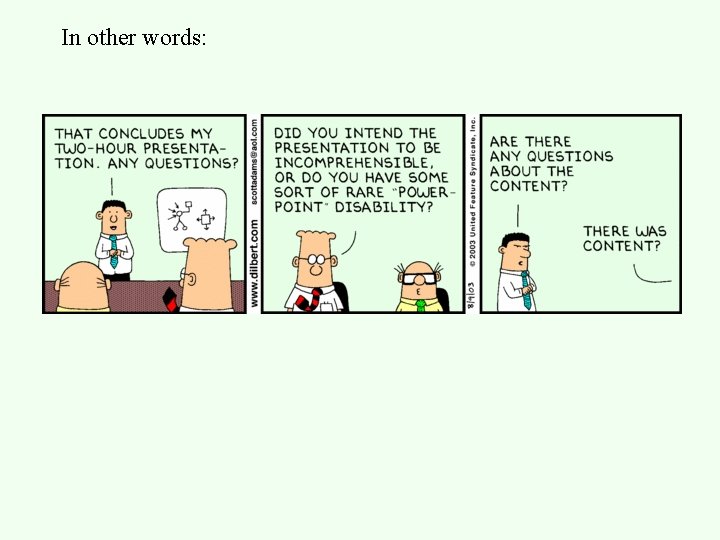
In other words:
1. Sandwiching Introductions
Use your introduction slide and overview slide to your audience’s advantage [Alley, 2013]
Your title slide is your chance to engage with what your topic is and why your audience should care Ny-Ålesund Katrine Aspmo Torunn Berg Norwegian Institute for Air Research Grethe Wibetoe University of Oslo, Dept. of Chemistry June 16, 2004 Really Important Event [Alley, 2013]
Create a detailed scope slide that provides a detailed overview [Alley, 2013]
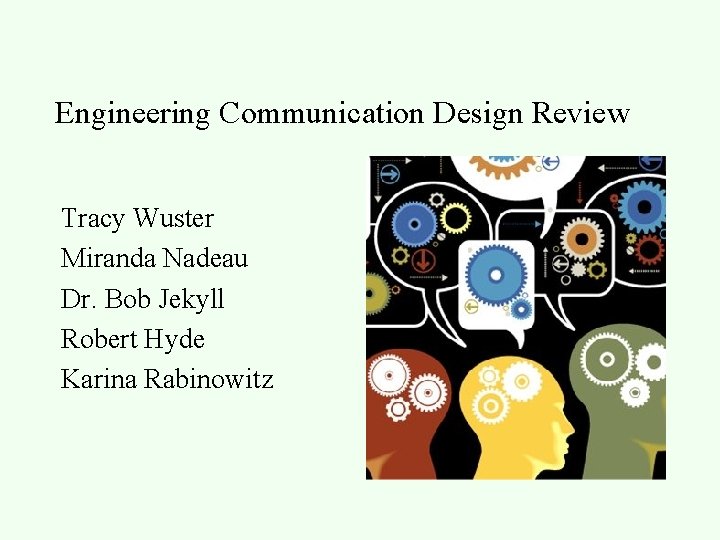
Engineering Communication Design Review Tracy Wuster Miranda Nadeau Dr. Bob Jekyll Robert Hyde Karina Rabinowitz
Presentation outline Introduction Objectives Design Concept Conclusion
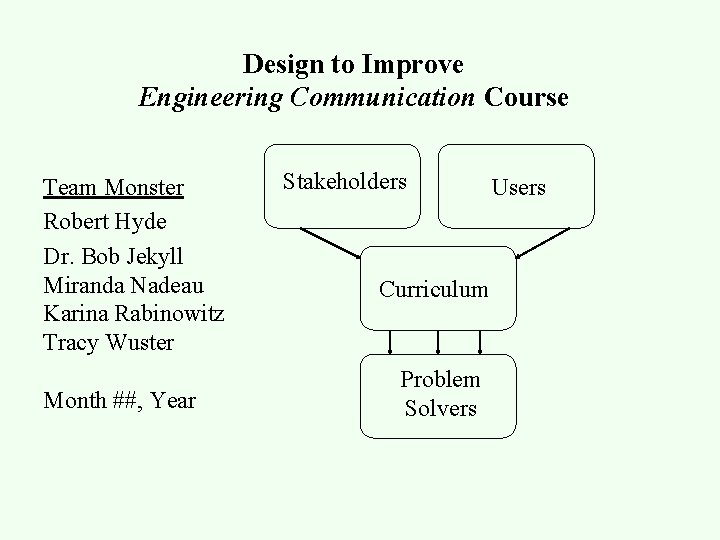
Design to Improve Engineering Communication Course Team Monster Robert Hyde Dr. Bob Jekyll Miranda Nadeau Karina Rabinowitz Tracy Wuster Month ##, Year Stakeholders Curriculum Problem Solvers Users
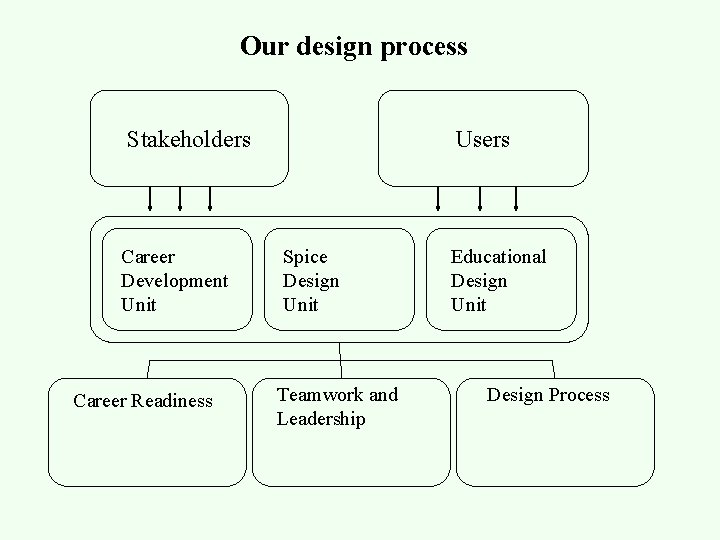
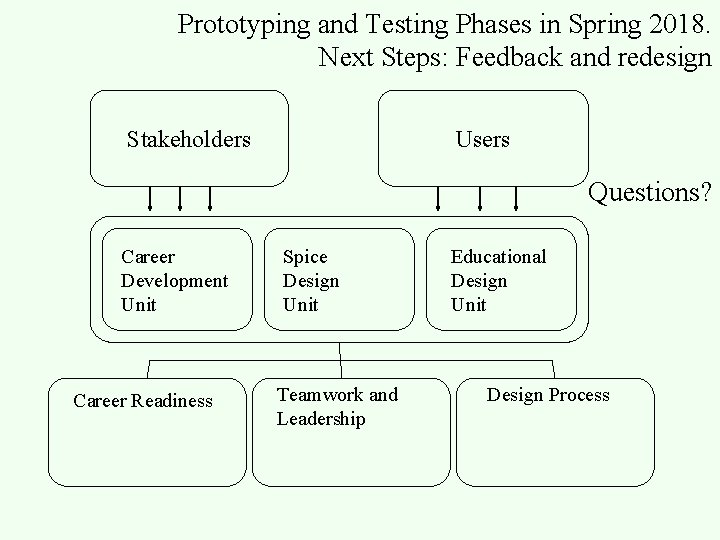
Our design process Stakeholders Career Development Unit Career Readiness Users Spice Design Unit Teamwork and Leadership Educational Design Unit Design Process
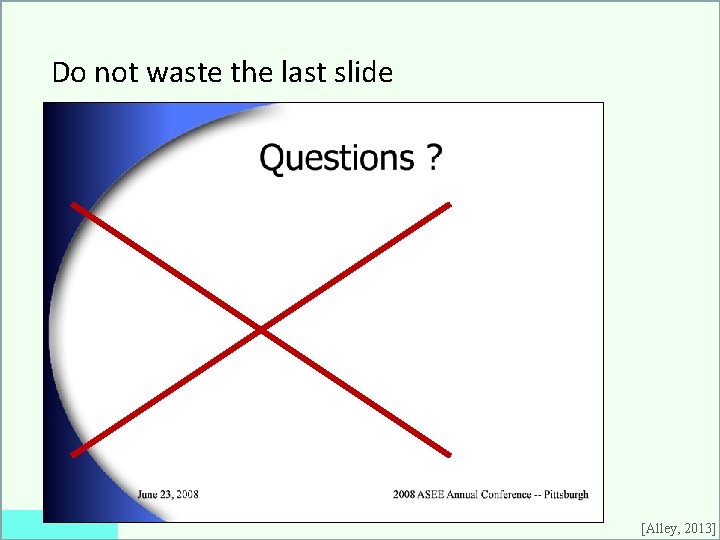
Do not waste the last slide [Alley, 2013]
Prototyping and Testing Phases in Spring 2018. Next Steps: Feedback and redesign Stakeholders Users Questions? Career Development Unit Career Readiness Spice Design Unit Teamwork and Leadership Educational Design Unit Design Process
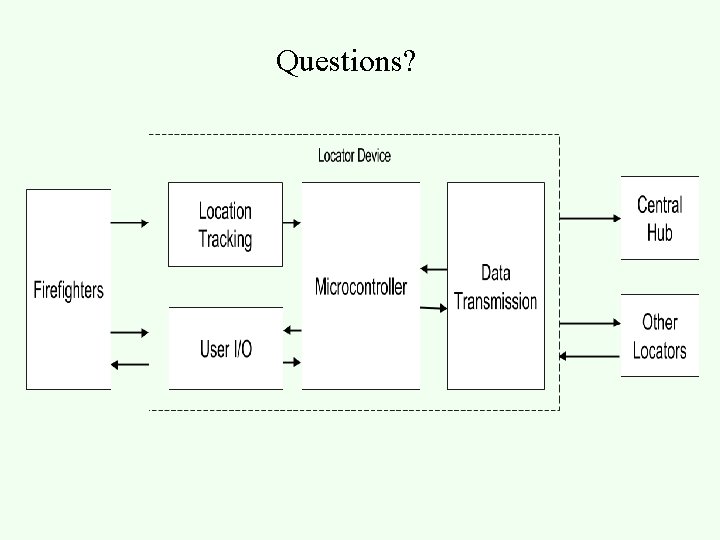
Questions?
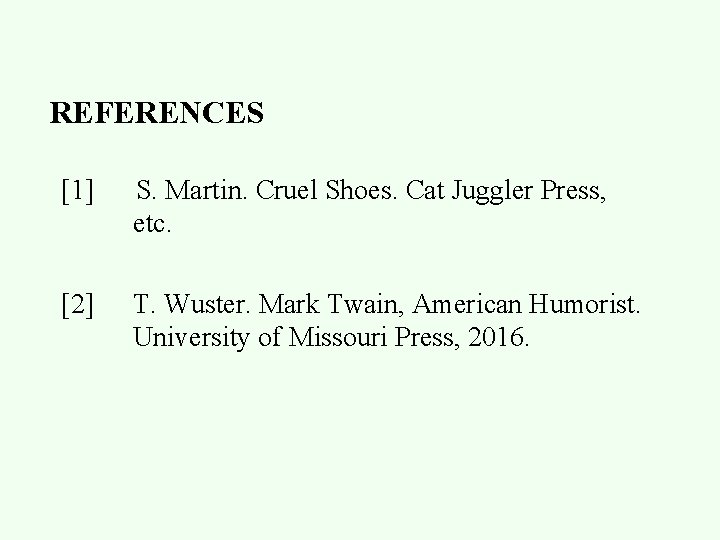
REFERENCES [1] S. Martin. Cruel Shoes. Cat Juggler Press, etc. [2] T. Wuster. Mark Twain, American Humorist. University of Missouri Press, 2016.
2. Planning Materials “Presentations largely stand or fall on the quality, relevance, and integrity of the content. …Audience boredom is usually a content failure, not a decoration failure. ” --“Powerpoint is Evil, ” Edward Tufte. Wired Magazine (September 2003)
How to Power. Point!: A Guide *Amaze your friends *Confuse your boss! *Annoy your co-workers!
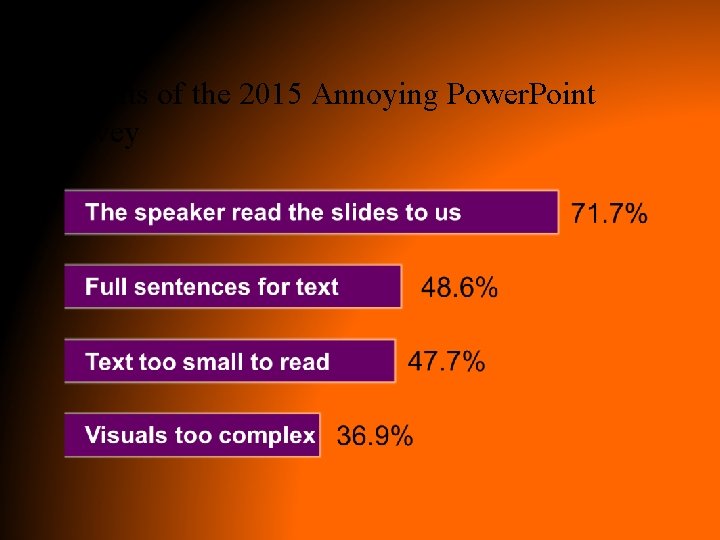
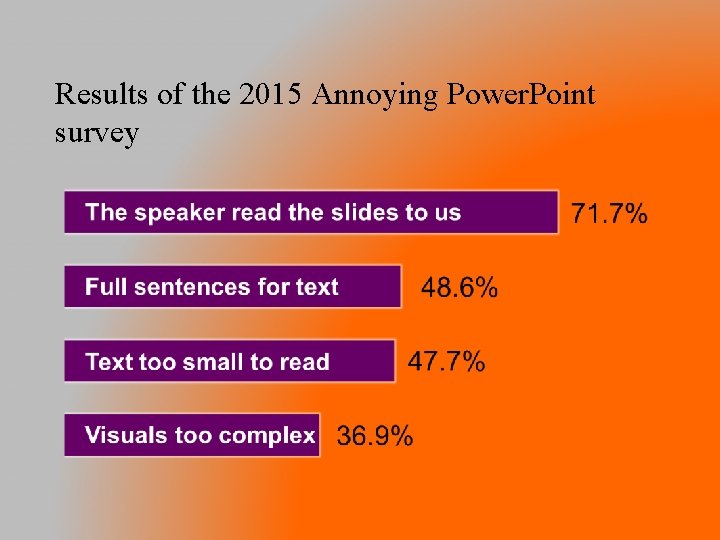
“It continues to amaze me how many presenters read their slides to the audience. In every one of the seven surveys I have conducted this is clearly the single most annoying thing a presenter can do. Why does this happen so often? The overload of text on slides is the primary culprit. That is why the second and third most common answers in the survey on what annoys audience about bad Power. Point presentations are related to filling the slides with text. ” -“Results of the 2015 Annoying Power. Point survey”
Results of the 2015 Annoying Power. Point survey
Results of the 2015 Annoying Power. Point survey
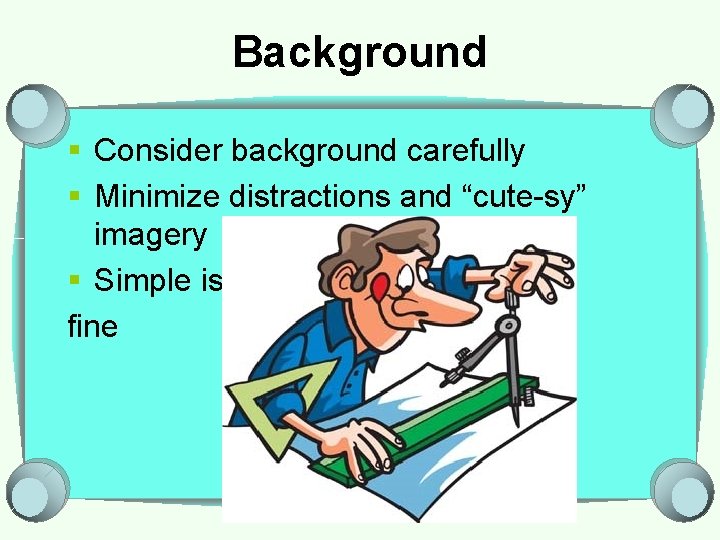
Background § Consider background carefully § Minimize distractions and “cute-sy” imagery § Simple is fine
See what your audience sees Simple is fine n Choose minimal designs n Do not distract from content n
Animation is cool! *No it is not *It is unprofessional *Adds unnecessary complexity *Smart animation can be fine
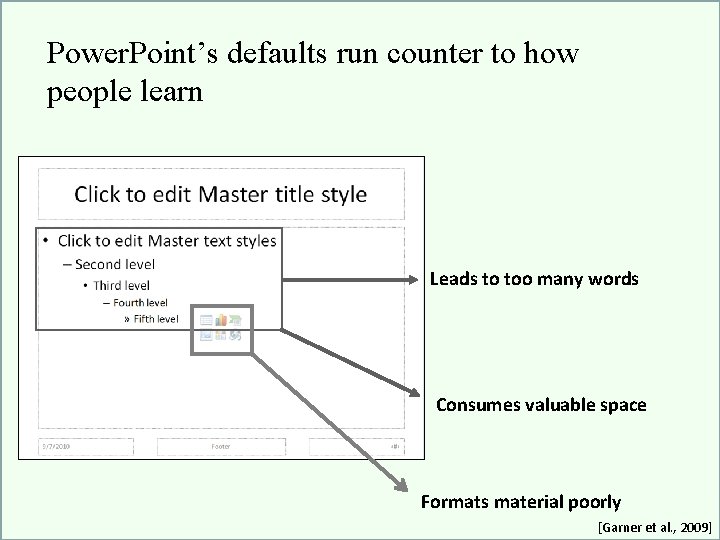
Power. Point’s defaults run counter to how people learn Leads to too many words Consumes valuable space Formats material poorly [Garner et al. , 2009]
What should you start with? CONTENT Adapted from the Assertion-Evidence Method from Michael Alley at Penn State
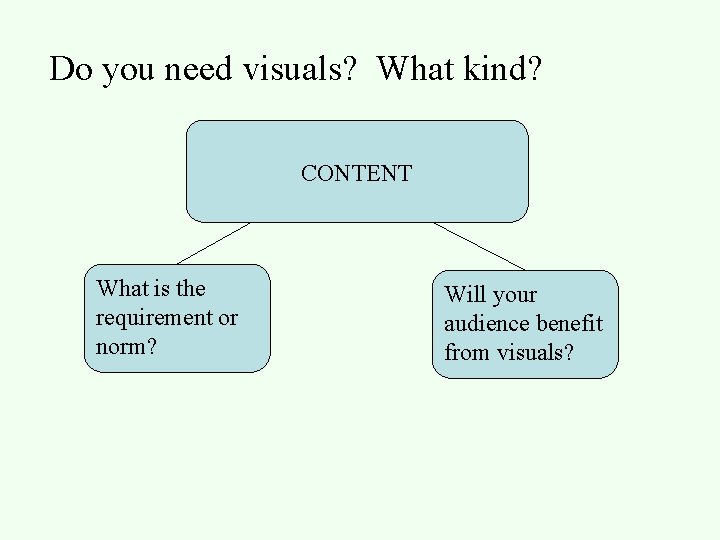
Do you need visuals? What kind? CONTENT What is the requirement or norm? Will your audience benefit from visuals?
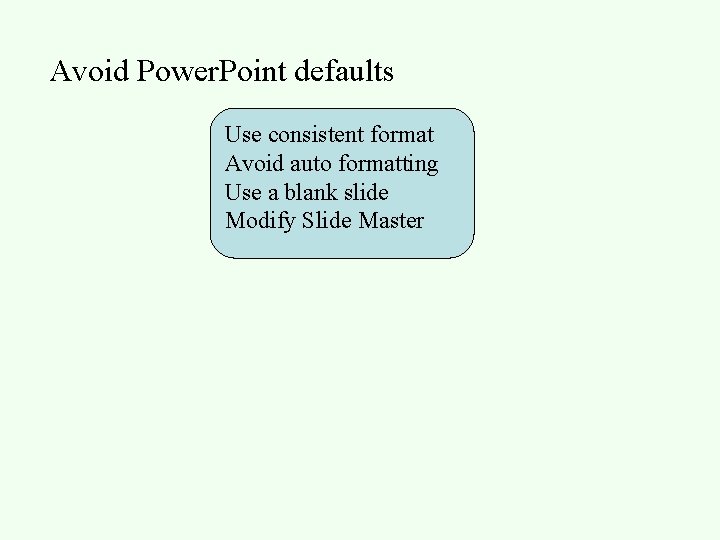
Avoid Power. Point defaults Use consistent format Avoid auto formatting Use a blank slide Modify Slide Master
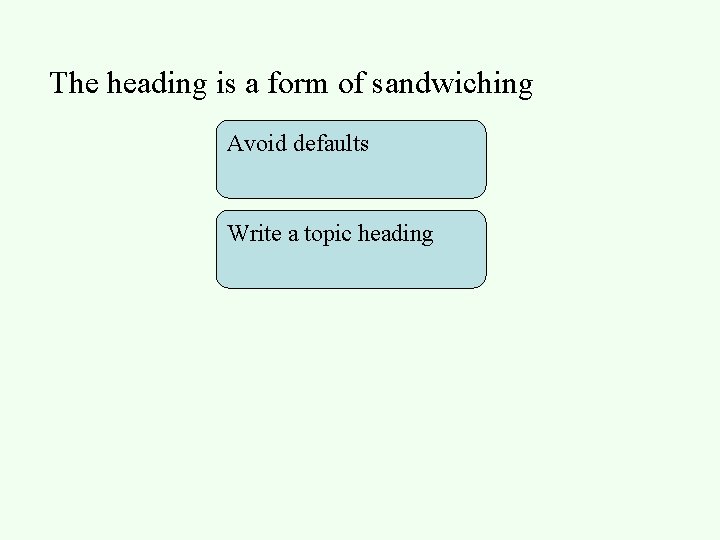
The heading is a form of sandwiching Avoid defaults Write a topic heading
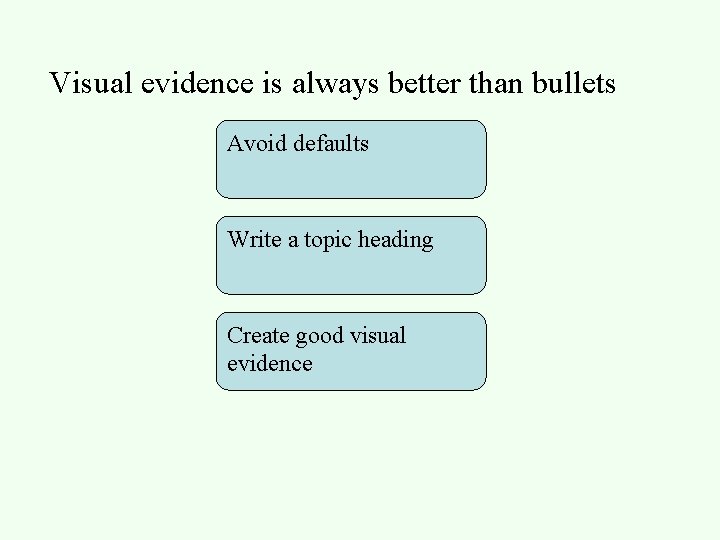
Visual evidence is always better than bullets Avoid defaults Write a topic heading Create good visual evidence
But what if you do not have a visual? Avoid Defaults Write a topic heading Create good visual evidence Use bullets sparingly or use a blank screen
Presentation of Materials: Slides --Consider from audience’s point of view --Simplify message to essential information --Be consistent with the amount of material --Plan and revise as a team --Reduce bullet points as much as possible
Slides are for your audience --Simplify bullets --Be consistent --Reduce text
Do you need bullet points?
Questions on using Power. Point
3. Creating Strong Visuals
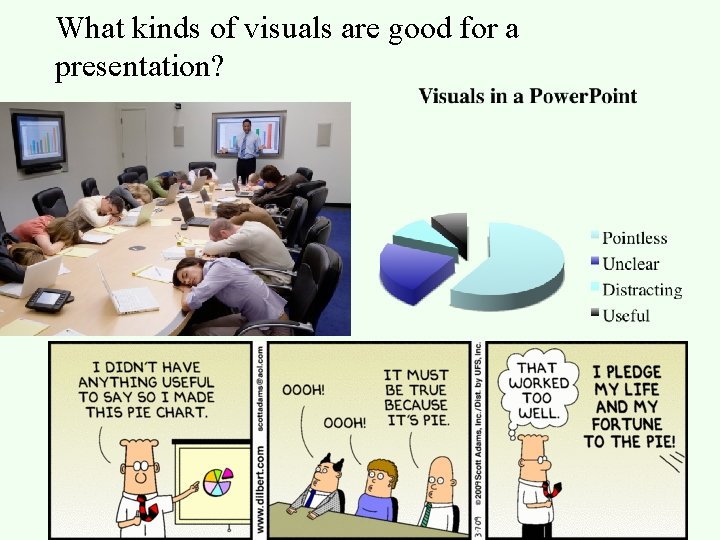
What kinds of visuals are good for a presentation?
Good graphics are good ethics IEEE Code of Ethics: 3. to be honest and realistic in stating claims or estimates based on available data NSPE Code of Ethics III. 1. A. Engineers shall acknowledge their errors and shall not distort or alter the facts.
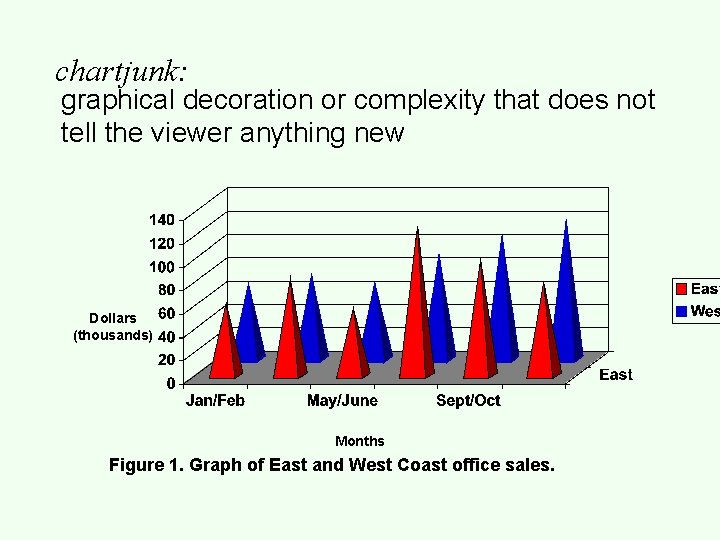
chartjunk: graphical decoration or complexity that does not tell the viewer anything new Dollars (thousands) Months Figure 1. Graph of East and West Coast office sales.
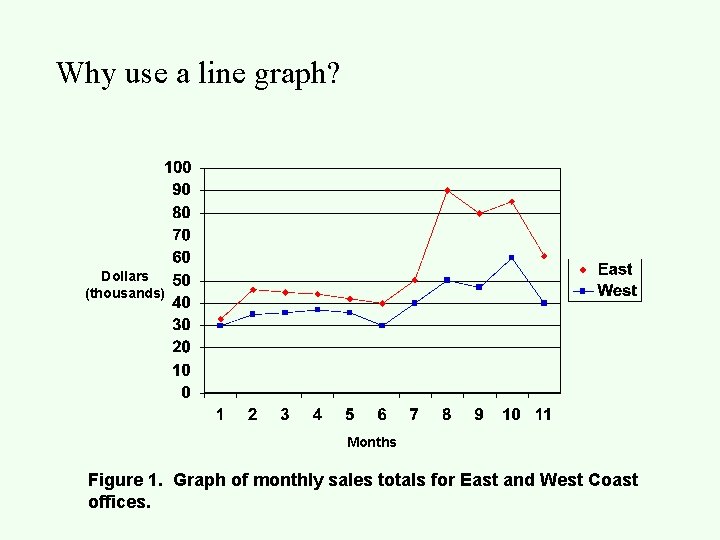
Why use a line graph? Dollars (thousands) Months Figure 1. Graph of monthly sales totals for East and West Coast offices.
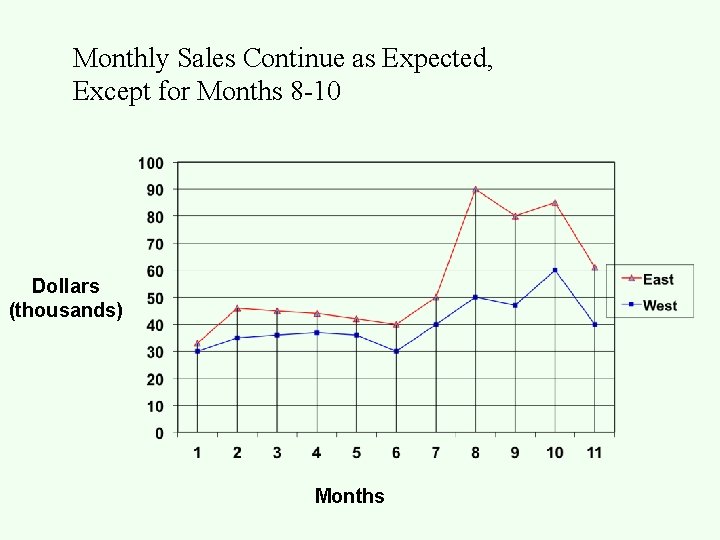
Monthly Sales Continue as Expected, Except for Months 8 -10 Dollars (thousands) Months
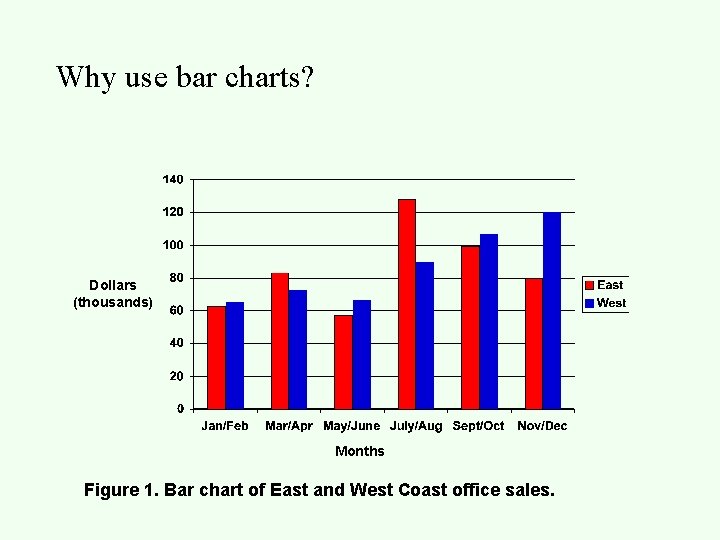
Why use bar charts? Dollars (thousands) Months Figure 1. Bar chart of East and West Coast office sales.
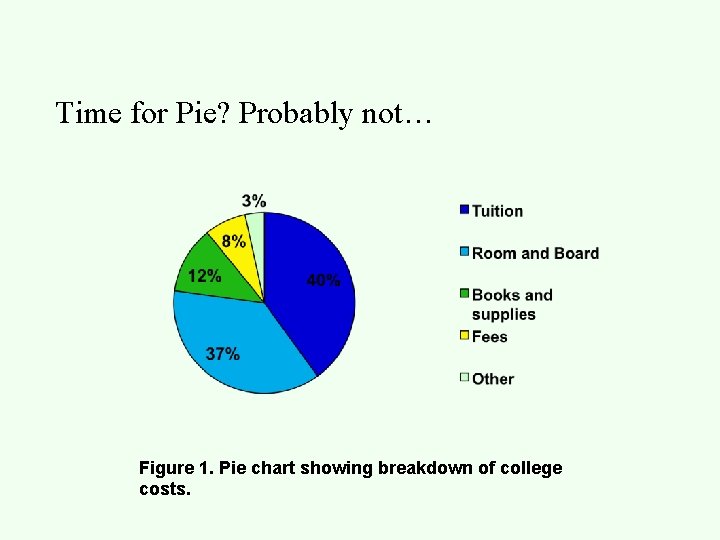
Time for Pie? Probably not… Figure 1. Pie chart showing breakdown of college costs.
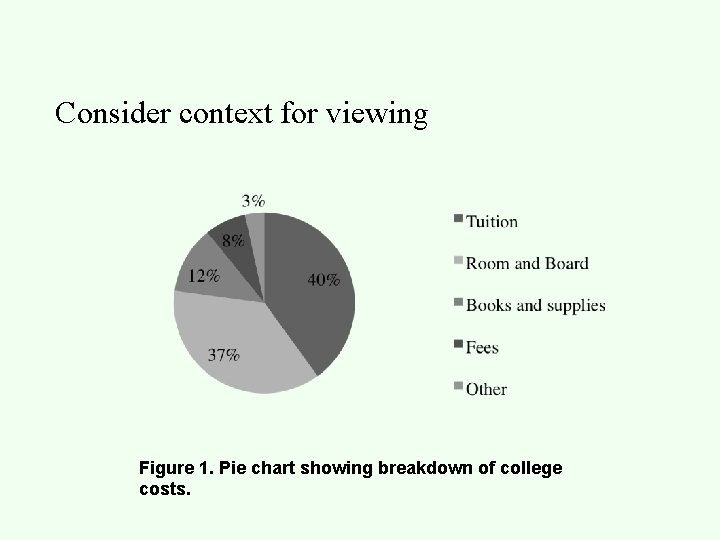
Consider context for viewing Figure 1. Pie chart showing breakdown of college costs.
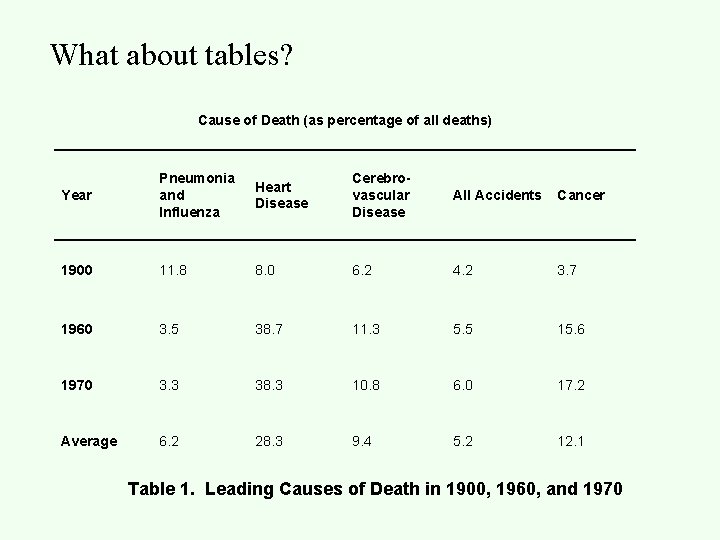
What about tables? Cause of Death (as percentage of all deaths) Year Pneumonia and Influenza Heart Disease Cerebrovascular Disease All Accidents Cancer 1900 11. 8 8. 0 6. 2 4. 2 3. 7 1960 3. 5 38. 7 11. 3 5. 5 15. 6 1970 3. 3 38. 3 10. 8 6. 0 17. 2 Average 6. 2 28. 3 9. 4 5. 2 12. 1 Table 1. Leading Causes of Death in 1900, 1960, and 1970
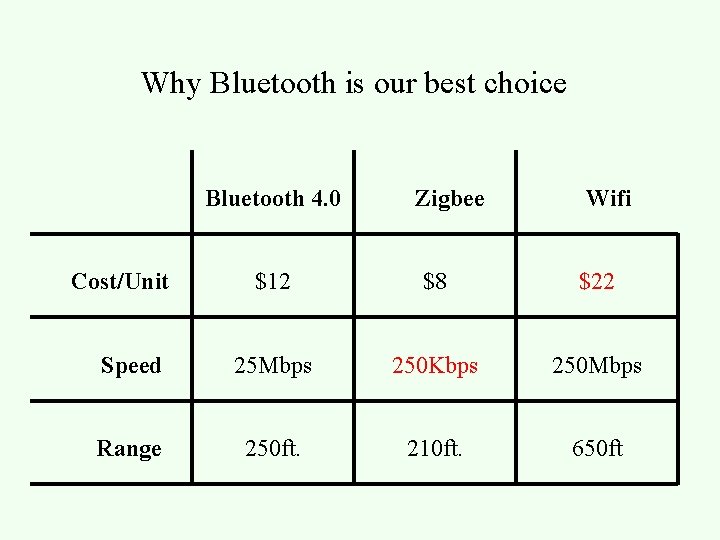
Why Bluetooth is our best choice Bluetooth 4. 0 Cost/Unit Zigbee Wifi $12 $8 $22 Speed 25 Mbps 250 Kbps 250 Mbps Range 250 ft. 210 ft. 650 ft
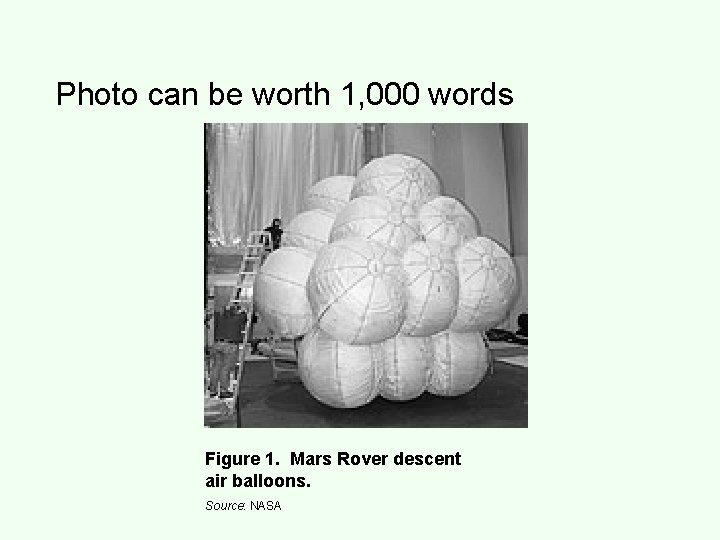
Photo can be worth 1, 000 words Figure 1. Mars Rover descent air balloons. Source: NASA
But also can get you in trouble… Source: http: //www. richincomeways. com/net-worths/10 -expensive-lawyers -usa/
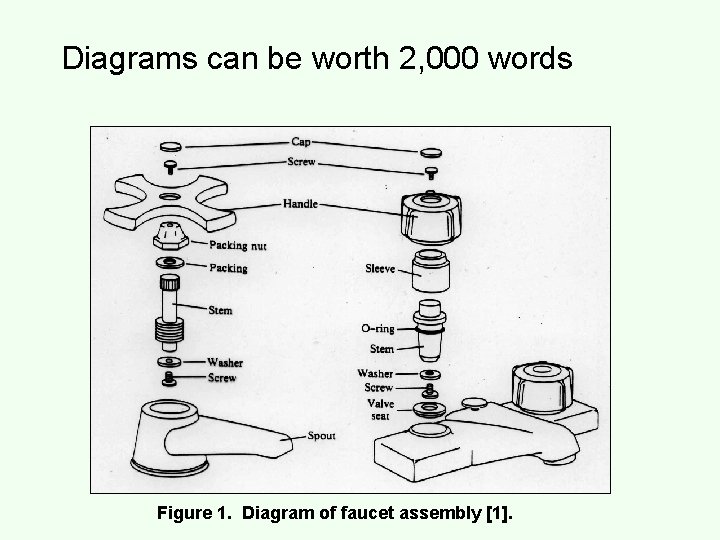
Diagrams can be worth 2, 000 words Figure 1. Diagram of faucet assembly [1].
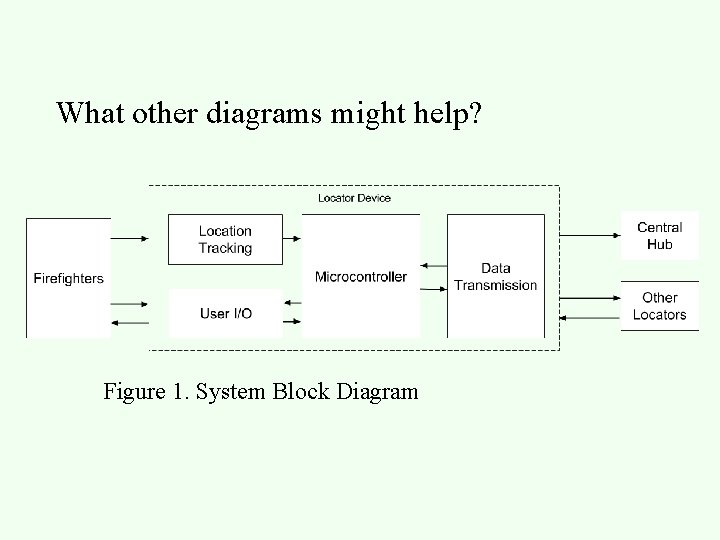
What other diagrams might help? Figure 1. System Block Diagram
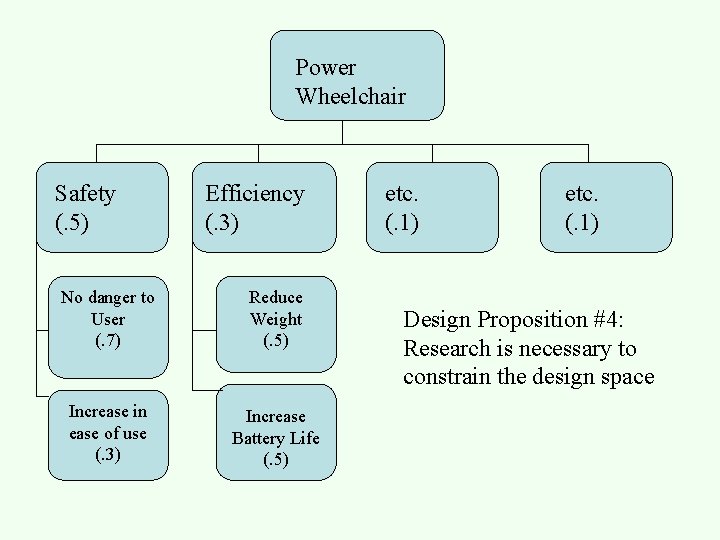
Power Wheelchair Safety (. 5) Efficiency (. 3) No danger to User (. 7) Reduce Weight (. 5) Increase in ease of use (. 3) Increase Battery Life (. 5) etc. (. 1) Design Proposition #4: Research is necessary to constrain the design space
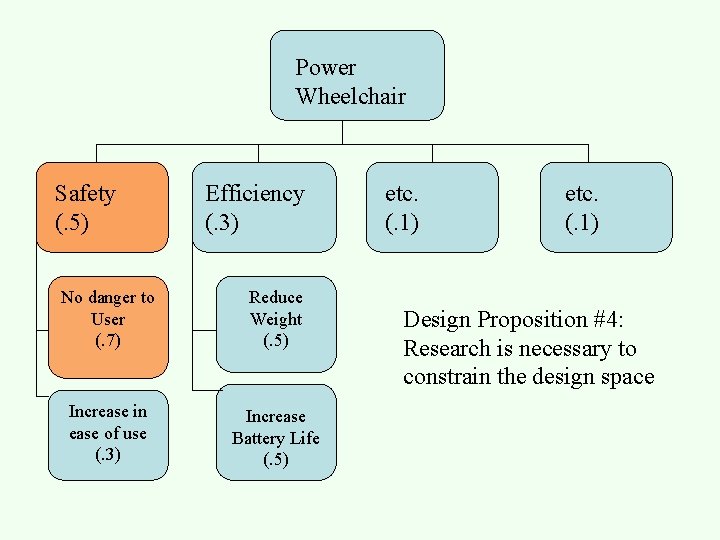
Power Wheelchair Safety (. 5) Efficiency (. 3) No danger to User (. 7) Reduce Weight (. 5) Increase in ease of use (. 3) Increase Battery Life (. 5) etc. (. 1) Design Proposition #4: Research is necessary to constrain the design space
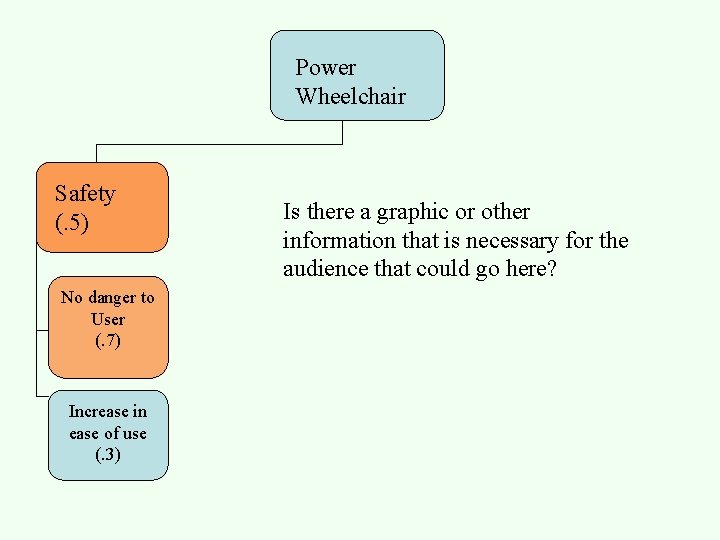
Power Wheelchair Safety (. 5) No danger to User (. 7) Increase in ease of use (. 3) Is there a graphic or other information that is necessary for the audience that could go here?
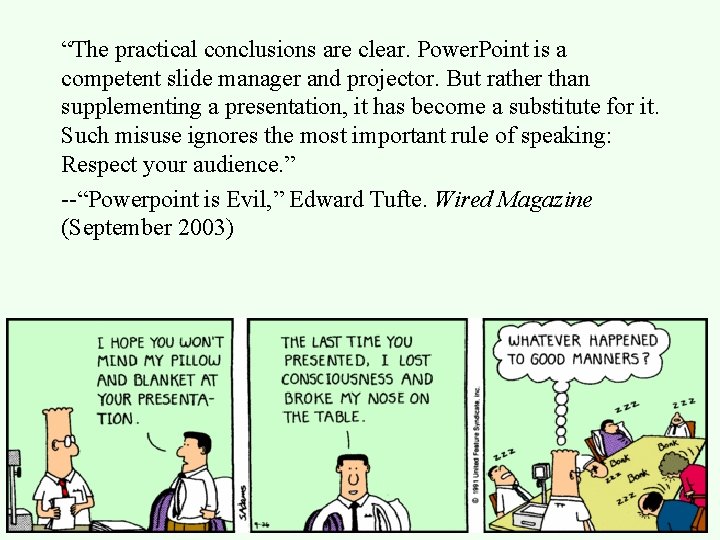
“The practical conclusions are clear. Power. Point is a competent slide manager and projector. But rather than supplementing a presentation, it has become a substitute for it. Such misuse ignores the most important rule of speaking: Respect your audience. ” --“Powerpoint is Evil, ” Edward Tufte. Wired Magazine (September 2003)