PREPARING OUR GRADS TO BE COLLEGE CAREER LIFE

PREPARING OUR GRADS TO BE COLLEGE, CAREER & LIFE READY Amber Brundage & Alyssa Lipinski 9/20/16

Advance. Organizer • Early Warning Systems Overview – Context • National & Florida Data • Predictive Indicators – History & Research • High School • Middle School • EWS Implementation – Determining Heath of the Building • Disproportionality • Problem Solving

EWS Overview

Context for Early Warning Systems • In order for students to graduate career, college, and life ready they must: – Successfully navigate academic transitions – Acquire academic enabling behaviors • Attend • Behave • Complete work • 50% of future non-graduates readily identifiable as early as 6 th grade (Balfanz, Herzog & Mac Iver, 2007) • Early warning systems provide a mechanism for early identification of those students who signal they are not ontrack for on-time graduation (Balfanz & Stenson, 2012) • Supported by America’s Promise Alliance • My Brother’s Keeper Initiative
: – Use readily")
The “Promise of Early Warning Systems” • Early Warning Systems (EWS): – Use readily available data typically collected at the school-level – Allow educators to hone-in on key pieces of data to inform decisions – Provide “real-time” data for monitoring – Allow districts to identify patterns, trends and school effectiveness at keeping students on-track – Identify at-risk students who are likely to experience adverse outcomes early enough to alter student trajectories (Davis, Herzog, & Legters, 2013)

Early Warning Indicators versus Early Warning Systems Early Warning Indicators • Individual predictors and thresholds utilized to indicate student level of risk or likelihood of a given outcome: – Missing more than 10% of instructional time – 1+ ISS/OSS – Course performance Early Warning Systems • Organized system where: – Struggling learners or students at -risk are identified – Interventions are providedmatched to student need with varying intensity levels – Individual and aggregate-level progress is monitored

Infrastructure Necessary to Effectively Utilize EWS • Development of user-friendly/efficient data system • High quality and accurate data entry • Designated EWS teams with dedicated meeting time – District – School • Staff professional development/support for analysis of data • Resource allocation • MTSS framework • Data-based problem-solving

History and Research on Early Warning Systems
: On.")
Early Warning Systems High School • 1999 Consortium on Chicago School Research (CCSR): On. Track Indicator (OTI)accurately predicted 80% of those who would graduate on-time based on 9 th grade: • Number of Fs • Number of credits earned (Allensworth & Easton, 2005) • Background characteristics (race/ethnicity, SES, previous test scores, age, mobility) only predicted 65% of on-time graduates • Adding background characteristics to OTI only increased predictive ability by 1% above and beyond Fs and Credits • Background characteristics important: – Relationship with course performance which impacts course failures and credits earned We cannot monitor or impact all the background factors students bring BUT we can monitor and impact course performance

Course Failures & Attendance As Predictors • When researchers examined why students failed courses: – Student behaviors: attendance & study habits (engagement indicators) accounted for the majority of course failures • Consistent across achievement and SES levels • 2007 CCSR found GPA and attendance as predictive as Fs and credits – Allowed for more timely monitoring • 2014 CPS graduation rate of 69% – Projected rate 84% for 2018

National High School Center EWS Indicators • 2008 National High School Center created high school EWS to automatically flag students off-track for graduation based on: • Earning less than ¼ total credits required for graduation minus 1 per semester • Less than 2. 0 GPA • Missing 10% or more absences • Failing two or more courses (Heppen & Therriault, 2008)

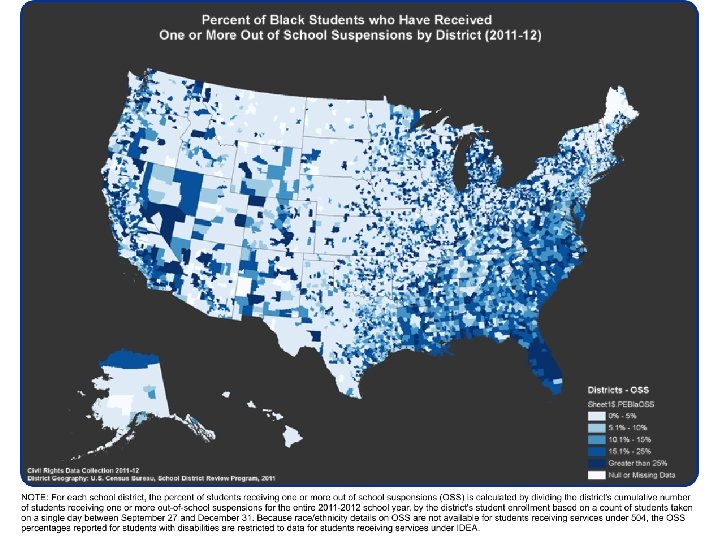
Middle School Early Warning Systems Background • Researchers followed a Philadelphia cohort of almost 13, 000 6 th graders for 8 years to find middle school predictors of non-graduates (Balfanz, Herzog, & Mac. Iver, 2007) • Based on 2 pronged test- 75+% of 6 th graders with indicator didn’t graduate on-time AND identified substantial number of future nongraduates: • Failure of math or English • 20+% absences • 1 out of school suspension or failing behavior grade

Middle School EWS Background Continued • 2011 Baltimore schools replicated the Philadelphia research with cohort of ~8, 000 students • Baltimore researchers used the following indicators that predicted 70+% non-grads: – 10+% absences – Failing English and math or failing average for core courses – Overage for grade – Suspensions of 3+ days

National High School Center Middle School EWS Indicators • 2011 National High School Center adapted EWS for middle school utilizing following indicators: – Failing English or math – Locally defined behavior indicators – 20% or more absences per year (Heppen & Therriault, 2008)

Middle Grade Indicators of High School and College Readiness • CCSR released a report in 2014 outlining critical middle grades indicators for high school and college readiness: – Grades/GPA • Strongest predictor of on-track status in high school and earning high grades – Only those with GPA greater than 3. 0 had moderate chance of earning A’s & B’s in high school – 61% of 8 th graders with GPA of at least 3. 5 earn A’s and B’s in 9 th – 90% of 8 th graders with GPA >3. 5 finish 11 th grade with GPA necessary for a somewhat selective college – Attendance • Improves predictive ability of high school performance beyond grades • Much more predictive of passing high school classes than test scores Allensworth, Gwynne, Moore, de la Torre, (2014)

Pasco County District Implementation Process

What did we Learn from the Pasco EWS study? • Consistency between Pasco and national data. • On-track/off-track status in 9 th grade and earlier accurate predictor. • Attendance is primary and most critical factor explaining drop Brundage, 2013 out. – Suspension is another predictor – Failures/GPA are other predictors – Yet…standardized tests were not predictors • Importance of using “multiple data factors”. Internal systems analysis: • Inconsistent, non-unified, un-standardized data system of collection and monitoring for all and at-risk students • Variation in problem-solving teaming and practices, planning for tiered supports, and decision-making at all levels esp. secondary

Challenges and Solutions • PK-12 Solution translatable to SIS/LIIS • Consensus among staff about transition • School-Based teams and leaders (WHO) • Dedicated Common, Standardized, Centralized data system with intentional planning of time and processes for analyzing and using data to inform decisions at district, school, and classroom levels (TOOLS) • Common approach to problem-solving/data analysis and use that is connected to defined actions for teachers, parents, and students (Inquiry/PS Process)

Focus on What: Diagnostic Practices Early Warning Systems plus Standards PK-12 early warning systems (EWS) aligned with standards – using readily available data to: • Predict which students are at-risk for dropping • Target resources to support off-track students while they are still in school, before they drop out • Examine patterns, identify school climate issues Compelling why for a PK-12 System What do we know about EWS? 50% accurate by 3 rd 65% accurate by 7 th 90% accurate by 9 th

EWS Implementation Journey 1. Initial indicator study 2. Development of district EWS steering committee 1. Vision 2. Determination of Indicators 1. Aligned K-12 3. Development of data system 1. Continuous refinement 3. Development of user-group 1. Update & feedback sessions 1. Multi-year 4. Targeted professional development 1. Multiple groups/methods 5. Data evaluation

Initial Indicator Study • 4, 000 students were followed from 2007/20082011/2012 who met the inclusion criteria: – Enrolled in sixth grade during the 2007/2008 school year – Enrolled for four out of five possible years from sixth through tenth grade (2007 -2012) • Included multiple school and student-level variables to predict off-track status (DV) – Background Factors, Academic and Behavioral Factors, Previous Off-track Status.

Indicator Study Results: Across Time Points – Background Factors • SES Level: Eligibility for free or reduced lunch price increased likelihood of Off-track Status • Racial/Ethnic Designation as Hispanic: Designation as Hispanic was associated with increased likelihood of Offtrack Status – Hispanic & ODRs – Academic/Behavioral Factors • GPA: Every 1. 0 increase in GPA was associated with decrease in likelihood of Off-track Status • ODRs: Every one unit increase in ODRs was associated with increased likelihood of Off-track Status – Off-track Status • Previous Off-track Status: Previous Off-track Status increased likelihood of Off-track Status

On/Off Track Graduation Outcomes Grade On-Track Off-Track On. Time GED Not On- DO Time WD On. Time GED Not On. Time DO WD 6 th 78% 1% 9% 1% 11% 49% 5% 25% 5% 17% 7 th 78% 1% 9% 1% 11% 41% 6% 29% 6% 19% 8 th 80% 1% 8% 1% 10% 47% 4% 25% 5% 19% 9 th 79% 1% 8% 1% 11% 50% 5% 24% 4% 16% 10 th 83% 1% 7% . 6% 8% 60% 3% 20% 3% 13% On-Time = 4 yr Grad, Not On-Time= 5 yr Grad, DO= Dropout, WD= Withdrew

Implications for Practice • Major focus on early intervention for Offtrack 6 th graders Grade Off-Track Increased Likelihood of Off. Track Status End of 10 th Grade 6 th 48% 8 th 95% 9 th 312% • Compute GPA every semester in middle school – Every 1 point GPA increase: • 51 -59% reduction in likelihood of Off-track Status in 10 th • 72 -82% reduction of the likelihood of Off-Track Status 6 th-8 th

District Steering Committee • Tasked with the development and implementation of EWS district-wide – Vision of one web-based K-12 data system to identify at-risk and off-track students • Multi-departmental representation – Student support services – Professional development – Dropout prevention – Information technology – Research and measurement

District Steering Committee • Investigation of various data systems/tools/platforms in use within the district – Surveyed all building principals • 4+ data systems/platforms that were in use depending on building level – Studied the assets, limitations and usability features of each system – Determined the optimal platform for the district based on EWS vision

EWS Indicators • Phase 1 – Used combination of national benchmarks, local research and research in other counties to determine indicators and thresholds for each indicator K-12 • Indicator versus graduation requirement (grad progress) • Phase 2 – Added indicators/thresholds based upon FL Senate Bill 850 requirements for middle grades

Centralized Data System v 5. 0

Differentiate Between EWS DATA Go to Student Data and Student List View to access. EWS based on Pasco Needs School team uses to identify, problem -solve, track students throughout year. • Catches more students than the state indicators based on our local study. • Includes at-risk level for early ID. • Includes Grad Ready Progress Bar. SB 850 Columns for state • Report in SIP in September. – Based on identified students in prior year. – Reflects trends tied to SB 850 definitions. – Assists in targeting tiered strategies. • Middle schools meet with parents.

Graduation Progress Bar Encompasses Requirements for Graduation

Entry Points • Early Warning Indicators/System - Evidence of consensus/understanding in your District? - Opportunity for growth/on ramps? • District Steering

TARGETED PROFESSIONAL DEVELOPMENT

Establishing the Vision: How do we do it? Establish a laser-like focus on the end in mind MAXIMIZE POST-SECONDARY OPTIONS FOR ALL STUDENTS Align ALL resources toward accomplishing this goal including the use of: – Time – Personnel – Space – Materials – Resources
")
EWS within the Whole System (The What)
")
EWS within the Whole System (The Who)

Implementing the Inquiry Cycle Steps to Data Decision Making across PLCs School-Level Problem-Solving PLC Attendance Are students at school? Behavior Are students adhering to rules, routines, expectations? Academics Are there school trends* that need to be communicated to inform classroom PLCs? Course Performance (Credits, GPA) School-wide standards. Based Assessments Content/Strategy PLCs Benchmark Assessments Unit Assessments Classroom Assessments Formative Assessments *by grade, content area, subgroup (students with disabilities, minorities, etc. )

Targeted Professional Development • High school administrators – Rationale – Development – Demonstration – Opportunity to practice with their data – Opportunity to provide feedback – Assigned a case-manager

Targeted Professional Development • Elementary and secondary administrators • Student services teams and support staff – Rationale – Development – Demonstration – Opportunity to practice with their data – Opportunity to provide feedback

Targeted Professional Development • School based teams as part of 3 session series on PLC’s – Developing school level PLCs and teaching problem-solving within the context of EWS/MTSS – Creating Functional Teams – Identifying and establishing plans for intervening and plans for screening/monitoring – Using EWS with other school-wide data to assess the overall health of a school

Learning Outcomes • Goal: Use Pasco. STAR to access school and individual data in effective, efficient ways. In order to problem-solve most at-risk students. • Products: Bring back to school team (PS PLC/SLT): – “Health” of school (EWS Scorecard) – Most at-risk kids • Like groups of students based on need • Students with disproportionate representation – Scope and root causes of identified problem – Ideas about intervention supports

Important Data Sources for School Teams Problem-ID: Health of the School and more How do I look at the overall School Health? • Beginner: School Data/Profile Page (District, School Users) – View trends in current year – Compare to individual schools/regions – *Access historical data (back to 2013 -14 school year) • Basic: EWS Scorecard* – – View trends across quarters Identify disproportionate risk groups Compared individual schools to other schools and district Monitor progress of schools with graphs How do I identify the most at-risk students? • Advanced: Student List View (District, School Users) – – – View trends by individual students in current year Group, sort, and filter for any variable (subgroup, program, EWS) Drill down to class and teacher Export reports based on problem-solving questions *Access historial data (back to 2014 -15 school year)

School Profile Page 1. Click on School Profile in the School Data Menu. 2. Select region and/or school from drop down menu. 3. Click on the At-Risk/EWS icon.

School Profile Page 4. Drag and drop icons to sort and filter data Notes: Additional data sources have been added for demographic information. Hover graphs to view number and percentage by indicators. 5. Click year menu to view and compare prior year data.

Student List View 1. Click on School List in the Student Data Menu. 2. Select school from drop down menu. 3. Select pre-built filter and/or layouts based on need.

Student List View 4. Scroll to desired columns 5. Right click or type desired filter (e. g. , off-track). 6. Record # of records for that filter 7. Review and/or export student names.

EWS Scorecard School Health and Risk Ratios by Quarter 4. Click tabs to view Risk Ratios for subgroups by Quarter Risk Ratios are calculated as: # students off-track in a subgroup/# students off-track in the school divided by Total # students in the subgroup/Total # students in the school. For Risk Ratios, cells are highlighted based on: Yellow when Risk Ratio is 1. 5 -2. 49

EWS Scorecard School Health Graphs by Quarter 5. Click tabs to view % EWS for each Indicator by Quarter Note: The bar graphs reflect % of students on-track, at-risk, and offtrack based on quarterly indicator definitions in course performance, attendance, and discipline. (this aligns with the Q 1, Q 2, Q 3, Q 4 columns on the Student List View. ) Application: Look at each distribution of EWS indicators by quarter. What are trends within and across indicators? What are trends over time across quarters?

EWS Scorecard School Health Graphs by Quarter 6. Click tabs to view % on-track for each Indicator by Quarter and Year Note: The first 4 bars in the graph reflect % of students on-track based on the quarterly indicator definitions in course performance, attendance, and discipline. The last bar reflects % of students on-track based on the EWS indicator definitions for the year (please see slide 3). The quarter bars show EWS data chunked by quarter timepoints and are intended to track growth. The year bar is a running % intended to project end of year status. Application: Look at % of students on-track by quarter. What are the trends within and across indicators? How do the quarter % compare to the year %?

EWS Scorecard School Health Graphs by Quarter 7. Click tabs to view % off-track for each Indicator by Quarter and Year Note: The first 4 bars in the graph reflect % of students off-track based on the quarterly indicator definitions in course performance, attendance, and discipline. The last bar reflects % of students on-track based on the EWS indicator definitions for the year (please see slide 3). The quarter bars show EWS data chunked by quarter timepoints and are intended to track growth. The year bar is a running % intended to project end of year status. Application: Look at % of students off-track by quarter What are the trends within and across indicators? How do the quarter % compare to the year %?

Student Interaction Log Uses • The Student Interaction Log can be used for: – Recording positive behavior occurrences – Recording minor discipline incidents – Submitting online discipline referrals – Documenting intervention plans (such as TBIT/SBIT) • Also may upload documents such as 504 and IEPs. – Monitoring outcomes of tiered interventions – Recording and monitoring parent communication • Specifically for tracking SB 850 requirements – Any other event that incorporates problem-solving and intervention plans at the individual student Note: all data are dummy data. level
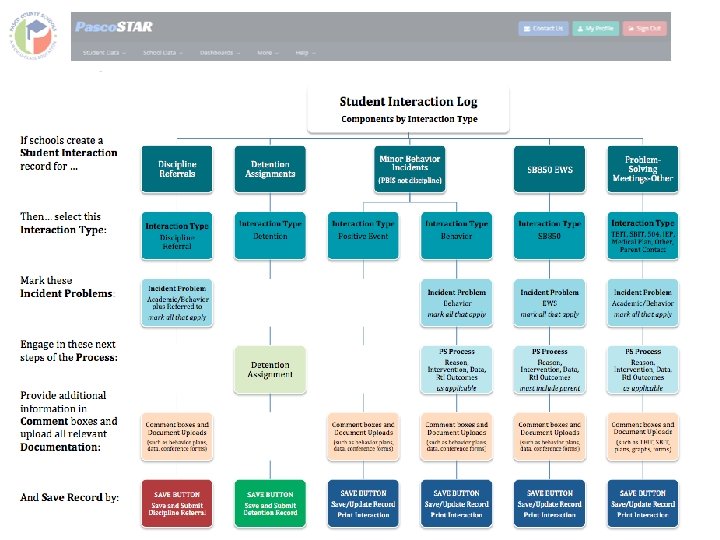

Student Interaction Log Example Print Out for Records • For SB 850, acts as a record of parent conference with strategies to target identified areas. • For all other uses, acts as documentation for history of areas of need and matched interventions, minor and/or positive behavior incidents, parent communications and associated graphs/forms (such as for 504, SBIT, etc. ) Note: all data are dummy data.

Student Interaction Log to Process Discipline or Detention Then click the Save and Submit to buttons.

Student Interactions Grid Trends in school interactions can be sorted/filtered many ways. • Filter and sort by type of intervention and then by type of response (see right example). • Can also filter by any interaction field and then by demographic information in the same list (see below example).

EWS within the whole system: Making Connections • Consider systems - Making connections to current work • Professional Development - Targeted selected groups - Systematic roll out of PD • Common approach to problemsolving/data analysis? • Next Steps?

PATHWAYS TO SUCCESS Creating Supportive Learning Environments For All Students
")
Pasco County Schools Risk of being Off-Track in the Area of Discipline (2014 -15) For Students who are Black and White Black White For all Students with Disabilities Yes No For Students with Disabilities who are Black and White Black White
")
Pasco County Schools Risk of being Off-Track in the Area of Discipline (2014 -15) For students who are Black and White Black White For all 504 students Yes No For 504 students who are Black and White Black White

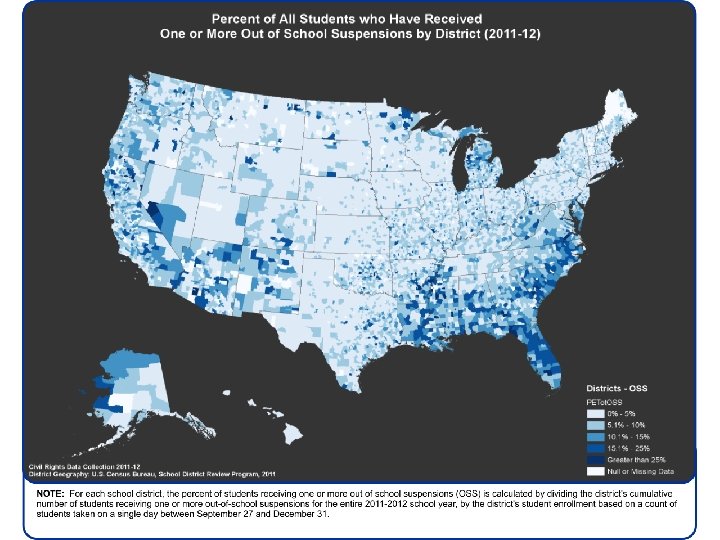
Pasco County Schools Out of School Suspension Data 2014 -15 School Year Risk Ratio by Race/Ethnicity 2, 5 2, 03 2 1, 5 1, 32 1, 01 1 0, 87 0, 63 0, 5 0 Race White Asian Mixed Hispanic Black

Pasco County Schools Drop Out Rates

5 Whys Approach to Problem-Analysis PROBLEM-SOLVING WITH THE DATA

5 Whys • Analysis to uncover root causes • Ask why 5 times to deeply understand the problem

SAMPLE: 5 -Why Analysis – ABC Distribution Center Problem Statement: Wrong item shipped to customer The wrong item was pulled from inventory Why? The item we pulled from inventory was mislabeled Why? Our supplier mislabeled the item prior to shipping it to our warehouse The individual applying labels to our product at the supplier placed the wrong label on the product Why? Labels for different orders are pre-printed, and it is easy to apply the wrong label

Why? The wrong item was pulled from inventory “Retrain our stock pickers” – almost no benefit – this solution has nothing to do with the true cause

Why? The item we pulled from inventory was mislabeled “Inspect our inventory” – minimal benefit – applies to current stock only

Why? Our supplier mislabeled the item prior to shipping it to our warehouse “Have the supplier sort their stock to contain the problem” – very limited long-term benefit

Why? The individual applying labels to our product at the supplier placed the wrong label on the product “Conduct training at the supplier” – limited long-term benefit

Why? Labels for different orders are pre-printed, and it is easy to apply the wrong label “Mistake-proof the label printing and application process” – highly effective

5 -Why Analysis – Sample Elementary School Problem Statement: Student writing proficiency declined dramatically between 2012 and 2013. Why? Students were inadvertently denied an opportunity to master writing skills Why? The writing block was eliminated to fully integrate writing across the curriculum, resulting in fewer opportunities for student feedback and revision. Teachers reported not being sure HOW to provide feedback, given the transition to FL standards Why? Teachers reported that PD regarding integrating writing across the curriculum was misaligned Principal, district, DA team, and teachers all had different expectations

Root cause linked to Intervention

Take Aways • Long/short term goals? - End in mind - What can you bring back tomorrow? Refinements?

Ingredients for Success • Cross-department representative EWS steering committee • Collective commitments – Aligned with district strategic plan and school improvement plans • Shared vision, mission, values, goals • Feedback loop with stakeholders – District and school (user group) – Collaborative with key district personnel/departments – Communication-Connectivity with School Board • Targeted and systematic professional development – – High schools All school leaders Alignment with SIP All schools-Problem-Solving PLC • Use of PLCs and blended learning models to communicate resources • Intentional connections with MTSS, Problem-Solving, SIP, Marzano Framework • Common, standardized data system – ongoing development • *MTSS calibration to include expectations and monitoring

Evidences of Challenges In Skills • Varying skill levels of staff to access and use the data – Managing and supporting transitions from prior systems • Professional development (especially at secondary) on MTSS – Knowledge, beliefs, and supports to establish MTSS and integrate EWS with Standards. Base – High School: relevance of Attendance and Discipline to Grad Req • Students urgency about postsecondary activities (motivation) – Supporting schools in student engagement factors and strategies In Performance • Identifying, supporting, and monitoring progress for students in e. School. • Inconsistencies in data coding and reporting. • MTSS infrastructure to support the use of the data. • Trust in the system. Worry about the reliability of the data. In Systems • Centralized data system with standardized implementation • Fidelity in data access, use, and problem-solving/decision-making • *Monitoring outcomes at school and district levels: students and implementation

. Preventing")
Additional Readings Balfanz, R. , Herzog, L. , Mac. Iver, D. , (2007). Preventing student disengagement and keeping students on the graduation path in urban middle-grades schools: Early identification and effective interventions. Educational Psychologist, 42(4), 223 -235. Balfanz, R. , Stenson, T. (2012). Using data to build early warning systems [Webinar]. United States Department of Education School Turn-around Learning Community. Retrieved from http: //vimeo. com/37739265 Brundage, A. (2013) Middle and high school predictors of off-track status in early warning systems. (Unpublished doctoral dissertation). University of South Florida, Tampa. Heppen, J. B. , & Therriault, S. B. (2008). Developing early warning systems to identify potential high school dropouts. Washington, DC: National High School Center, American Institutes for Research. Retrieved from http: //www. betterhighschools. org/pubs/ews_guide. asp

Contact Information Amber Brundage PK-12 Alignment Unit Coordinator FL PS/Rt. I Project at USF abrundage@usf. edu Alyssa Lipinski Program Coordinator, Student Services District School Board of Pasco County alipinsk@pasco. k 12. fl. us
- Slides: 84