Preparing a Groundwater Sampling Analysis Plan for a


 (New addition)")


/ Quality Control (QC) Samples")


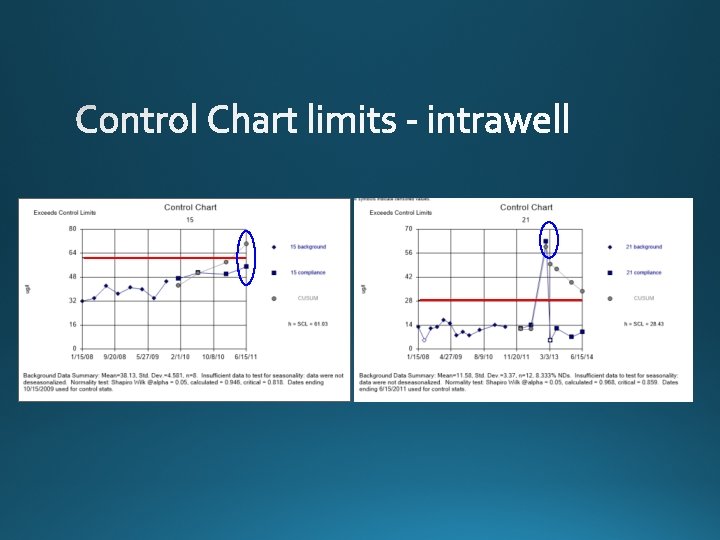
 Control Chart Limits (with Retesting) Trend Test (Contaminated BG, Unstable")


 Not Historically Detected")


- Slides: 39
Preparing a Groundwater Sampling & Analysis Plan for a Type I Landfill Overview of the groundwater sampling protocol, constituents measurements, data evaluation, and reporting requirements.
Courtesy of Phys. org
(Preferred Method) (New addition)
Make sure to specify how purge water and excess sample water will be managed and disposed of.
Purge/ Sampling Water Disposal
Document, Document… Create a form for field personnel to record: (include a copy in the GWSAP).
Field Quality Assurance (QA)/ Quality Control (QC) Samples
SPECIFY: SHOULD NOT COLD
STATISTICS!!
Statistical evaluation of monitoring data
Edward R. Tufte W. Edwards Deming
Background Wells GW flow Landfill Compliance Wells
• Collecting Data • Normality of Data Step 1 Step 2 • Outliers • Trends • Spatial Variation • Establishing Background • Updating Background Step 3
Limit - 380 Limit - 36
Prediction Limits (with Retesting) Control Chart Limits (with Retesting) Trend Test (Contaminated BG, Unstable Conditions) Confidence intervals (Assessment, Corrective Action) ANOVA for diagnostics (Identify Spatial Variation)
spatial variation lack of significant ANOVA
• Parametric: • Non-parametric:
Parametric Non-Parametric
should be normalized
Mann-Kendall • Key: trends evident in BG data Theil-Sen
Upper Limit Lower Limit • At least 4 values
Confidence Interval Trichloroethylene Data Set Limit = 5 273
• Detection • Control Charts? Good choice • • • Combining Shewhart & CUSUM portions Prediction Limits? As Good Trend Tests? Best choice for unstable/trending data • • Prediction limits, control charts assume stable data Significant, upward slope implies change in GW quality • Assessment & Corrective Action • Confidence Intervals? The only choice
Power Curves Site-Wide False Positive Rates
55% power at 3 80 -85% power at 4
55%
Sample size n=4 Sample size n=8
site-wide false positive rate
Double Quantification Rule (DQR) Not Historically Detected
• Any retesting scheme better than none
Contact Information Texas Commission on Environmental Quality P. O. Box 13087, Austin, Texas 78711 MSW Permits Section Iryna Kushnirsky iryna. kushnirsky@tceq. texas. gov 512 -239 -1471 Eric Clegg, P. G. eric. clegg@tceq. texas. gov 512 -239 -1270