Preliminary Scholastic Aptitude Test PSAT 10 Presenters Sam
 Presenters: Sam Woodrum Hunter Lancaster Bryce Gibbons")


- Slides: 18
Preliminary Scholastic Aptitude Test (PSAT 10) Presenters: Sam Woodrum Hunter Lancaster Bryce Gibbons
What is the PSAT? • Standardized test given to students to better prepare them for the SAT • • • Structure Subject matter Possible range if they were to take the SAT
Who takes the PSAT? • Students typically take the PSAT in the 9 th graders and 10 th grade • Students generally begin taking the SAT in 11 th and/or 12 th grade; some may choose to take it in 10 th grade
Where do students take the PSAT? • Usually in their middle/high school during the school day • If a student’s school does not administer the PSAT, then their school can connect them with another school that does provide that opportunity
What does the PSAT test? • Broken down into 3 subjects • • • Reading 1 Section (8 -38 range) Writing and Language 1 Section (8 -38 range) Mathematics 2 Sections (8 -38 range) • 1 that permits the use of a calculator and one that does not
How long are students given to complete the PSAT? • Total time 3: 30 ; Total testing time 2: 45 (Includes 10 minutes for breaks) • • • Reading 60 minutes Writing and Language 35 minutes Mathematics • • With calculator 25 minutes Without calculator 35 minutes
Students take the test, and then what? • Tests should be sent out to the College Board no later than the next school day • Prevents delays in receiving score reports • Students will receive their score reports approximately 2 months after submission of the test *Students can either opt-in or opt-out of the Student Search Service prior to handing in their test booklet to the test administrator
Choosing to Opt-In • • • National Merit Scholarship Corporation Student Search Service affiliations • American Indian Graduate Center, Asian and Pacific Islander American Scholarship Fund, Hispanic Scholarship Fund, Jack Kent Cooke Foundation, United Negro College Fund Other scholarship opportunities • • • National Hispanic Recognition Program National Scholarship Service Telluride Seminar Scholarships
Who receives the score reports? • 2 Forms of Score Reports • Paper-Copy (Schools receive paper-copies for dissemination to students) • • Includes original test booklet Electronic (http: //collegereadiness. collegeboard. org/) • Students must provide an e-mail address as well as create a college board account to access electronic copy of score report • • Available earlier than the paper-copy Includes additional information (i. e. AP test projections, links to study tools based on scores)
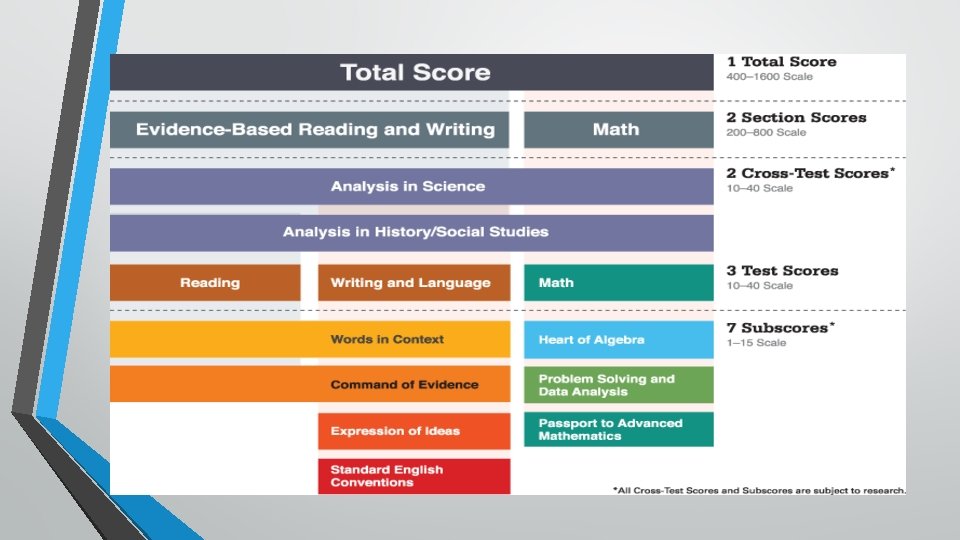
Interpreting Score Reports *Latest editions of PSAT 8/9, PSAT 10, and SAT include Vertical Scale Scores (no need to calculate any conversions) • Total score broad measure; sum of 2 sections (Evidence-Based Reading and Writing (Reading, Writing and Language) & Mathematics • 320 -1520 range • • Evidence-Based Reading and Writing 160 -760 range Mathematics 160 -760 range
Interpreting Score Reports cont. • 7 Subscores • • Specific content areas; Range (1 -15) • Expression of Ideas and Standard English Conventions Solely Writing and Language test score • Heart of Algebra, Problem Solving and Data Analysis. And Passport to Advanced Math test score Command of Evidence and Words in Context Reading test score and the Writing and Language test score
Interpreting Score Reports cont. • Cross-Test Scores (Analysis in History/Social Studies & Analysis in Science) • • Range from 8 -38 Reflect performance on items from both Evidence-Based Reading and Writing & Math sections
Interpreting Score Reports cont. • Percentiles • • Total Scores and Section Scores “How do I compare to other students in my grade? ” Electronic Score Reports • User percentile compares test-taker only to other students in the student’s grade would likely take the PSAT Paper Score Reports • Nationally Representative Sample Percentile % of students in U. S. , regardless if they took the PSAT or not
Interpreting Score Reports cont. • Section Scores, Test Scores, and Subscores • Red, Yellow, and Green-colored bar represents benchmarks for college readiness • • • Red more than a year behind college readiness Yellow Within a year of being on track for college readiness Green On track for college readiness *Benchmarks determined through large samples of data, which include students taking various assessments and attending college
Interpreting Score Reports cont. • PSAT benchmarks • Predict a 65% probability of obtaining college readiness on SAT scores. • SAT Benchmarks • Predicts a 65% probability of reaching a B- or higher GPA during a student’s freshman year of college. *Benchmarks should not discourage students!
Interpreting Score Reports cont. Moving Forward. . . • “Your Scores: Next Steps” • • • Mastered skills “Appropriate to gain” skills Score Report Chart • Item numbers, correct answers, answers given, difficulty levels, and subscore and/or crosstest scores that the item contributed to • Example Score Report
Interpreting Score Reports cont. Educators: • Effectively utilizing the data • General info. for educators