
Preliminary Design Review Eco Jet Group 2 Mike





- Slides: 29
Preliminary Design Review Eco. Jet Group 2 Mike Dumas Gaetano Settineri Adam Naramore Tim Sparks Ben Scott David Wilson
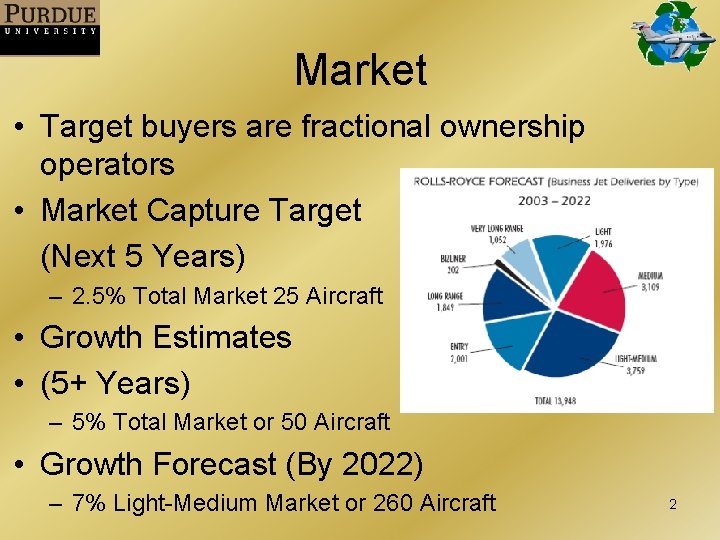
Market • Target buyers are fractional ownership operators • Market Capture Target (Next 5 Years) – 2. 5% Total Market 25 Aircraft • Growth Estimates • (5+ Years) – 5% Total Market or 50 Aircraft • Growth Forecast (By 2022) – 7% Light-Medium Market or 260 Aircraft 2
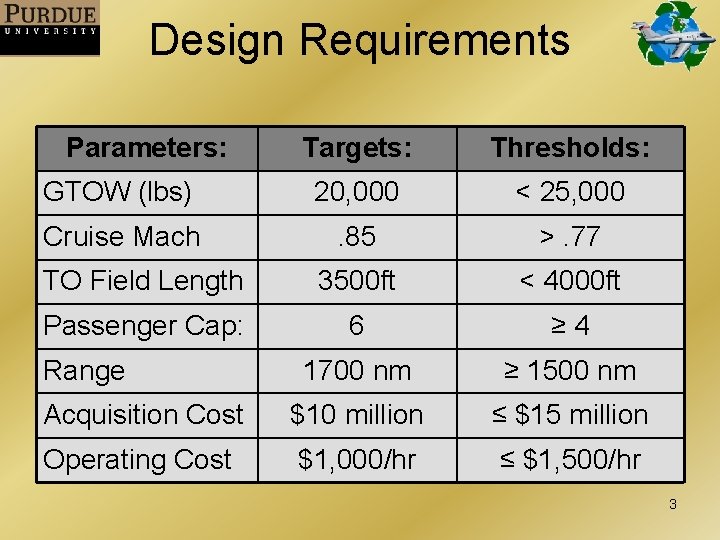
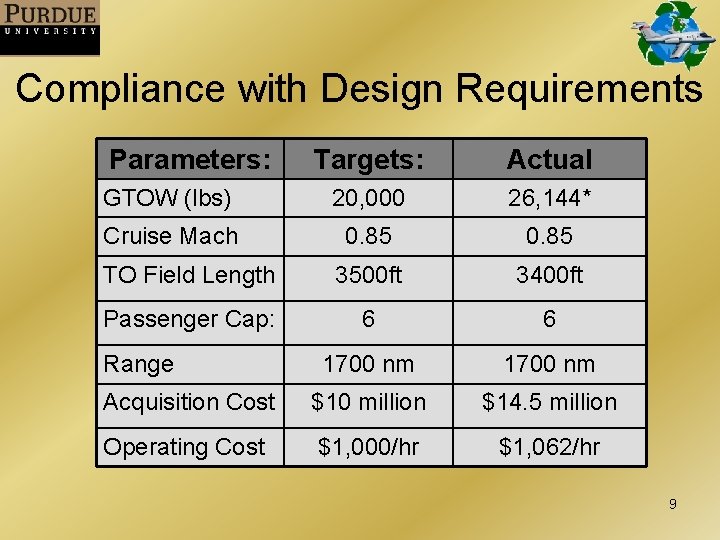
Design Requirements Parameters: Targets: Thresholds: GTOW (lbs) 20, 000 < 25, 000 Cruise Mach . 85 >. 77 TO Field Length 3500 ft < 4000 ft Passenger Cap: 6 ≥ 4 1700 nm ≥ 1500 nm Acquisition Cost $10 million ≤ $15 million Operating Cost $1, 000/hr ≤ $1, 500/hr Range 3
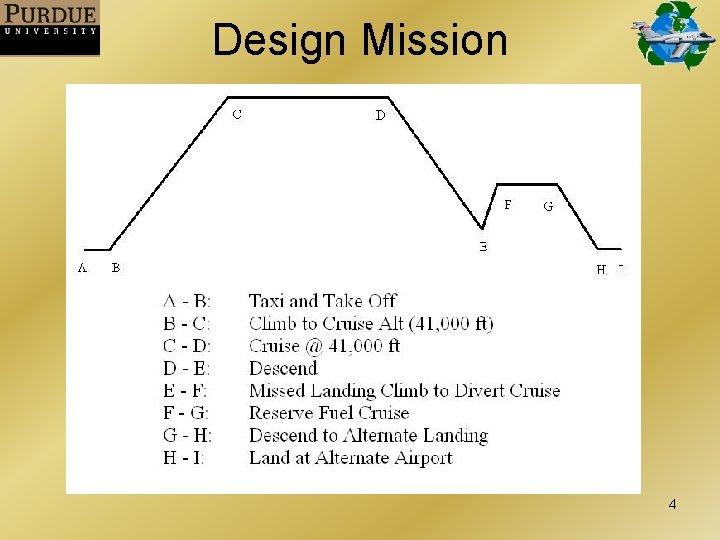
Design Mission 4
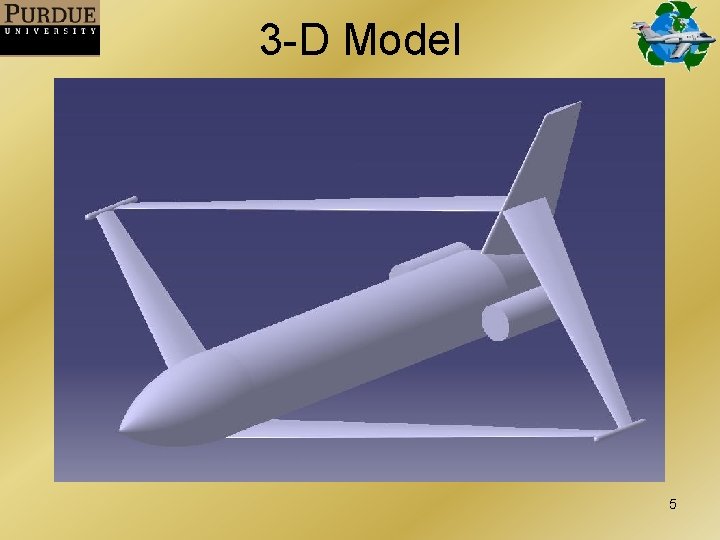
3 -D Model 5
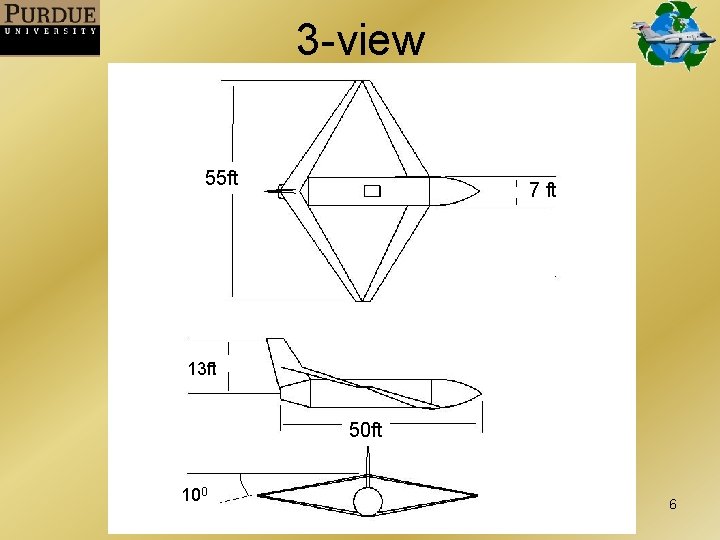
3 -view 55 ft 7 ft 13 ft 50 ft 100 6
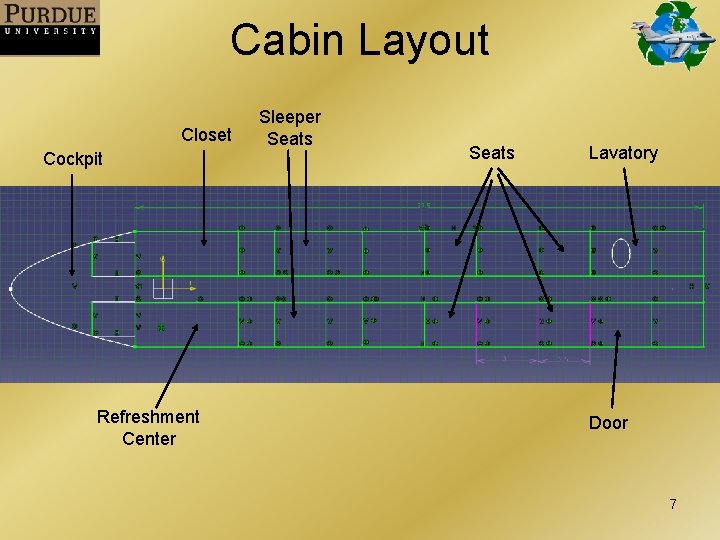
Cabin Layout Closet Cockpit Refreshment Center Sleeper Seats Lavatory Door 7
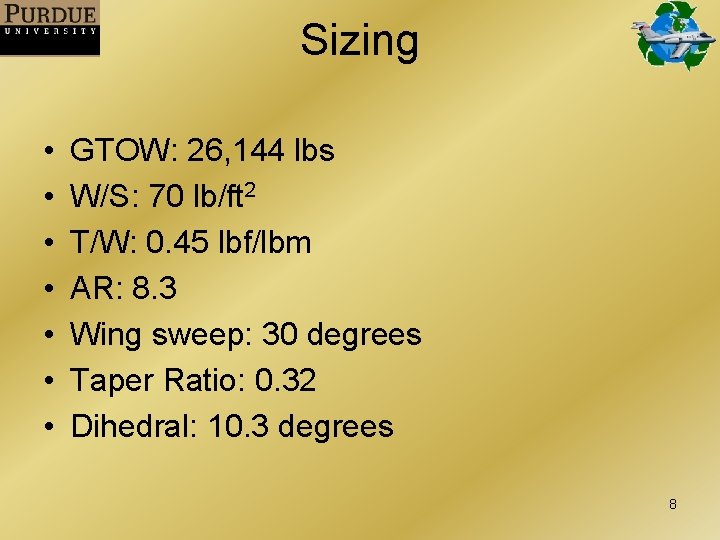
Sizing • • GTOW: 26, 144 lbs W/S: 70 lb/ft 2 T/W: 0. 45 lbf/lbm AR: 8. 3 Wing sweep: 30 degrees Taper Ratio: 0. 32 Dihedral: 10. 3 degrees 8
Compliance with Design Requirements Parameters: Targets: Actual GTOW (lbs) 20, 000 26, 144* Cruise Mach 0. 85 TO Field Length 3500 ft 3400 ft Passenger Cap: 6 6 1700 nm Acquisition Cost $10 million $14. 5 million Operating Cost $1, 000/hr $1, 062/hr Range 9
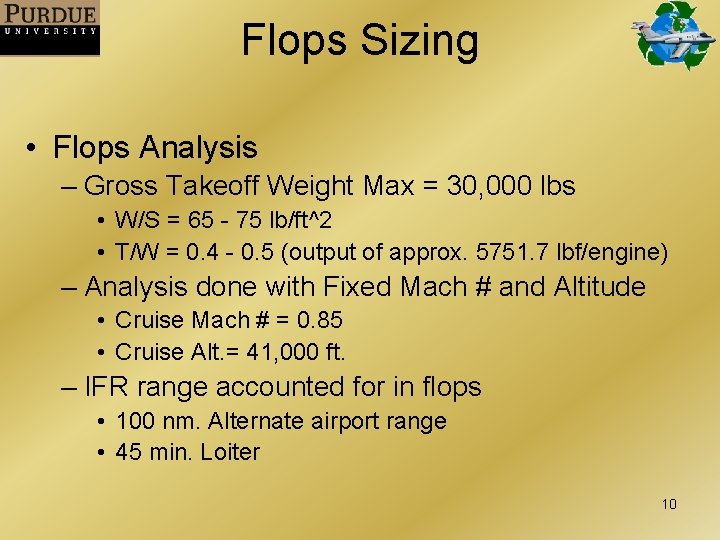
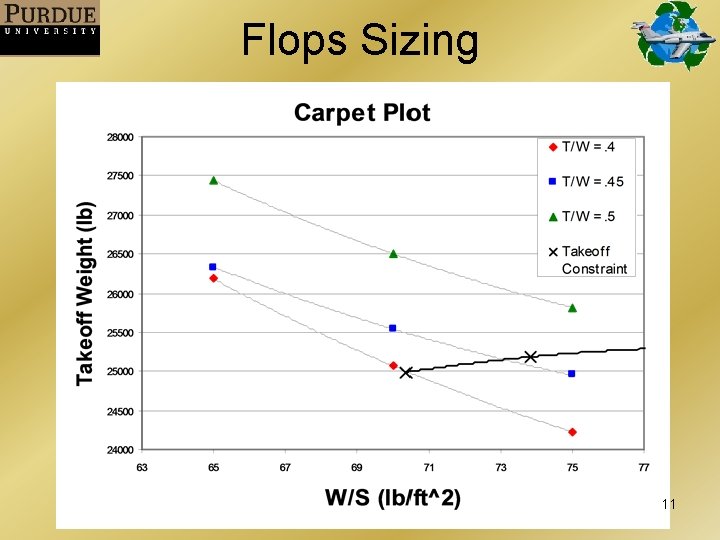
Flops Sizing • Flops Analysis – Gross Takeoff Weight Max = 30, 000 lbs • W/S = 65 - 75 lb/ft^2 • T/W = 0. 4 - 0. 5 (output of approx. 5751. 7 lbf/engine) – Analysis done with Fixed Mach # and Altitude • Cruise Mach # = 0. 85 • Cruise Alt. = 41, 000 ft. – IFR range accounted for in flops • 100 nm. Alternate airport range • 45 min. Loiter 10
Flops Sizing 11
Drag Polars: From Flops Mach # 12
Drag Polar Comparison Good Comparison between FLOPS Data and Raymer Code Reasons for Error: • Inaccurate Raymer Wave Drag Approx. • No FLOPS airfoil input • Inaccurate Span Efficiency 13
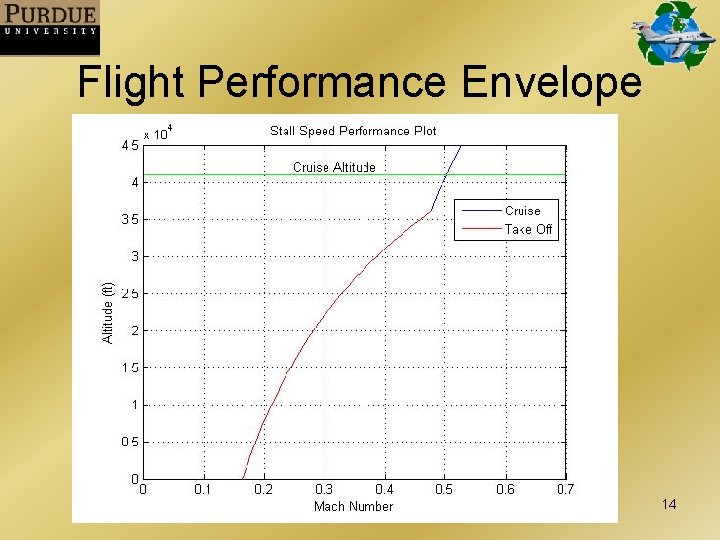
Flight Performance Envelope 14
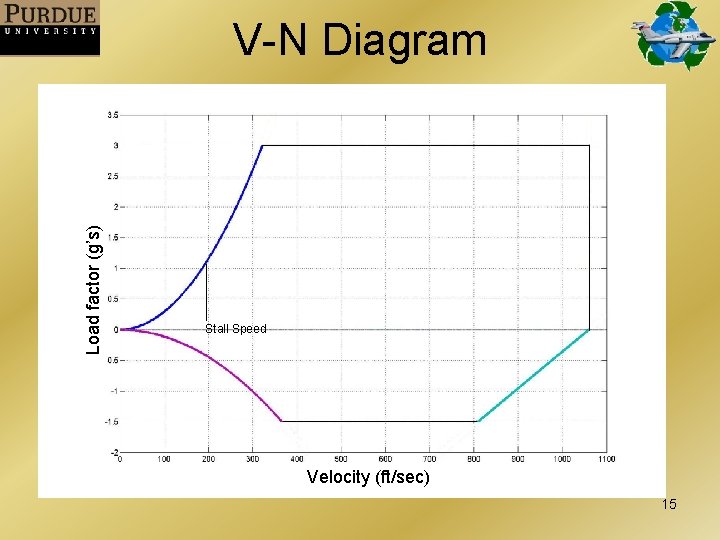
Load factor (g’s) V-N Diagram Stall Speed Velocity (ft/sec) 15
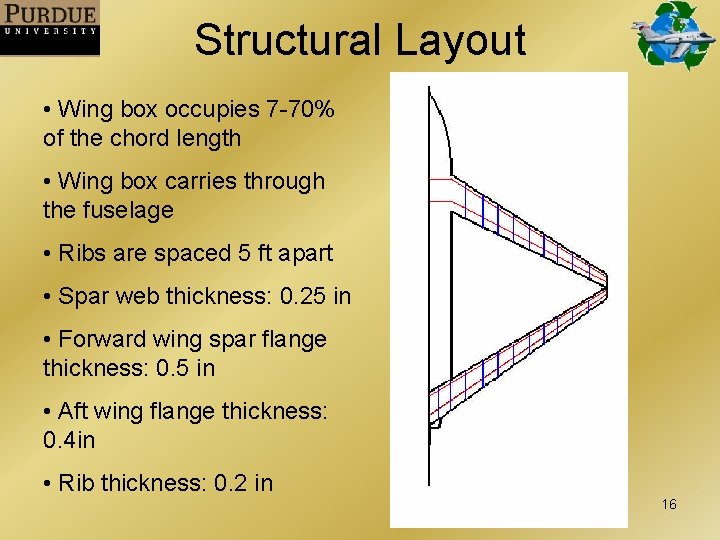
Structural Layout • Wing box occupies 7 -70% of the chord length • Wing box carries through the fuselage • Ribs are spaced 5 ft apart • Spar web thickness: 0. 25 in • Forward wing spar flange thickness: 0. 5 in • Aft wing flange thickness: 0. 4 in • Rib thickness: 0. 2 in 16
Materials • Wing/Fuselage Skin: AS 4/3501 -6 Graphite Epoxy – Quasi-isotropic lay-up: [± 45/0/90]s 2 – Ply thickness: 0. 005 in • Wing Box/Ribs: Al 2017 17
C. G. and Weight Estimates • Utilized Equations from Raymer, Chapter 15 • Weights from Cargo/Transport Category were Averaged with Weights from GA Category • Location of the Co. M for each Component was Estimated from 3 -D Model • Static Margin was Calculated as a Percent of the MAC • Static Margin Limits were taken from Course Notes for Stanford University AAE 241 (http: //adg. stanford. edu/aa 241/stability /staticstability. html) 18
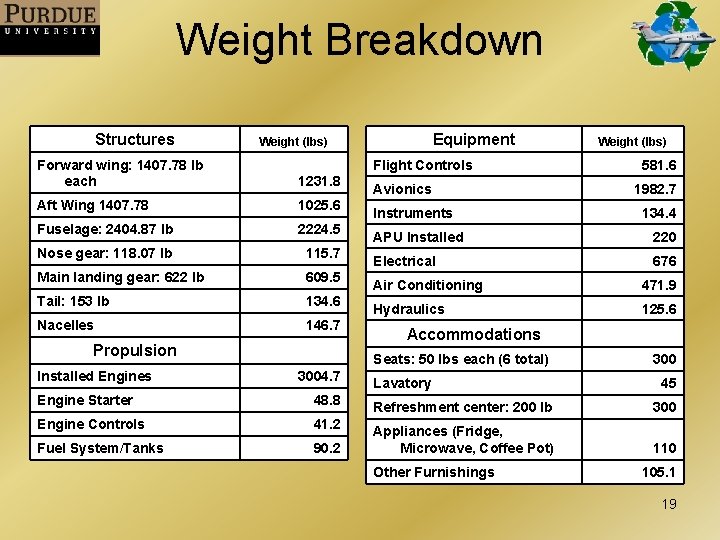
Weight Breakdown Structures Forward wing: 1407. 78 lb each 1231. 8 Aft Wing 1407. 78 1025. 6 Fuselage: 2404. 87 lb 2224. 5 Nose gear: 118. 07 lb 115. 7 Main landing gear: 622 lb 609. 5 Tail: 153 lb 134. 6 Nacelles 146. 7 Flight Controls Propulsion Installed Engines Equipment Weight (lbs) Avionics Instruments Engine Starter 48. 8 Engine Controls 41. 2 Fuel System/Tanks 90. 2 581. 6 1982. 7 134. 4 APU Installed 220 Electrical 676 Air Conditioning 471. 9 Hydraulics 125. 6 Accommodations Seats: 50 lbs each (6 total) 3004. 7 Weight (lbs) Lavatory 300 45 Refreshment center: 200 lb 300 Appliances (Fridge, Microwave, Coffee Pot) 110 Other Furnishings 105. 1 19
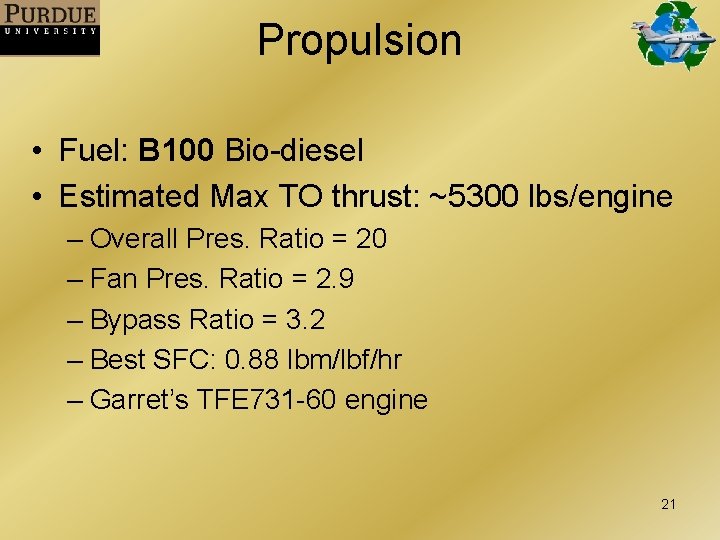
Propulsion • Fuel: B 100 Bio-diesel • Estimated Max TO thrust: ~5300 lbs/engine – Overall Pres. Ratio = 20 – Fan Pres. Ratio = 2. 9 – Bypass Ratio = 3. 2 – Best SFC: 0. 88 lbm/lbf/hr – Garret’s TFE 731 -60 engine 21
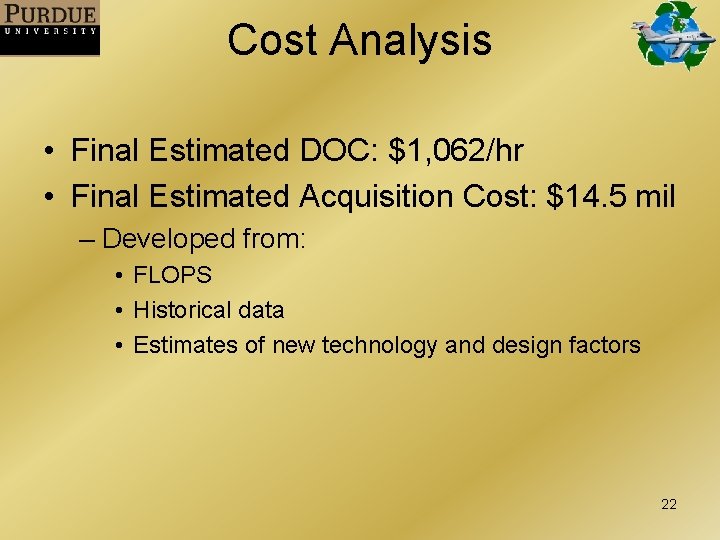
Cost Analysis • Final Estimated DOC: $1, 062/hr • Final Estimated Acquisition Cost: $14. 5 mil – Developed from: • FLOPS • Historical data • Estimates of new technology and design factors 22
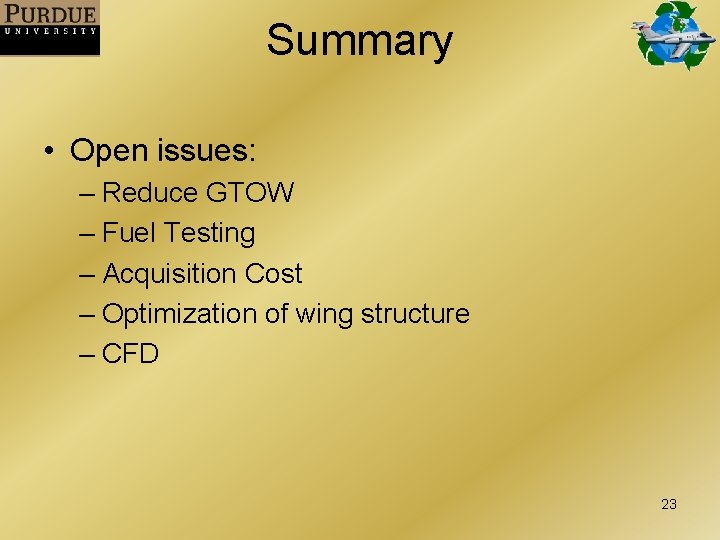
Summary • Open issues: – Reduce GTOW – Fuel Testing – Acquisition Cost – Optimization of wing structure – CFD 23
Questions? 24
Extra Slides
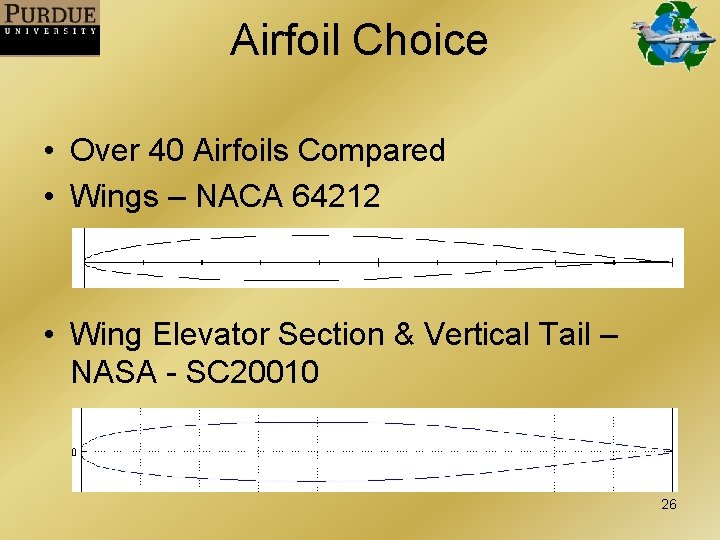
Airfoil Choice • Over 40 Airfoils Compared • Wings – NACA 64212 • Wing Elevator Section & Vertical Tail – NASA - SC 20010 26
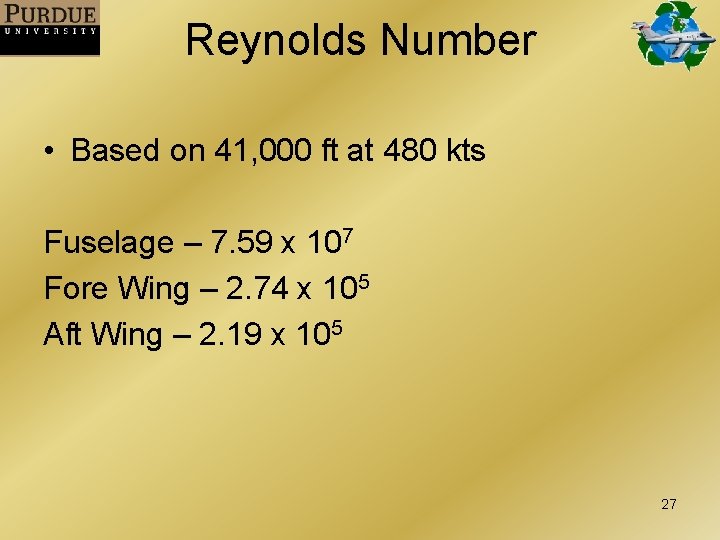
Reynolds Number • Based on 41, 000 ft at 480 kts Fuselage – 7. 59 x 107 Fore Wing – 2. 74 x 105 Aft Wing – 2. 19 x 105 27
Airfoil SC 20010 28
Airfoil NACA 64212 29