
Preliminary Data Analysis Angela Ryu Economics 201 FS


- Slides: 17
Preliminary Data Analysis Angela Ryu Economics 201 FS Honors Junior Workshop: Finance Duke University February 10, 2010
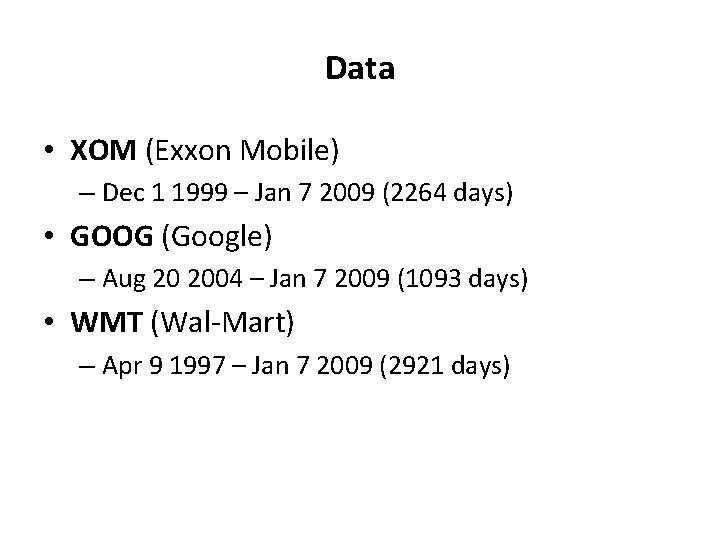
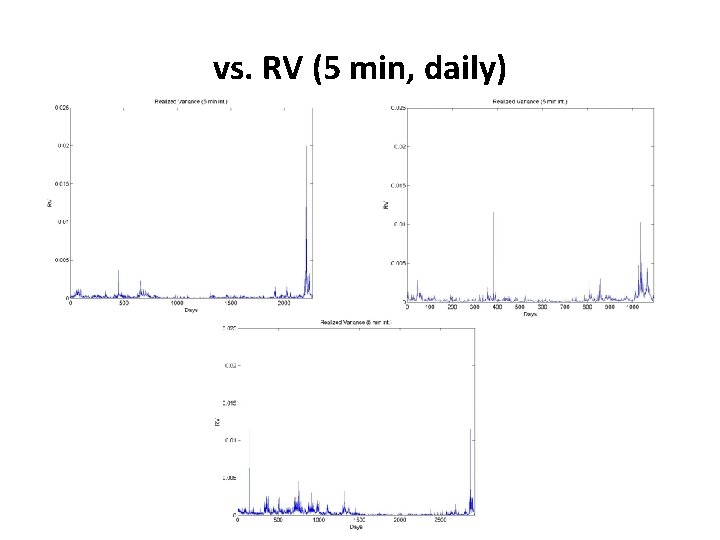
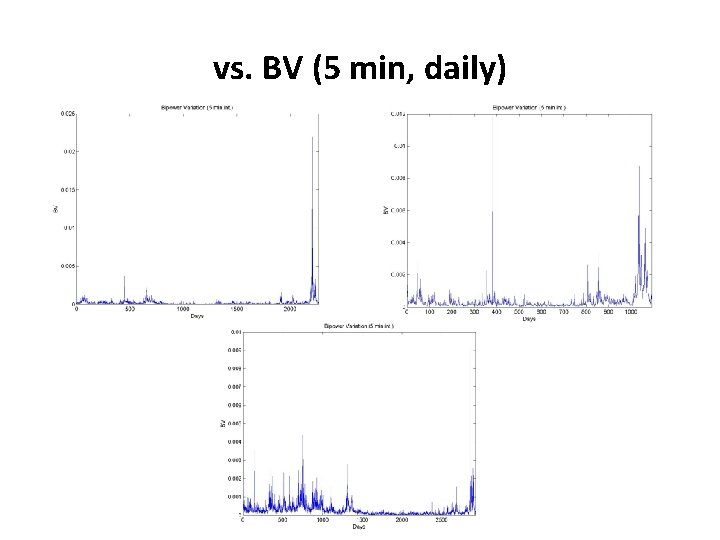
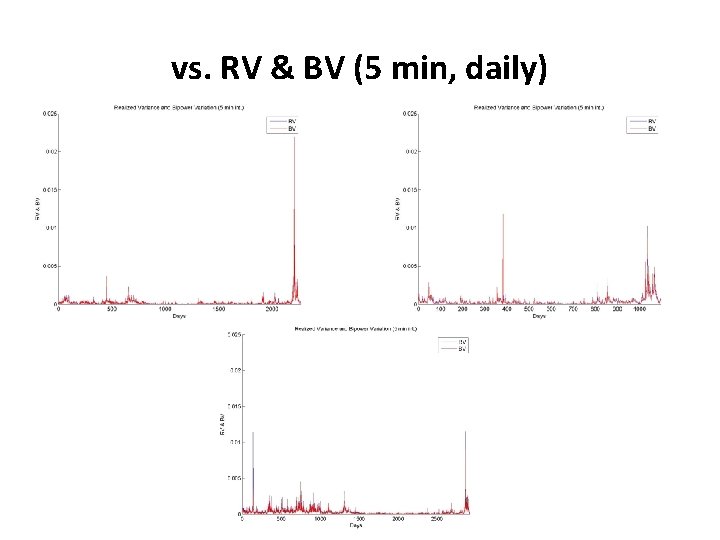
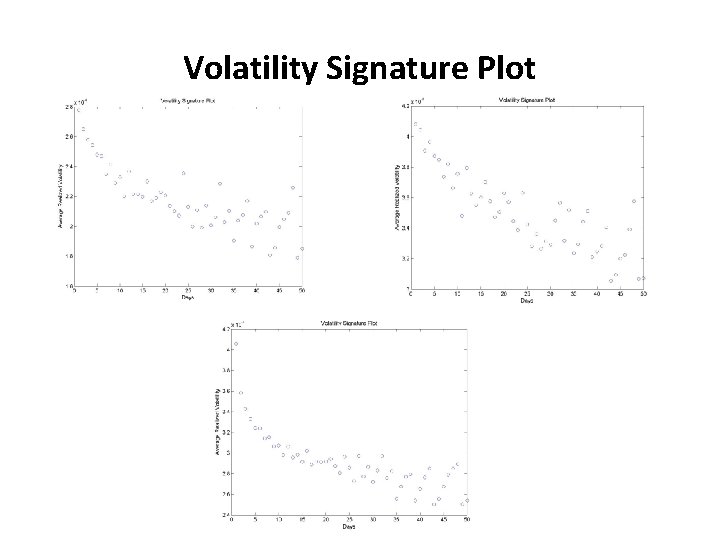
Data • XOM (Exxon Mobile) – Dec 1 1999 – Jan 7 2009 (2264 days) • GOOG (Google) – Aug 20 2004 – Jan 7 2009 (1093 days) • WMT (Wal-Mart) – Apr 9 1997 – Jan 7 2009 (2921 days)
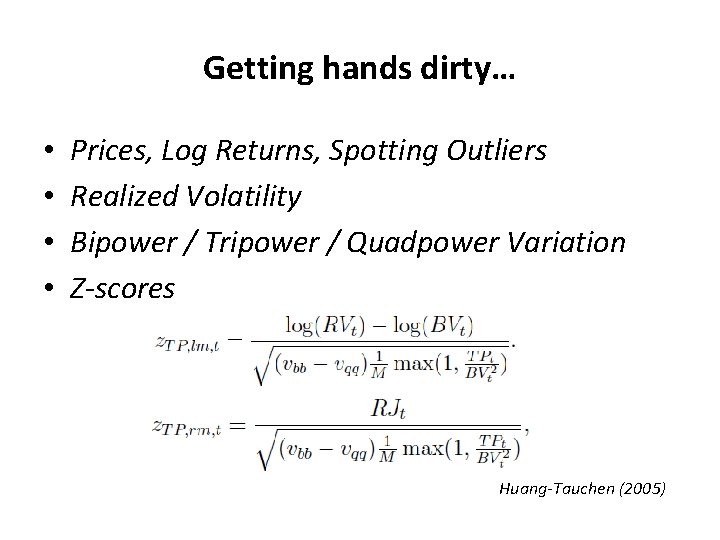
Getting hands dirty… • • Prices, Log Returns, Spotting Outliers Realized Volatility Bipower / Tripower / Quadpower Variation Z-scores Huang-Tauchen (2005)
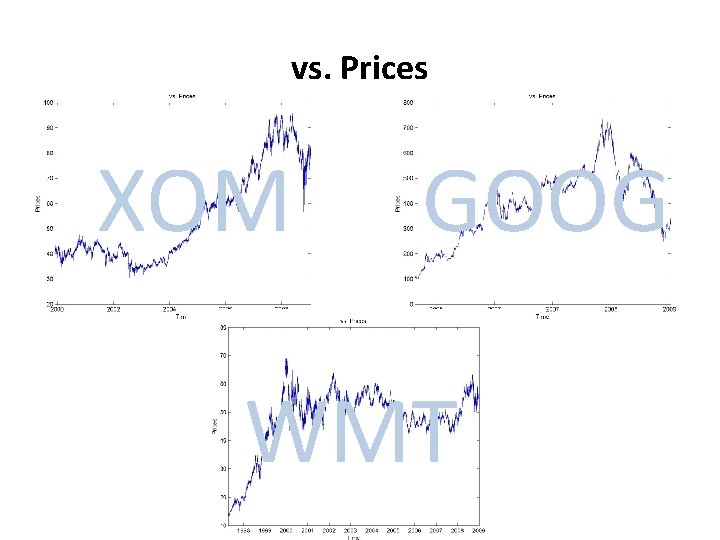
vs. Prices XOM GOOG WMT
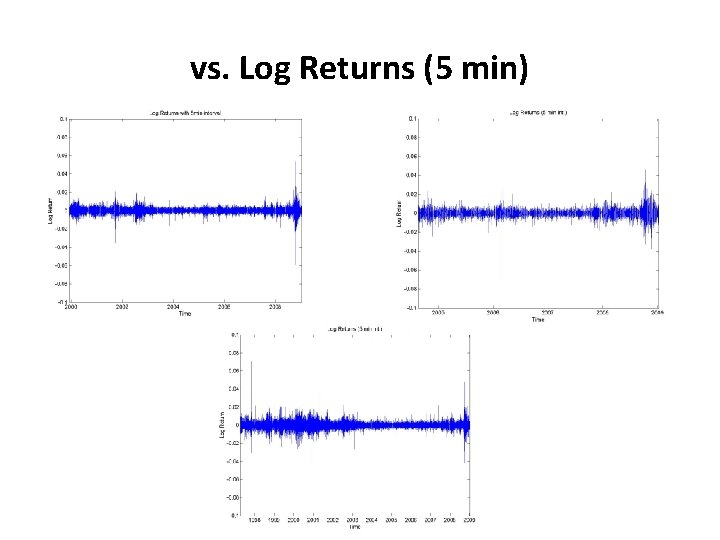
vs. Log Returns (5 min)
vs. RV (5 min, daily)
vs. BV (5 min, daily)
vs. RV & BV (5 min, daily)
Volatility Signature Plot
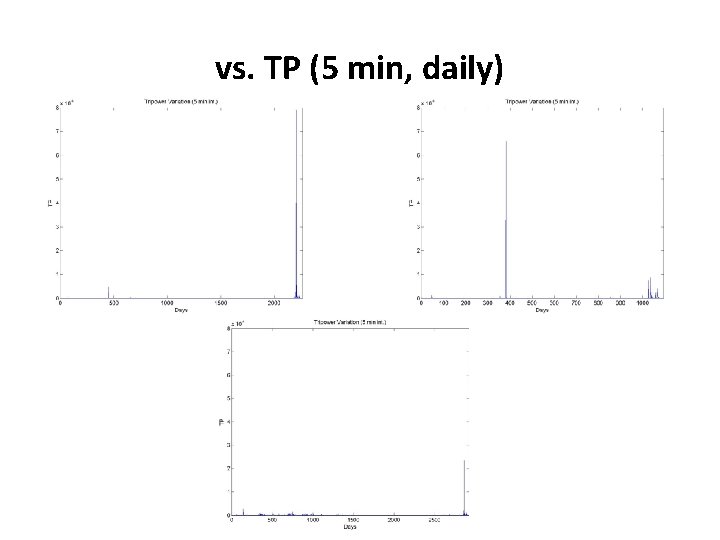
vs. TP (5 min, daily)
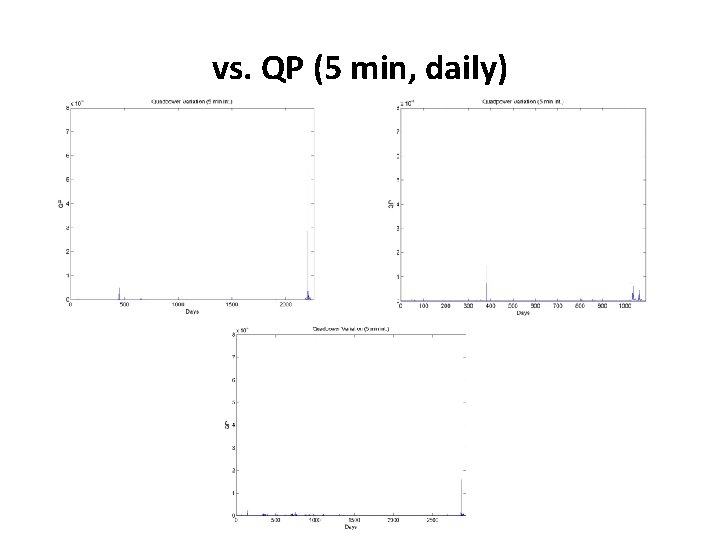
vs. QP (5 min, daily)
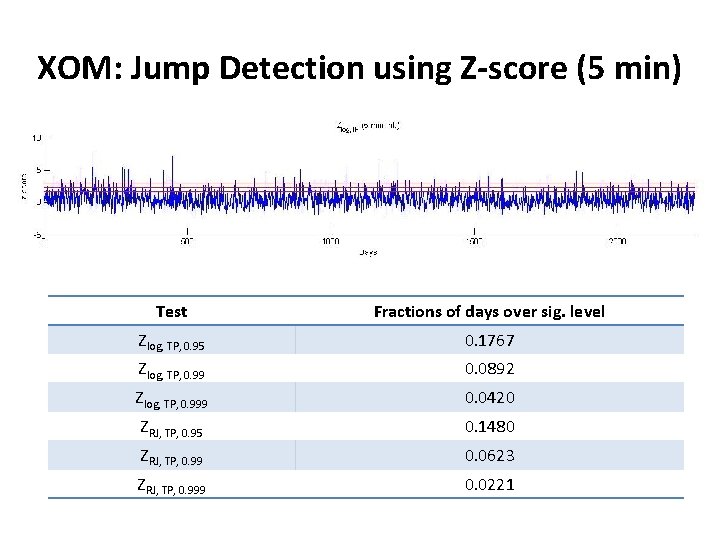
XOM: Jump Detection using Z-score (5 min) Test Fractions of days over sig. level Zlog, TP, 0. 95 0. 1767 Zlog, TP, 0. 99 0. 0892 Zlog, TP, 0. 999 0. 0420 ZRJ, TP, 0. 95 0. 1480 ZRJ, TP, 0. 99 0. 0623 ZRJ, TP, 0. 999 0. 0221
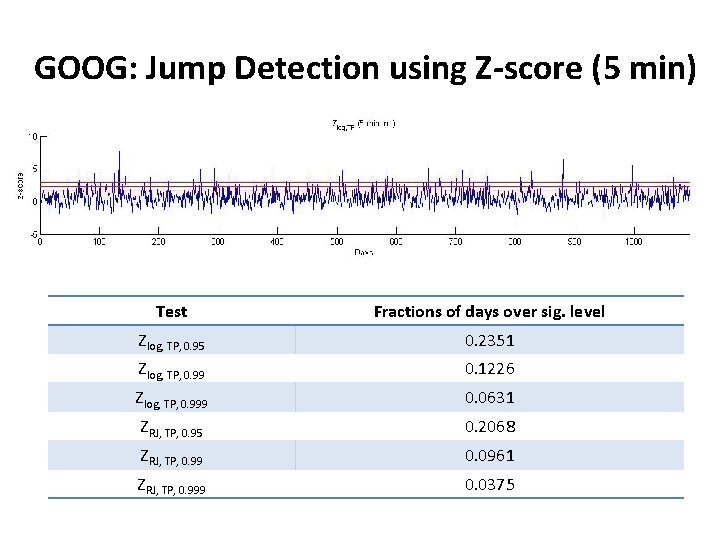
GOOG: Jump Detection using Z-score (5 min) Test Fractions of days over sig. level Zlog, TP, 0. 95 0. 2351 Zlog, TP, 0. 99 0. 1226 Zlog, TP, 0. 999 0. 0631 ZRJ, TP, 0. 95 0. 2068 ZRJ, TP, 0. 99 0. 0961 ZRJ, TP, 0. 999 0. 0375
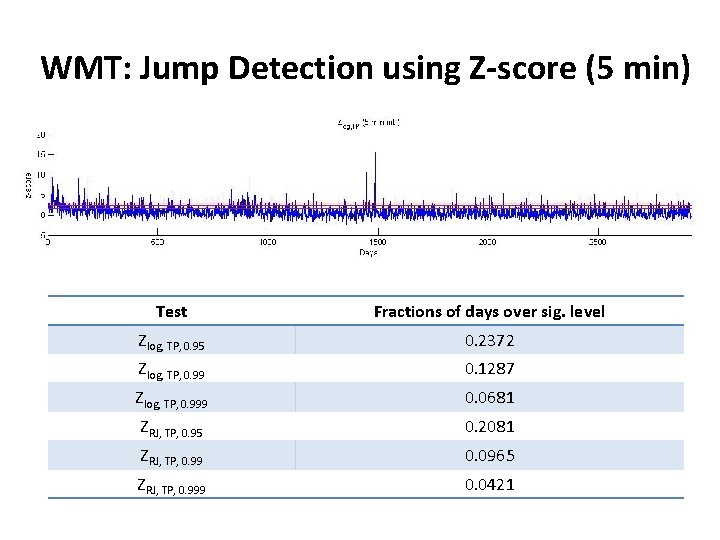
WMT: Jump Detection using Z-score (5 min) Test Fractions of days over sig. level Zlog, TP, 0. 95 0. 2372 Zlog, TP, 0. 99 0. 1287 Zlog, TP, 0. 999 0. 0681 ZRJ, TP, 0. 95 0. 2081 ZRJ, TP, 0. 99 0. 0965 ZRJ, TP, 0. 999 0. 0421
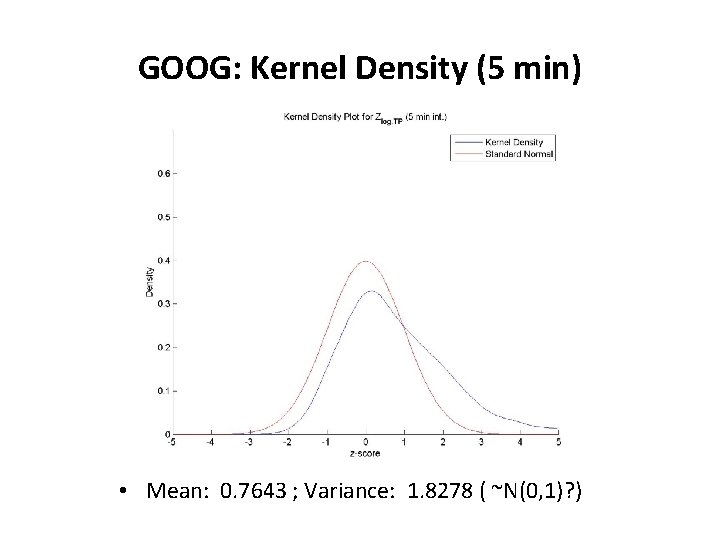
GOOG: Kernel Density (5 min) • Mean: 0. 7643 ; Variance: 1. 8278 ( ~N(0, 1)? )
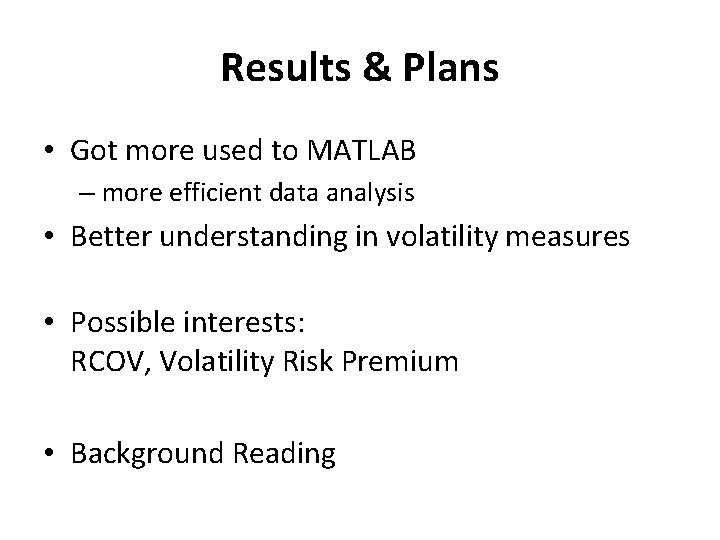
Results & Plans • Got more used to MATLAB – more efficient data analysis • Better understanding in volatility measures • Possible interests: RCOV, Volatility Risk Premium • Background Reading
Comments & Suggestions