
Predictors of Acute Care Transfers from Inpatient Rehabilitation
Predictors of Acute Care Transfers from Inpatient Rehabilitation Angela Horton, MD, MPH
Presentation Outline • • Background regarding hospital readmissions Acute care transfers Study aims and hypothesis Study design and methods Statistical analysis and findings Study limitations Conclusion
30 Day Hospital Readmission • Patient discharged from acute or post acute care facility and readmitted to the hospital within 30 days • Medicare estimates that avoidable readmissions cost 12 billion dollars annually 1 • 1 in 5 Medicare and Medicaid beneficiaries are readmitted to hospital with 30 days 2 • The Patient Protection and Affordable Care Act has programs and policies to reduce hospital readmission 3 – Reduce reimbursement for hospitals with excessive readmission – Creating bundle payments for certain admission diagnoses
Post Acute Care (PAC) • In 2011, 43% of Medicare beneficiaries were discharged from acute care to the post acute care setting 4 – Skilled Nursing Facility/Nursing Home – Long Term Acute Care Facilities – Inpatient Rehabilitation Facilities – Home Health Services

Inpatient Rehabilitation • • Intensive rehabilitation program Supervision by rehabilitation physician Requires medical stability Requires patient participate in 3 hours of therapy daily for 2 disciplines

Acute Care Transfer • Occurs when a patient admitted to post acute care facility is transferred secondary to changes in medical status which requires higher level of care.
Readmissions/ACT in Post Acute Care • Overall readmission rate is 11. 8%4 • Lower Functional Independence Measure (FIM) scores have higher readmission rate 5 • In 50% of readmitted patients the diagnosis on readmission is unchanged from the index diagnosis 5 • Admission diagnoses of CHF, PNA and MI have higher readmission rate 6
ACT from Inpatient Rehabilitation • Research is emerging regarding ACT and Inpatient Rehabilitation • Currently literature states ACT rate of 4 - 10. 8% 4 -5 • Recent studies explore potential risk factors for ACT – – – *Time and date of admission *Functional Independence Measure Score Comorbidity Tiers Demographics *Poly-pharmacy *Acute Hospital Length of Stay
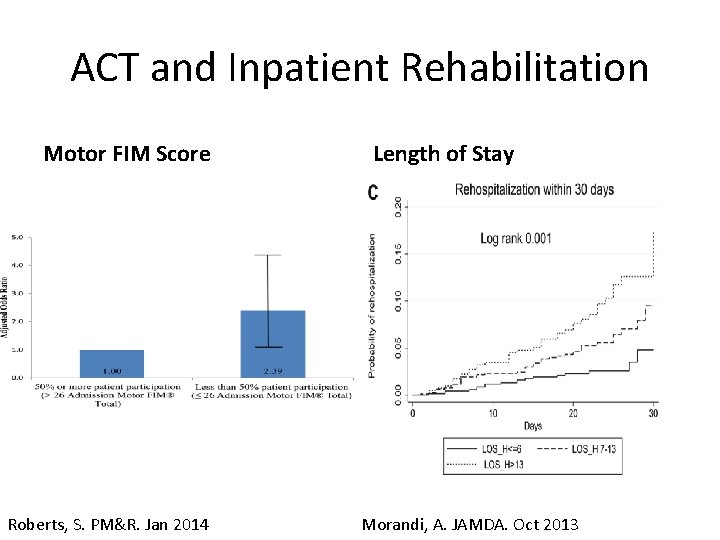
ACT and Inpatient Rehabilitation Motor FIM Score Roberts, S. PM&R. Jan 2014 Length of Stay Morandi, A. JAMDA. Oct 2013
Study Aims • Aim 1 – To determine the incidence of acute care transfers from Vanderbilt Stallworth Rehabilitation Hospital • Aim 2 – To determine if the following are risk factors for acute care transfers • Functional Independence Measure • Length of acute care hospital stay • Malnutrition

Hypotheses • Patients with lower FIM scores will have a greater odds of ACT. • Longer length of stay at the acute care hospital will be associated with a greater odds of ACT • Patients with malnutrition (using pre-albumin as a surrogate) will be associated with greater odds of ACT.
Study Design and Setting • Retrospective cohort study – 1706 admissions at VSRH in 2010 • Vanderbilt Stallworth Rehabilitation Hospital – 80 bed inpatient rehabilitation facility – Joint Venture between Health. South Corporation and Vanderbilt University Medical Center
Inclusion/Exclusion Criteria • Inclusion Criteria – Admitted to VSRH in 2010 from acute care hospital • Exclusion Criteria – Patients < 18 years old – Patient admitted from home, SNF, IRF or ALF to VSRH – Only 1 st admission was included – Patients admitted by physician who seldom practice at VSRH (admitted <10 patients)
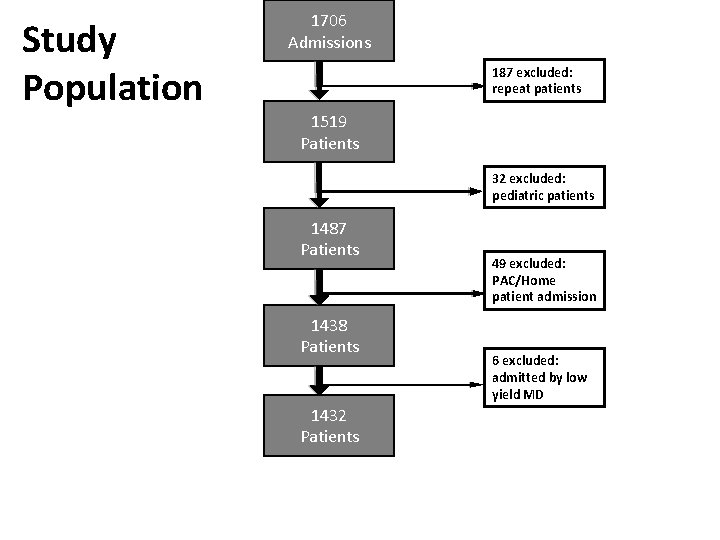
Study Population 1706 Admissions 187 excluded: repeat patients 1519 Patients 32 excluded: pediatric patients 1487 Patients 1438 Patients 1432 Patients 49 excluded: PAC/Home patient admission 6 excluded: admitted by low yield MD
Outcome Variable • Acute care transfers • Binary outcome • Does the patient have an acute care transfers from VSRH ? “yes/no” • Initial transfer of patient from Inpatient Rehabilitation to Acute Care Facility
Exposure variables • Functional Independence Measure Score (FIM Score) • Acute Care Length of Stay • Malnutrition
FIM Score • Disability Measure used in inpatient rehabilitation • 18 indicator scale with 13 motor tasks and 5 cognition tasks • Scored from 1 - 7 – Score of 1 indicates complete dependence with a task – Score 7 indicates independence – Lowest score 18 and maximum score of 126 • Performed on all patients by trained therapist within 48 hours of admission and discharge to IRF

9
FIM Score • Excellent internal consistency (Cronbach's alpha = 0. 93 admission; 0. 95 discharge as relates to general rehabilitation 10 • Excellent test-retest reliability (ICC = 0. 98 for total FIM, 0. 95 and 0. 89 for motor FIM and cognitive FIM, respectively)11 • Excellent overall consistency (median interrater reliability = 0. 95) between raters across patients with different diagnosis and levels of impairment 12
Malnutrition • Pre-albumin • a serum protein synthesized by the liver with half-life of two days 13 • Normal value is 18. 0 to 45. 0 mg/d. L • Ordered on day of admission
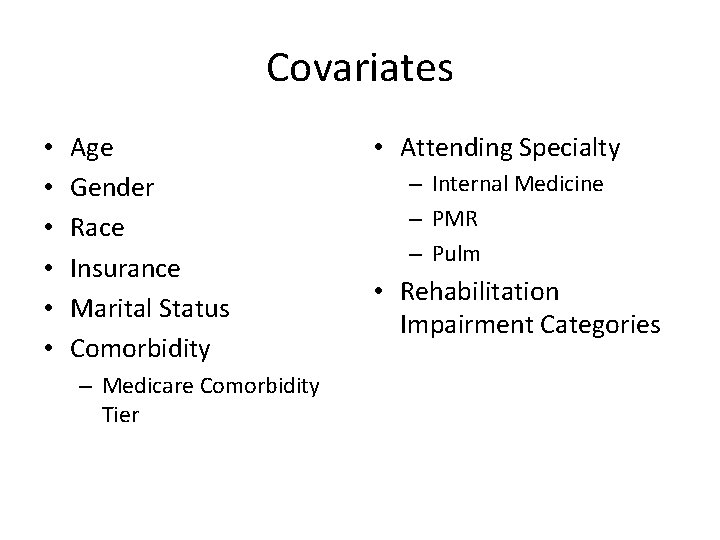
Covariates • • • Age Gender Race Insurance Marital Status Comorbidity – Medicare Comorbidity Tier • Attending Specialty – Internal Medicine – PMR – Pulm • Rehabilitation Impairment Categories
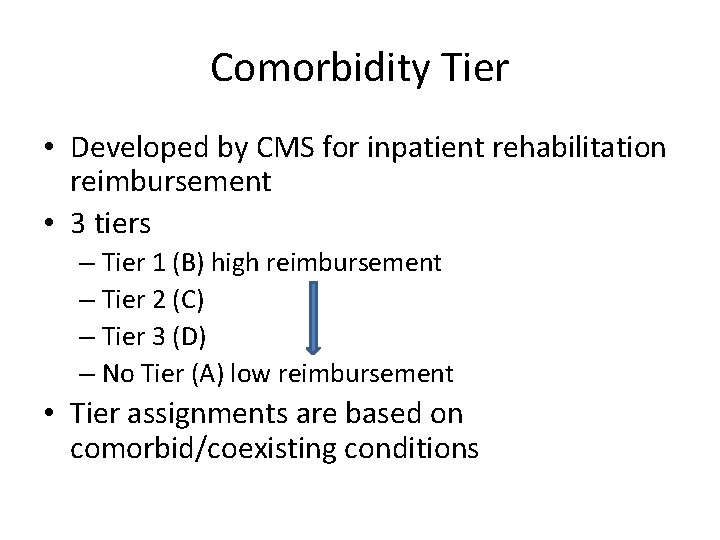
Comorbidity Tier • Developed by CMS for inpatient rehabilitation reimbursement • 3 tiers – Tier 1 (B) high reimbursement – Tier 2 (C) – Tier 3 (D) – No Tier (A) low reimbursement • Tier assignments are based on comorbid/coexisting conditions
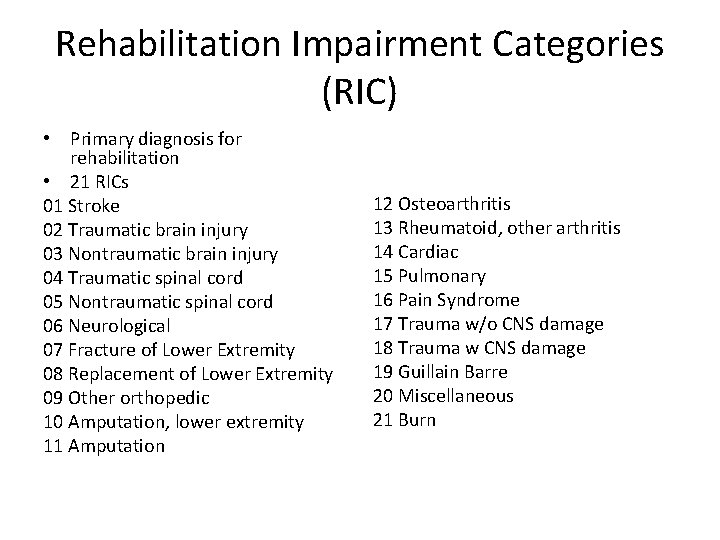
Rehabilitation Impairment Categories (RIC) • Primary diagnosis for rehabilitation • 21 RICs 01 Stroke 02 Traumatic brain injury 03 Nontraumatic brain injury 04 Traumatic spinal cord 05 Nontraumatic spinal cord 06 Neurological 07 Fracture of Lower Extremity 08 Replacement of Lower Extremity 09 Other orthopedic 10 Amputation, lower extremity 11 Amputation 12 Osteoarthritis 13 Rheumatoid, other arthritis 14 Cardiac 15 Pulmonary 16 Pain Syndrome 17 Trauma w/o CNS damage 18 Trauma w CNS damage 19 Guillain Barre 20 Miscellaneous 21 Burn

Human Subject Consideration • IRB Approval – Exempt from Committee or expedited review – Obtained under the exemption category that covers research involving studying data, documents or diagnostic specimens that have been already been collected – Vulnerable populations were excluded
Statistical Analysis • Stata for data analysis – Descriptive Statistics – Bivariate Analysis – Multivariate Logistic Regression • R version 3. 0. 2 – Multivariate Logistic Regression with Multiple imputation • P value of less than 0. 05 is considered statistically significant
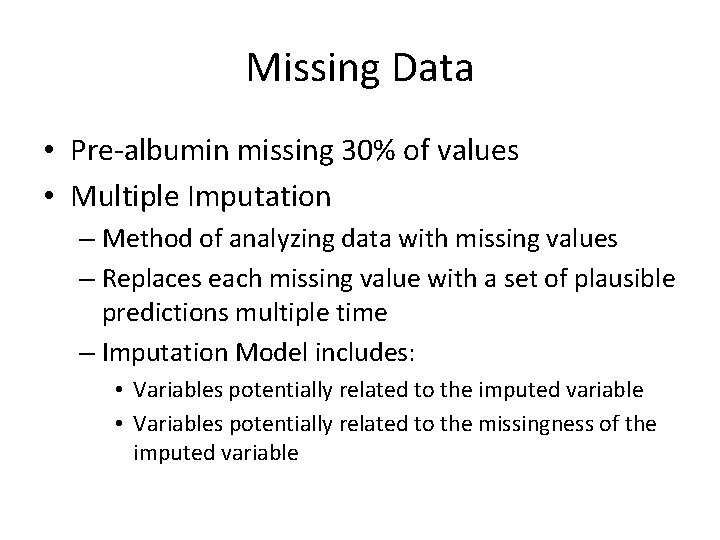
Missing Data • Pre-albumin missing 30% of values • Multiple Imputation – Method of analyzing data with missing values – Replaces each missing value with a set of plausible predictions multiple time – Imputation Model includes: • Variables potentially related to the imputed variable • Variables potentially related to the missingness of the imputed variable
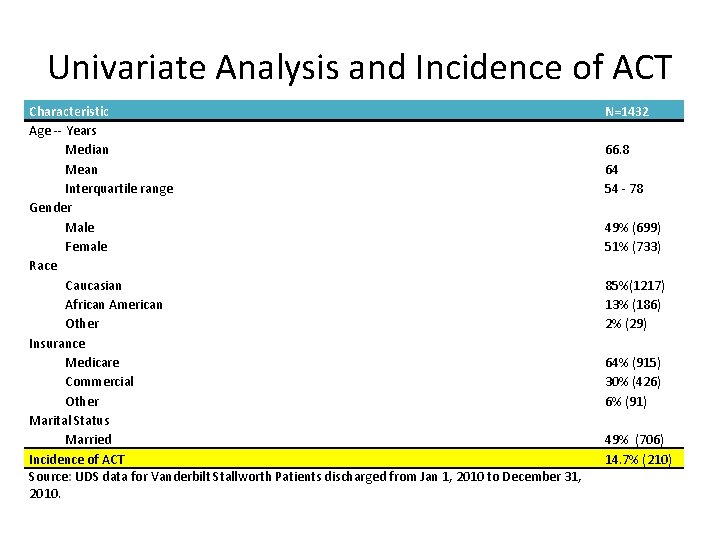
Univariate Analysis and Incidence of ACT Characteristic Age -- Years Median Mean Interquartile range Gender Male Female Race Caucasian African American Other Insurance Medicare Commercial Other Marital Status Married Incidence of ACT Source: UDS data for Vanderbilt Stallworth Patients discharged from Jan 1, 2010 to December 31, 2010. N=1432 66. 8 64 54 - 78 49% (699) 51% (733) 85%(1217) 13% (186) 2% (29) 64% (915) 30% (426) 6% (91) 49% (706) 14. 7% (210)
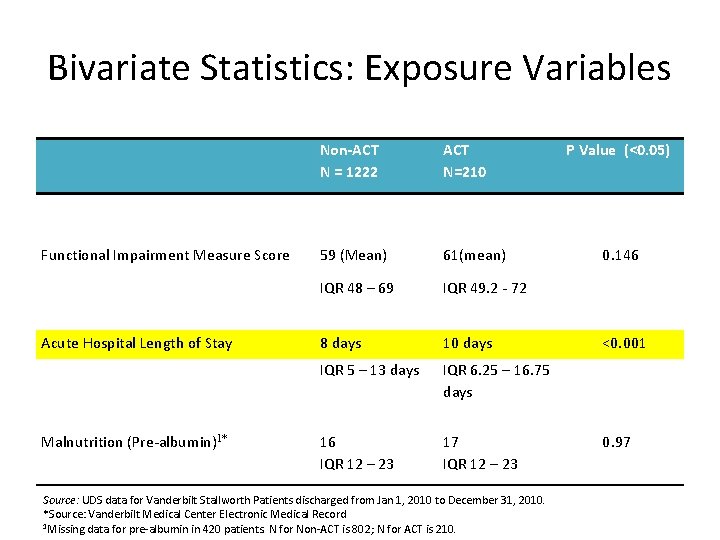
Bivariate Statistics: Exposure Variables Non-ACT N = 1222 ACT N=210 P Value (<0. 05) Functional Impairment Measure Score 59 (Mean) 61(mean) IQR 48 – 69 IQR 49. 2 - 72 Acute Hospital Length of Stay 8 days 10 days <0. 001 IQR 5 – 13 days IQR 6. 25 – 16. 75 days Malnutrition (Pre-albumin)1* 16 IQR 12 – 23 17 IQR 12 – 23 Source: UDS data for Vanderbilt Stallworth Patients discharged from Jan 1, 2010 to December 31, 2010. *Source: Vanderbilt Medical Center Electronic Medical Record 1 Missing data for pre-albumin in 420 patients. N for Non-ACT is 802; N for ACT is 210. 0. 146 0. 97
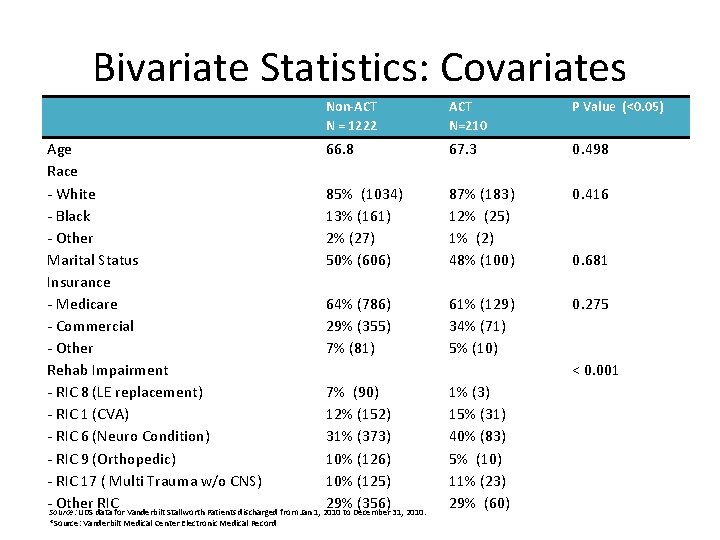
Bivariate Statistics: Covariates Non-ACT N = 1222 Age 66. 8 Race - White 85% (1034) - Black 13% (161) - Other 2% (27) Marital Status 50% (606) Insurance - Medicare 64% (786) - Commercial 29% (355) - Other 7% (81) Rehab Impairment - RIC 8 (LE replacement) 7% (90) - RIC 1 (CVA) 12% (152) - RIC 6 (Neuro Condition) 31% (373) - RIC 9 (Orthopedic) 10% (126) - RIC 17 ( Multi Trauma w/o CNS) 10% (125) - Other RIC 29% (356) Source: UDS data for Vanderbilt Stallworth Patients discharged from Jan 1, 2010 to December 31, 2010. *Source: Vanderbilt Medical Center Electronic Medical Record ACT N=210 P Value (<0. 05) 67. 3 87% (183) 12% (25) 1% (2) 48% (100) 61% (129) 34% (71) 5% (10) 1% (3) 15% (31) 40% (83) 5% (10) 11% (23) 29% (60) 0. 498 0. 416 0. 681 0. 275 < 0. 001
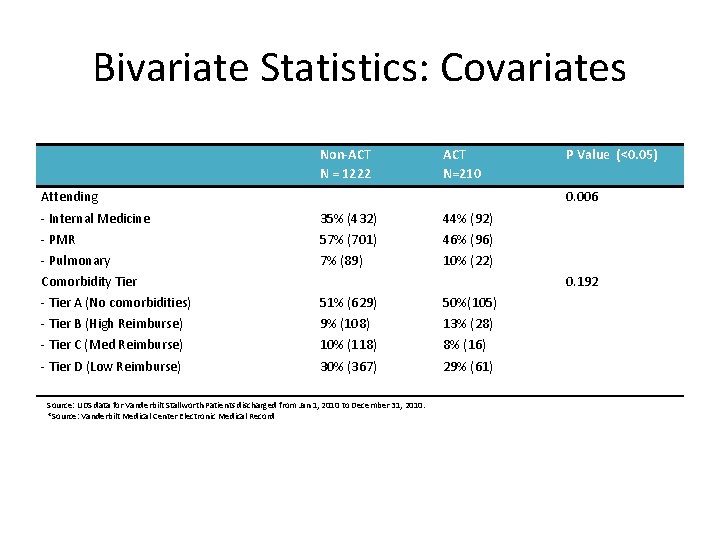
Bivariate Statistics: Covariates Non-ACT N = 1222 ACT N=210 P Value (<0. 05) Attending 0. 006 - Internal Medicine 35% (432) 44% (92) - PMR 57% (701) 46% (96) - Pulmonary 7% (89) 10% (22) Comorbidity Tier 0. 192 - Tier A (No comorbidities) 51% (629) 50%(105) - Tier B (High Reimburse) 9% (108) 13% (28) - Tier C (Med Reimburse) 10% (118) 8% (16) - Tier D (Low Reimburse) 30% (367) 29% (61) Source: UDS data for Vanderbilt Stallworth Patients discharged from Jan 1, 2010 to December 31, 2010. *Source: Vanderbilt Medical Center Electronic Medical Record
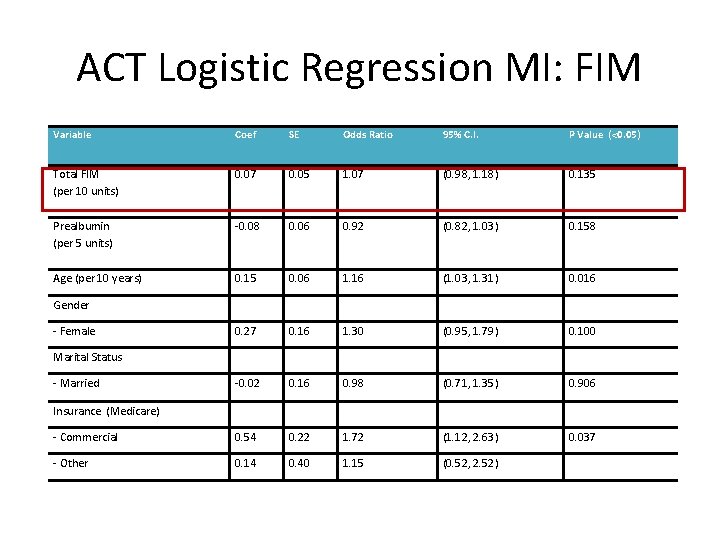
ACT Logistic Regression MI: FIM Variable Coef SE Odds Ratio 95% C. I. P Value (<0. 05) Total FIM (per 10 units) 0. 07 0. 05 1. 07 (0. 98, 1. 18) 0. 135 Prealbumin (per 5 units) -0. 08 0. 06 0. 92 (0. 82, 1. 03) 0. 158 Age (per 10 years) 0. 15 0. 06 1. 16 (1. 03, 1. 31) 0. 016 Gender - Female 0. 27 0. 16 1. 30 (0. 95, 1. 79) 0. 100 Marital Status - Married -0. 02 0. 16 0. 98 (0. 71, 1. 35) 0. 906 Insurance (Medicare) - Commercial 0. 54 0. 22 1. 72 (1. 12, 2. 63) 0. 037 - Other 0. 14 0. 40 1. 15 (0. 52, 2. 52)
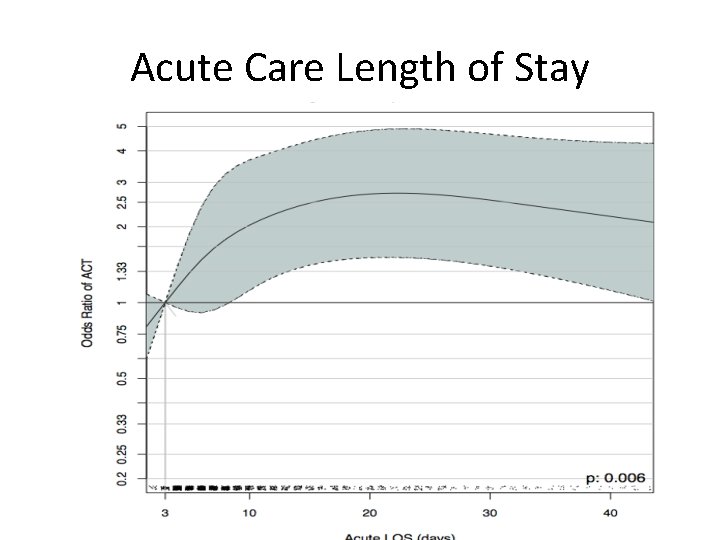
Acute Care Length of Stay
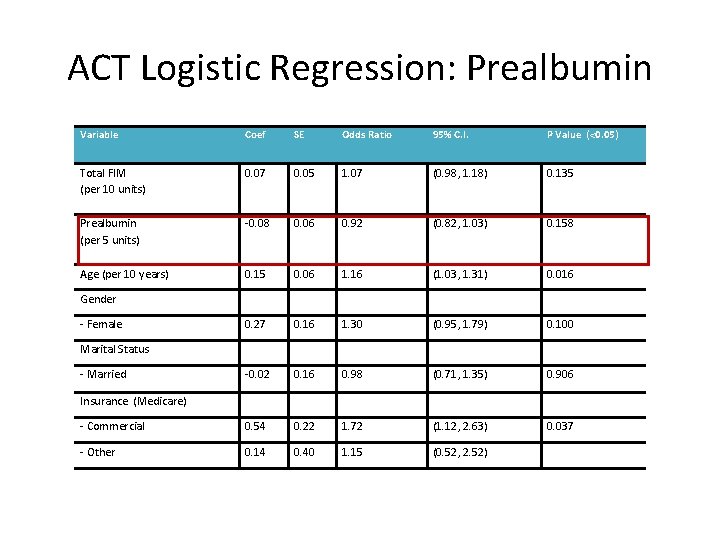
ACT Logistic Regression: Prealbumin Variable Coef SE Odds Ratio 95% C. I. P Value (<0. 05) Total FIM (per 10 units) 0. 07 0. 05 1. 07 (0. 98, 1. 18) 0. 135 Prealbumin (per 5 units) -0. 08 0. 06 0. 92 (0. 82, 1. 03) 0. 158 Age (per 10 years) 0. 15 0. 06 1. 16 (1. 03, 1. 31) 0. 016 Gender - Female 0. 27 0. 16 1. 30 (0. 95, 1. 79) 0. 100 Marital Status - Married -0. 02 0. 16 0. 98 (0. 71, 1. 35) 0. 906 Insurance (Medicare) - Commercial 0. 54 0. 22 1. 72 (1. 12, 2. 63) 0. 037 - Other 0. 14 0. 40 1. 15 (0. 52, 2. 52)
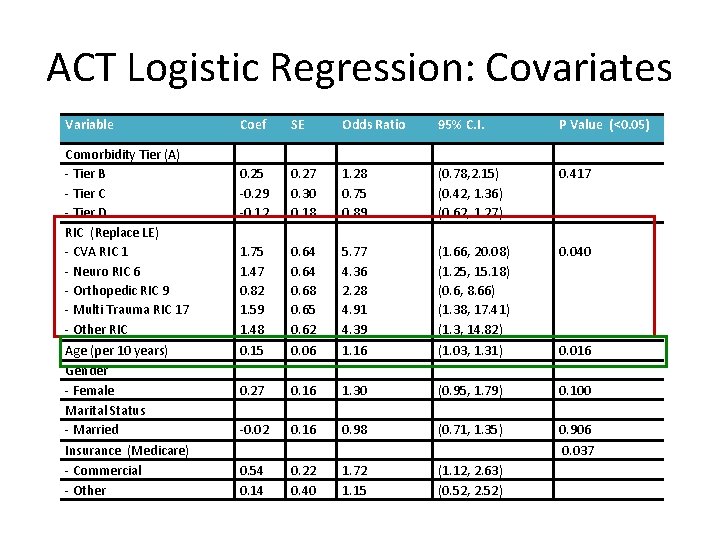
ACT Logistic Regression: Covariates Variable Coef SE Odds Ratio 95% C. I. P Value (<0. 05) Comorbidity Tier (A) - Tier B - Tier C - Tier D RIC (Replace LE) - CVA RIC 1 - Neuro RIC 6 - Orthopedic RIC 9 - Multi Trauma RIC 17 - Other RIC 0. 25 -0. 29 -0. 12 1. 75 1. 47 0. 82 1. 59 1. 48 0. 27 0. 30 0. 18 0. 64 0. 68 0. 65 0. 62 1. 28 0. 75 0. 89 5. 77 4. 36 2. 28 4. 91 4. 39 (0. 78, 2. 15) (0. 42, 1. 36) (0. 62, 1. 27) (1. 66, 20. 08) (1. 25, 15. 18) (0. 6, 8. 66) (1. 38, 17. 41) (1. 3, 14. 82) 0. 417 Age (per 10 years) Gender - Female Marital Status - Married Insurance (Medicare) - Commercial - Other 0. 15 0. 27 -0. 02 0. 54 0. 14 0. 06 0. 16 0. 22 0. 40 1. 16 1. 30 0. 98 1. 72 1. 15 (1. 03, 1. 31) (0. 95, 1. 79) (0. 71, 1. 35) (1. 12, 2. 63) (0. 52, 2. 52) 0. 016 0. 100 0. 906 0. 037 0. 040
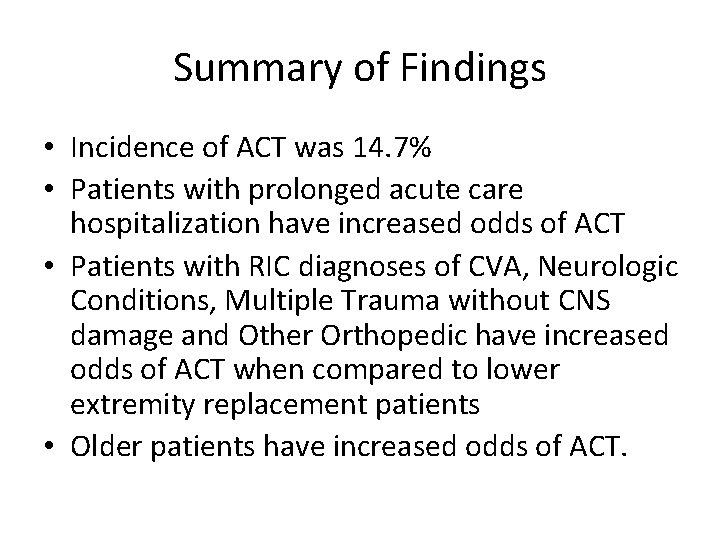
Summary of Findings • Incidence of ACT was 14. 7% • Patients with prolonged acute care hospitalization have increased odds of ACT • Patients with RIC diagnoses of CVA, Neurologic Conditions, Multiple Trauma without CNS damage and Other Orthopedic have increased odds of ACT when compared to lower extremity replacement patients • Older patients have increased odds of ACT.
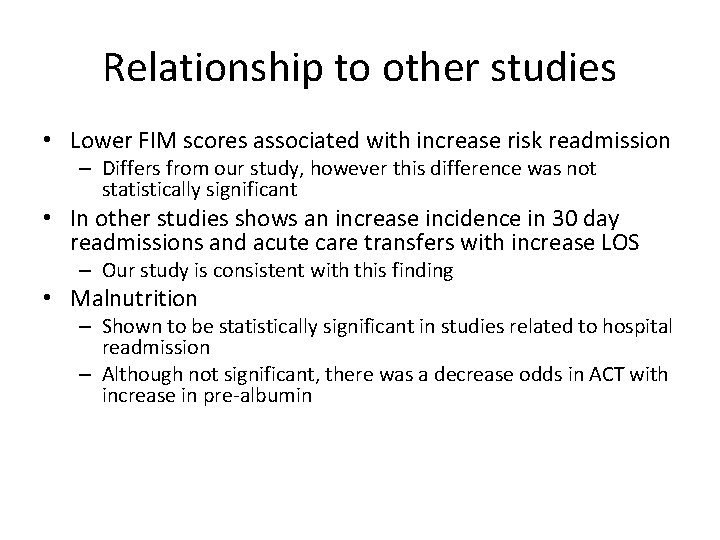
Relationship to other studies • Lower FIM scores associated with increase risk readmission – Differs from our study, however this difference was not statistically significant • In other studies shows an increase incidence in 30 day readmissions and acute care transfers with increase LOS – Our study is consistent with this finding • Malnutrition – Shown to be statistically significant in studies related to hospital readmission – Although not significant, there was a decrease odds in ACT with increase in pre-albumin
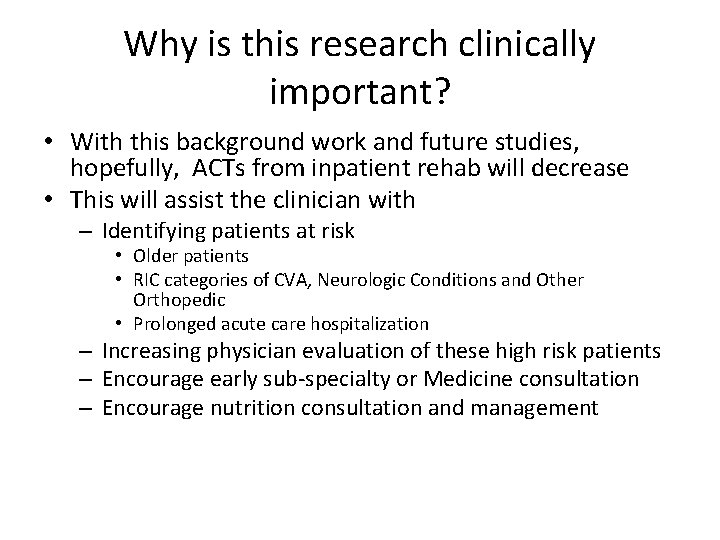
Why is this research clinically important? • With this background work and future studies, hopefully, ACTs from inpatient rehab will decrease • This will assist the clinician with – Identifying patients at risk • Older patients • RIC categories of CVA, Neurologic Conditions and Other Orthopedic • Prolonged acute care hospitalization – Increasing physician evaluation of these high risk patients – Encourage early sub-specialty or Medicine consultation – Encourage nutrition consultation and management
Study Limitations • Single center study in urban academic setting • Missing data as relates to pre-albumin • No differentiation between planned and unplanned acute care transfers • Difference between our study results with FIM score and other studies • Analyze initial ACT, and not subsequent ACT • Retrospective • Coding data hard to validate
Final Conclusion • Acute care length of stay is a risk factor for ACT from inpatient rehabilitation • Additional research should be done to evaluate malnutrition and ACT • FIM score is likely a good predictor of ACT, however this study did not show a significant difference • Additional research is needed to evaluate other possible risk factor for ACT.

Acknowledgements Mentor Committee Vanderbilt Stallworth Sunil Kripalani, MD, MSc, SFHM Susan Health, CEO of VSRH Jack F. Schnelle, Ph. D Eric Woodard, RN Walter Frontera, MD, Ph. D La. Toya Mercado MPH Program William Cooper, MD, MPH Marie Griffith, MD, MPH Biostatistician Jonathan Scott Schildcrout, Ph. D Yuwei Zhu, MD, MS Xan Hue, MPH, MS Funding Center for Clinical Quality and Implementation Research
Bibliography 1. Burton R, Lipson D. Health Policy Brief: Care Transitions, ” Health Affairs, September 13, 2012 2. Jencks SF, Williams MV, Coleman EA. Rehospitalizations among patients in the Medicare fee-for-service program. N Engl J Med. 2009; 360: 1418– 28. 3. Vincent Mor, Orna Intrator, Zhanlian Feng, and David C. Grabowski. The Revolving Door Of Rehospitalization From Skilled Nursing Facilities. Health Aff January 2010 29: 157 -64 4. Med. PAC. Medicare Post Acute Care Reforms. Testimony. June 14, 2011. 5. Med. PAC. Medicare Payment Advisory Commission’s March 2011 Report to Congress, June 2011 Data Book and December 16, 2011 Commissioners Meeting. Accessed 12/21/2013. 6. Ottenbacher KJ, Karmarkar A, Graham JE, et al. Thirty-Day Hospital Readmission Following Discharge From Postacute Rehabilitation in Fee-for-Service Medicare Patients. JAMA. 2014; 311(6): 604 -614. 7. Ouslander JG 1, et al. Frequency and diagnoses associated with 7 - and 30 -day readmission of skilled nursing facility patients to a nonteaching community hospital. J Am Med Dir Assoc. 2011 Mar; 12(3): 195 -203.
Bibliography 8. Ouslander , J et al. Potentially avoidable hospitalizations of nursing home residents: frequency, causes, and costs. J Am Geriatr Soc. 2010 Apr; 58(4): 62735. 9. Uniform Data System for Medical Rehabilitation. Functional Independent Measure. 1983 10. Dodds, T, Martin D, et al. A validation of the functional independence measure and its performance among rehabilitation inpatients. Arch Phys Med Rehabili. 1993 74(5): 531 -536. 11. Hobart J. Lamping D. , et al. Evidence based measurement: which disability scale for neurologic rehabilitation. Neurology 2001. 57; 639 -644. 12. Ottenbacher K, Hsu Y, et al The reliability of the functional indepoendence measure: a quantitative review. Arch Phys Med Rehabil 1996 77: 1226 – 1232. 13. Beck FK, Rosenthal, T. Prealbumin: A Marker for Nutritional Evaluation. American Family Physician. 2002 Apr 15; 65(8): 1575 -8.

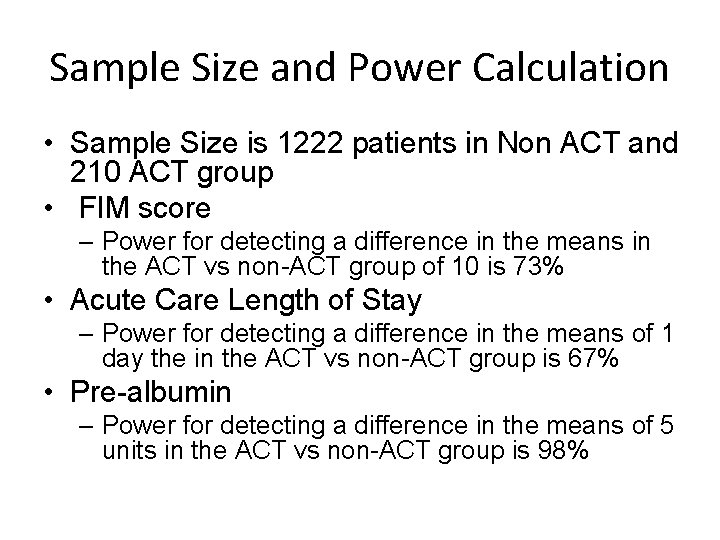
Sample Size and Power Calculation • Sample Size is 1222 patients in Non ACT and 210 ACT group • FIM score – Power for detecting a difference in the means in the ACT vs non-ACT group of 10 is 73% • Acute Care Length of Stay – Power for detecting a difference in the means of 1 day the in the ACT vs non-ACT group is 67% • Pre-albumin – Power for detecting a difference in the means of 5 units in the ACT vs non-ACT group is 98%
- Slides: 44