Prediction Methods Mark J van der Laan Division


 combinations of the original")
![Random Forest Breiman (1996, 1999) Classification and Regression Algorithm Seeks to estimate E[Y|A, W],](https://slidetodoc.com/presentation_image/c9214312e9db50b6e406ac9f4d013a49/image-6.jpg "Random Forest Breiman (1996, 1999) Classification and Regression Algorithm Seeks to estimate E[Y|A, W],")

")

- Slides: 14
Prediction Methods Mark J. van der Laan Division of Biostatistics U. C. Berkeley www. stat. berkeley. edu/~laan
Outline q Overview of Common Approaches to Prediction q. Regression qrandom. Forest q. DSA q Cross-Validation q Super Learner Method for Prediction q Example Conclusion
If Scientific Goal. . . Predict phenotype from genotype of the HIV virus . . . Prediction If Scientific Goal. . . For HIV-positive patient, determine importance of genetic mutations on treatment response . . . Variable Importance!
Common Methods Linear Regression Penalized Regression Ridge Regression: Lasso Regression Least Angle Regression Simple, less greedy Forward Stagewise regression
Common Methods Logic Regression: Finds predictors that are Boolean (logical) combinations of the original (binary) predictors Semi-parametric Regression: Non-parametric Regression: Polymars: Uses piece-wise linear splines Knots selected using Generalized Cross-Validation
Random Forest Breiman (1996, 1999) Classification and Regression Algorithm Seeks to estimate E[Y|A, W], i. e. the prediction of Y given a set of covariates {A, W} Bootstrap Aggregation of classification trees – Attempt to reduce bias of single tree Cross-Validation to assess misclassification rates – Out-of-bag (oob) error rate W 1 W 2 0 W 3 0 1 1 sets of covariates, W={ W 1 , W 2 , W 3 , . . . } Permutation to determine variable importance Assumes all trees are independent draws from an identical distribution, minimizing loss function at each node in a given tree – randomly drawing data for each tree and variables for each node
Random Forest The Algorithm – Bootstrap sample of data – Using 2/3 of the sample, fit a tree to its greatest depth determining the split at each node through minimizing the loss function considering a random sample of covariates (size is user specified) – For each tree. . Predict classification of the leftover 1/3 using the tree, and calculate the misclassification rate = out of bag error rate. For each variable in the tree, permute the variables values and compute the out-of-bag error, compare to the original oob error, the increase is a indication of the variable’s importance – Aggregate oob error and importance measures from all trees to determine overall oob error rate and Variable Importance measure. Oob Error Rate: Calculate the overall percentage of misclassification Variable Importance: Average increase in oob error over all trees and assuming a normal distribution of the increase among the trees, determine an associated p-value Resulting predictor set is high-dimensional
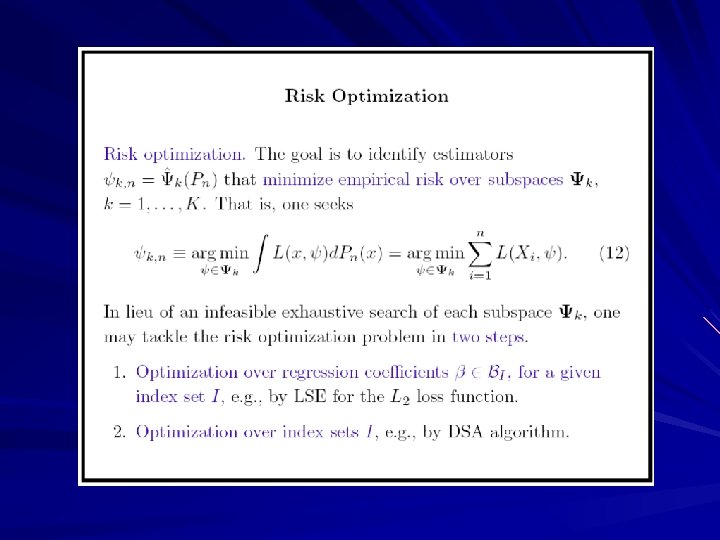
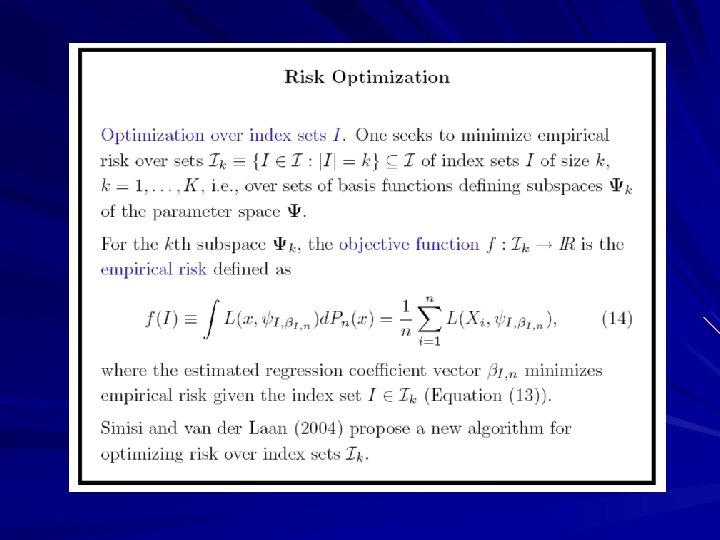
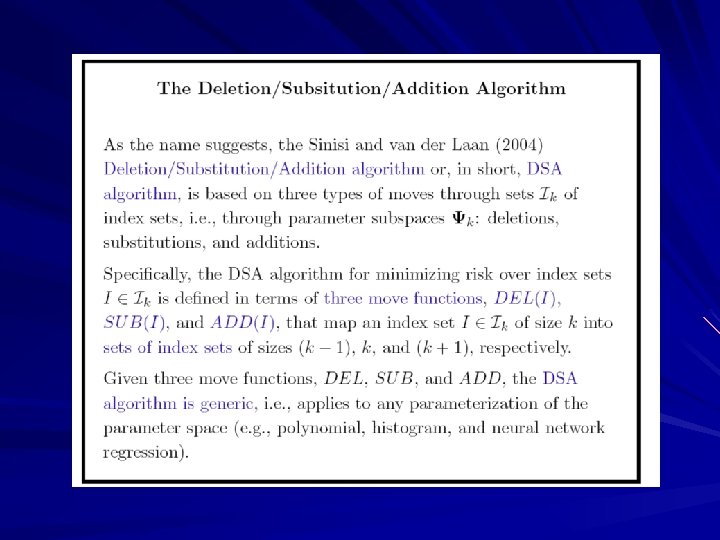
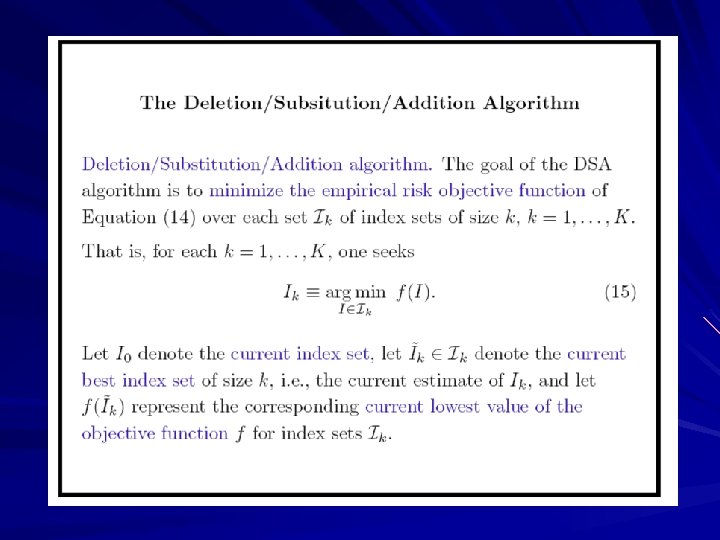
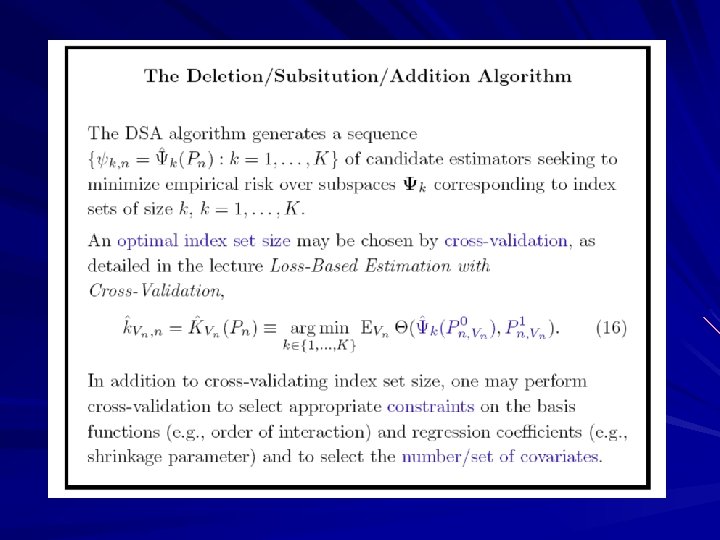
Deletion/Substitution/Addition Algorithm (DSA)