
Predicting and Comparing Medal Counts in the Summer


- Slides: 23
Predicting and Comparing Medal Counts in the Summer and Winter Olympics Emmy Yarmy University of Lynchburg Advisor: Dr. Bahaddine Taoufik
Objectives ● Predict the number of medals a country will win at the summer olympics using GDP, political history, and latitude of the country’s capital as predictors. ● Predict the number of medals a country will win at the winter olympics using the same predictors. ● Evaluate the difference between the coefficients of these predictors in the summer versus winter olympics.
Data ● GDP- measured GDP per capita, in thousands of U. S. dollars ● Political history- dummy variable where 0 indicates no socialist history and 1 indicated socialist history ● Latitude- the latitude of the country’s capital
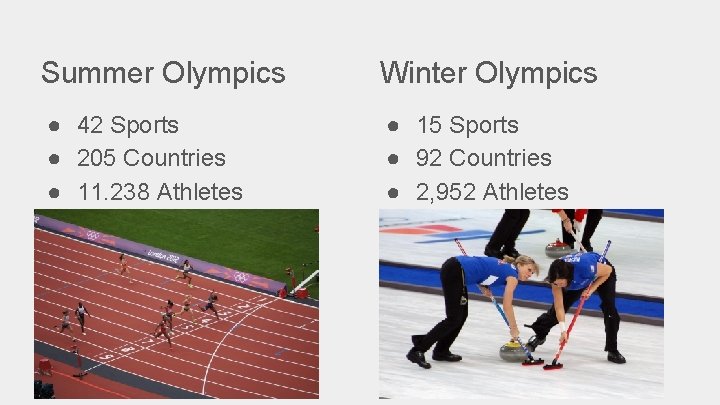
Summer Olympics Winter Olympics ● 42 Sports ● 205 Countries ● 11. 238 Athletes ● 15 Sports ● 92 Countries ● 2, 952 Athletes
Summer Olympics
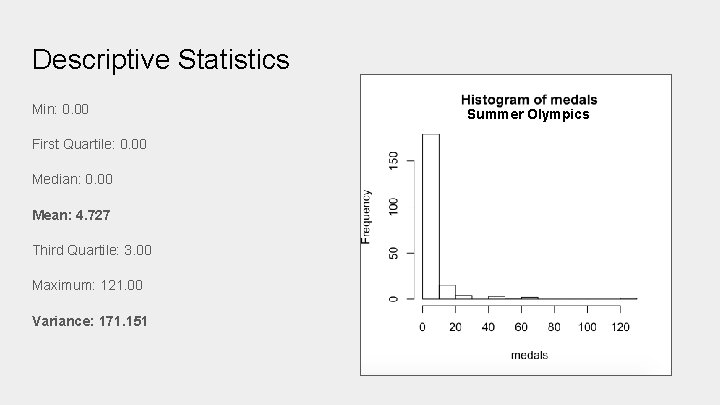
Descriptive Statistics Min: 0. 00 First Quartile: 0. 00 Median: 0. 00 Mean: 4. 727 Third Quartile: 3. 00 Maximum: 121. 00 Variance: 171. 151 Summer Olympics
Zero-Inflated Count Model
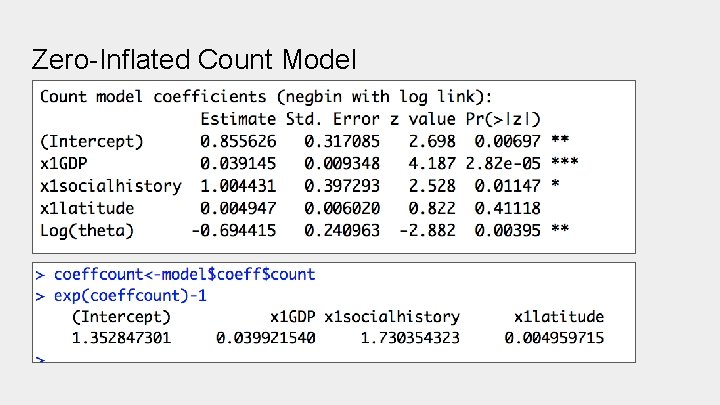
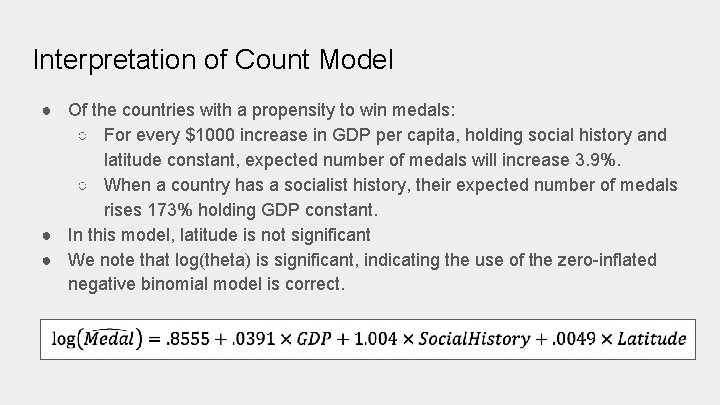
Interpretation of Count Model ● Of the countries with a propensity to win medals: ○ For every $1000 increase in GDP per capita, holding social history and latitude constant, expected number of medals will increase 3. 9%. ○ When a country has a socialist history, their expected number of medals rises 173% holding GDP constant. ● In this model, latitude is not significant ● We note that log(theta) is significant, indicating the use of the zero-inflated negative binomial model is correct.
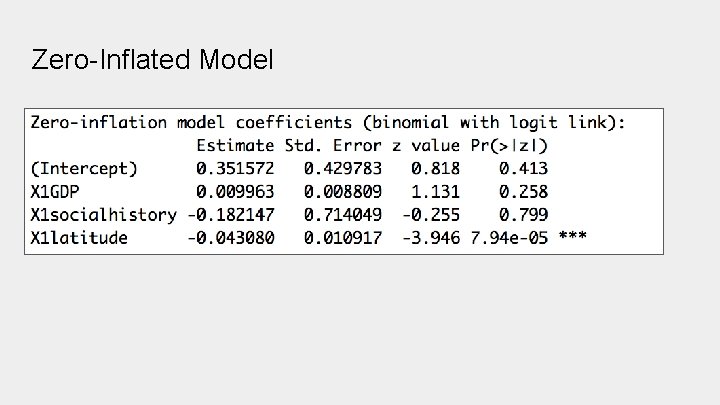
Zero-Inflated Model
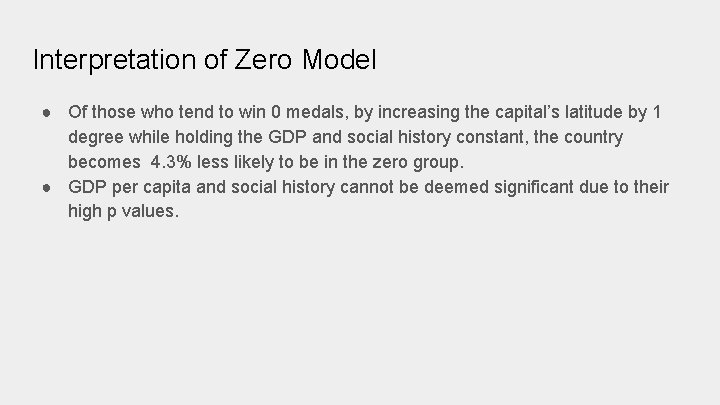
Interpretation of Zero Model ● Of those who tend to win 0 medals, by increasing the capital’s latitude by 1 degree while holding the GDP and social history constant, the country becomes 4. 3% less likely to be in the zero group. ● GDP per capita and social history cannot be deemed significant due to their high p values.
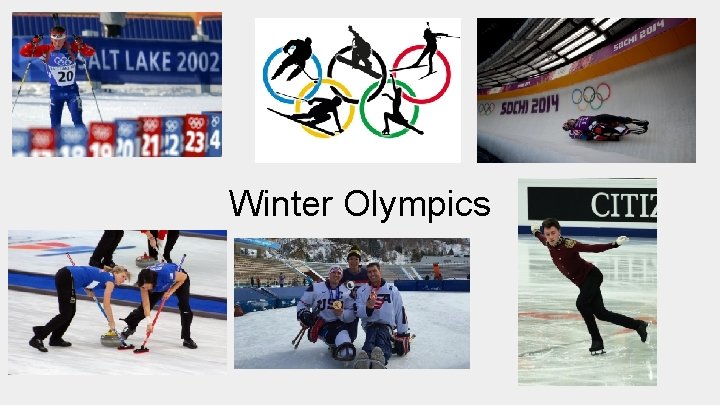
Winter Olympics
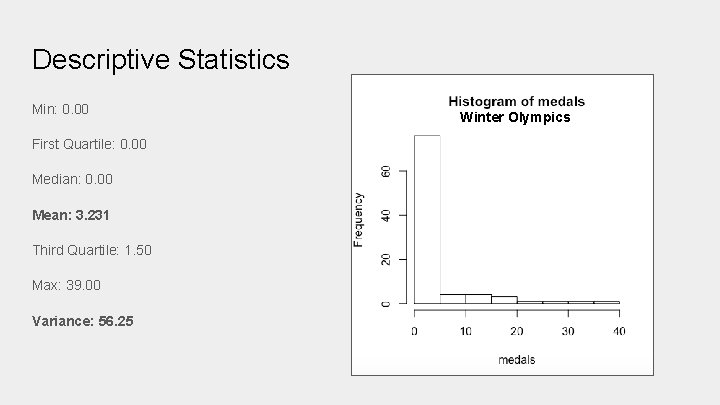
Descriptive Statistics Min: 0. 00 First Quartile: 0. 00 Median: 0. 00 Mean: 3. 231 Third Quartile: 1. 50 Max: 39. 00 Variance: 56. 25 Winter Olympics
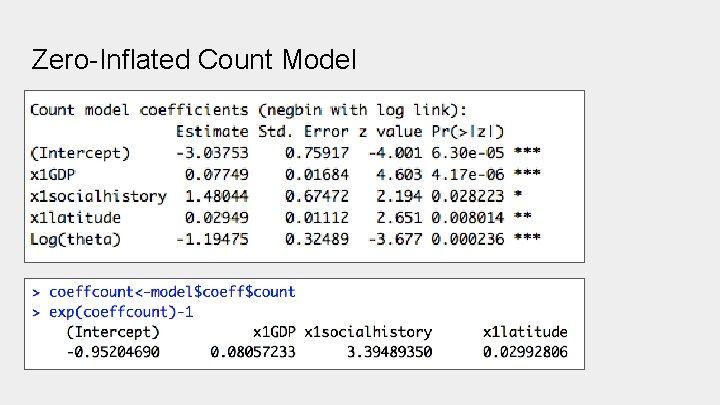
Zero-Inflated Count Model
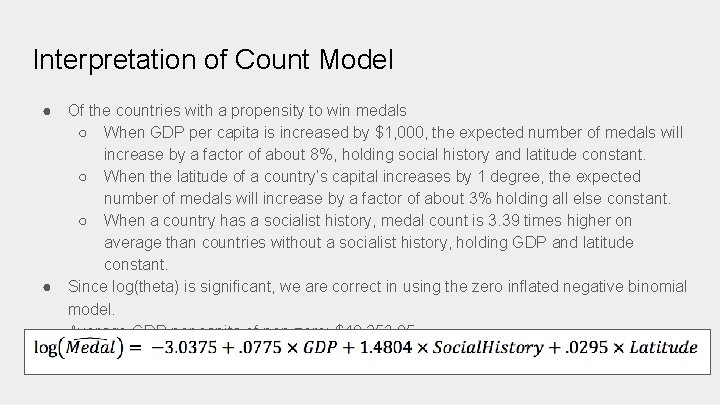
Interpretation of Count Model ● ● ● Of the countries with a propensity to win medals ○ When GDP per capita is increased by $1, 000, the expected number of medals will increase by a factor of about 8%, holding social history and latitude constant. ○ When the latitude of a country’s capital increases by 1 degree, the expected number of medals will increase by a factor of about 3% holding all else constant. ○ When a country has a socialist history, medal count is 3. 39 times higher on average than countries without a socialist history, holding GDP and latitude constant. Since log(theta) is significant, we are correct in using the zero inflated negative binomial model. Average GDP per capita of non-zero: $40, 253. 85
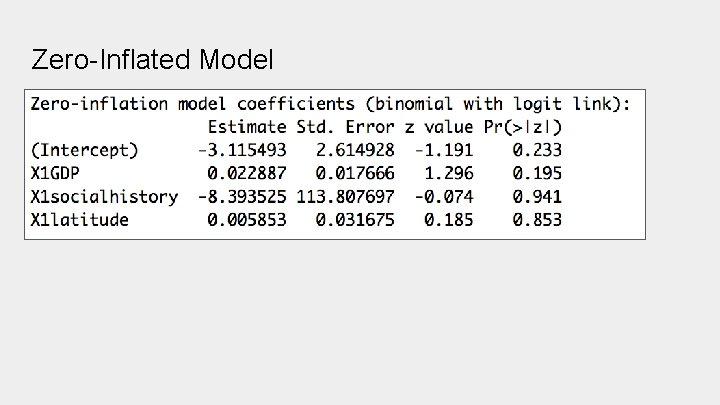
Zero-Inflated Model
Interpretation of Zero Inflated Model ● There are no significant variables in this group. ● This means that there is no variable we have discussed which would significantly impact the likelihood of a country winning 0 medals in the Winter Olympics.
Comparing Summer and Winter
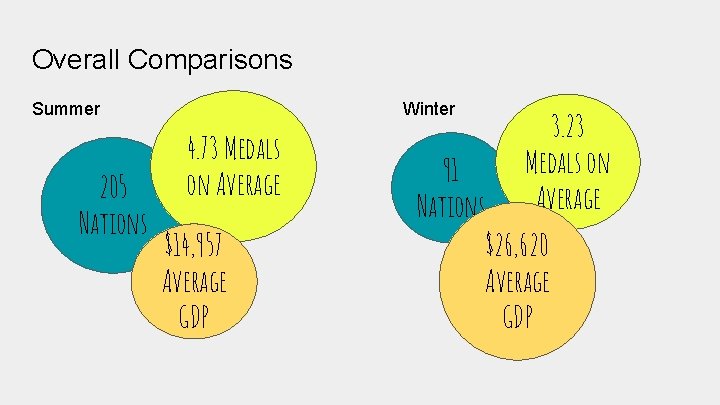
Overall Comparisons Summer 205 Nations Winter 4. 73 Medals on Average $14, 957 Average GDP 91 Nations 3. 23 Medals on Average $26, 620 Average GDP
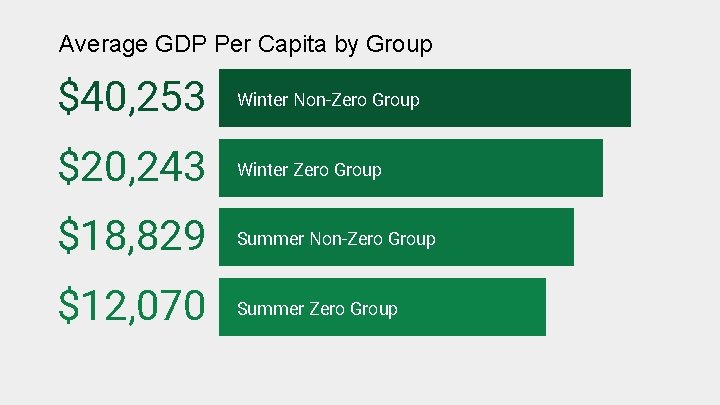
Average GDP Per Capita by Group $40, 253 Winter Non-Zero Group $20, 243 Winter Zero Group $18, 829 Summer Non-Zero Group $12, 070 Summer Zero Group
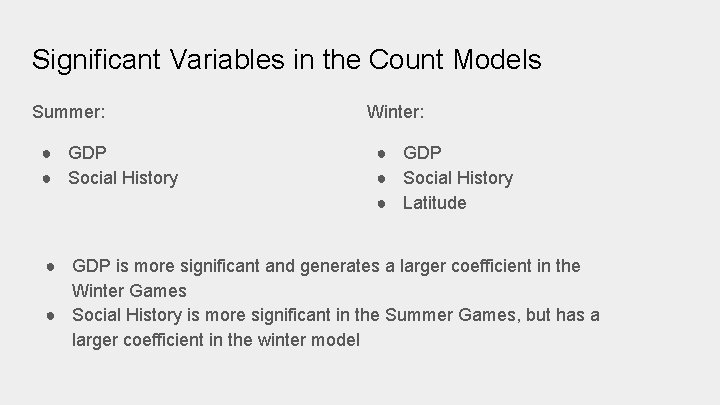
Significant Variables in the Count Models Summer: ● GDP ● Social History Winter: ● GDP ● Social History ● Latitude ● GDP is more significant and generates a larger coefficient in the Winter Games ● Social History is more significant in the Summer Games, but has a larger coefficient in the winter model
Results ● In order to even gain entry into the Winter Olympics, you have to be a wealthier country. The zero group average GDP per capita of the Winter Olympics is almost $2000 higher than the non-zero group of the Summer Olympics. ● In the Summer Games, higher latitude countries are less likely to be in the zero group. ● The most likely country to win a medal would be a wealthy country with a high latitude and socialist history competing in the winter games.
Works Cited “ 2016 Summer Olympics. ” Wikipedia, Wikimedia Foundation, 23 Apr. 2018, en. wikipedia. org/wiki/2016_Summer_Olympics. “ 2018 Peyong. Chang Olympics Medal Standings. ” NBC Olympics, www. nbcolympics. com/medals. “ 2018 Winter Olympics. ” Wikipedia, Wikimedia Foundation, 23 Apr. 2018, en. wikipedia. org/wiki/2018_Winter_Olympics. Bian, Xun. “Predicting Olympic Medal Counts: the Effects of Economic Development on Olympic Performance. ” The Park Place Economist, XIII, pp. 37– 44. , www. iwu. edu/economics/PPE 13/bian. pdf. “COUNTRY COMPARISON : : GDP - PER CAPITA (PPP). ” Central Intelligence Agency, www. cia. gov/library/publications/the-world-factbook/rankorder/2004 rank. html. Econometricsacademy. Count Data Models in R. Youtube, Youtube. com, 17 Feb. 2013, www. youtube. com/watch? v=y. LF 45 x 70 A 3 o. Graettinger, Dan, and TIm Graettinger. “Predicting the 2014 Winter Olympic Medal Count. ” Discovery Corps Inc. , 2014, www. discoverycorpsinc. com/winter-olympic-medal-predict_1/.
“List of National Capitals by Latitude. ” Wikipedia, Wikimedia Foundation, 23 Apr. 2018, en. wikipedia. org/wiki/List_of_national_capitals_by_latitude. “List of Socialist States. ” Wikipedia, Wikimedia Foundation, 23 Apr. 2018, en. wikipedia. org/wiki/List_of_socialist_states. Stromberg, Joseph. “Can a Statistical Model Accurately Predict Olympic Medal Counts? ” Smithsonian. com, Smithsonian Institution, 5 Feb. 2014, www. smithsonianmag. com/science-nature/can-statistical-model-accurately-predict-olympic-medalcounts-180949627/. “WWS 509. ” Princeton University, The Trustees of Princeton University, data. princeton. edu/wws 509/r/overdispersion. html. “Zero-Inflated Negative Binomial Regression | Stata Annotated Output. ” IDRE Stats, UCLA, stats. idre. ucla. edu/stata/output/zeroinflated-negative-binomial-regression/.