Precision tests of calculated internalconversion coefficients the case


 and why do we care? The internal")


 experimental")


 Gammas from 122 Sb (2. 7238 d 2) Eg (ke. V)")


- Slides: 25
Precision tests of calculated internal-conversion coefficients: the case of 134 Cs. W. E. Rockwell Cyclotron Institute, TAMU Summer 2005 Advisor: J. C. Hardy
Outline • Background: – -decay – Internal conversion – Define internal conversion coefficient • Two theories: – Hole and no hole • • Purpose Experiment Results/Calculations Conclusion
-Ray Emission Gamma-ray emission can occur during the de-excitation of a nucleus. Energy is released in the form of an electromagnetic wave of high energy called a gamma ray.
Internal Conversion Internal conversion is a transition that competes with gamma ray emission. When internal conversion takes place the energy from the de-excitation of the nucleus is transferred to an atomic electron. The electron is then ejected with some kinetic energy.
What is an Internal Conversion Coefficient (ICC) and why do we care? The internal conversion coefficient of a transition is defined as the ratio of the probabilities of internal conversion to ray emission for that transition. Importance: • Nuclear decay schemes – Spin and parity assignments, Transition rates, Branching ratios • Detector calibration
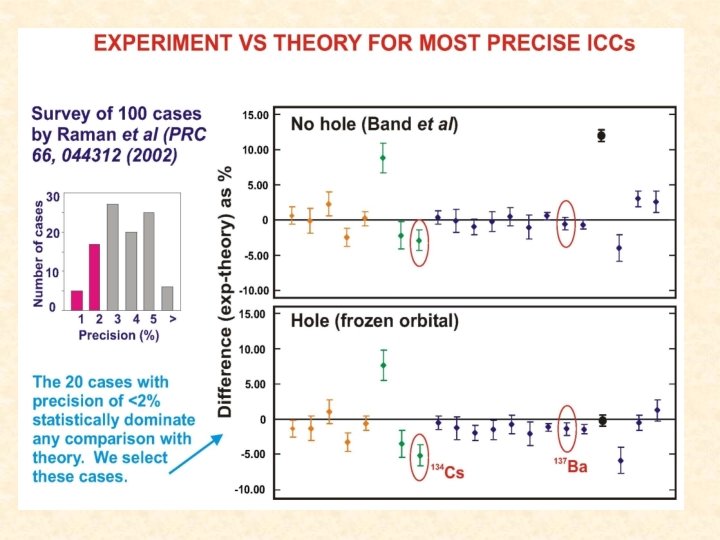
Theoretical Problems • Calculated ICC values depend strongly on how theory deals with the hole left by the departing conversion electron. • One approach assumes that it is filled instantaneously, while the other considers that it stays empty throughout the entire conversion process. • The problem with the “no hole” theory is that in fact the electron leaves the atom in less time than it takes for the atomic hole to be filled.
More Problems • Most calculated results of ICCs are only known to agree with experimental results on an average of a few percent, and there are some cases of much more significant discrepancies. • To date there are few exact measurements of ICCs with an uncertainty below one percent and this lack of precision makes it difficult to be definitive about the validity of either treatment of the hole.
Purpose • In S. Raman et al, Phys. Rev. C 66, 044312 (2002) experimental values of ICCs were used to help make the argument that the “no hole” theory fit the experimental data better. – For 134 Cs, both theoretical values disagreed with experiment. – The uncertainty of the 134 Cs experimental value was nearly two percent. • Our experiment: – For our experiment we aimed to have an uncertainty less than one percent in order to achieve a demanding test of theories.
Experiment • • • Made solutions of Cs. NO 3, Cs. Cl, Cs 2 CO 3 using very pure chemicals. • Cs. NO 3 -99. 999% Cs. Cl-99. 999% Cs 2 CO 3 -99. 995% Made a thin circular layer of very diluted insulin on a 1 inch square of Mylar. • Dropped 0. 05 ml of each solution on layer of insulin. Dried drops using vacuum chambers and a dry box and covered with hat shaped tops Neutron activated samples at TRIGA reactor in the Texas A & M University Nuclear Science Center 133 Cs(n, ) 134 Cs Used a disposable vacuum bag to cut off hat-like top and covered sample with Kapton tape. Placed sample exactly 15. 1 cm from detector and took 3 -5 consecutive spectra.
Decay Scheme ENDSF website
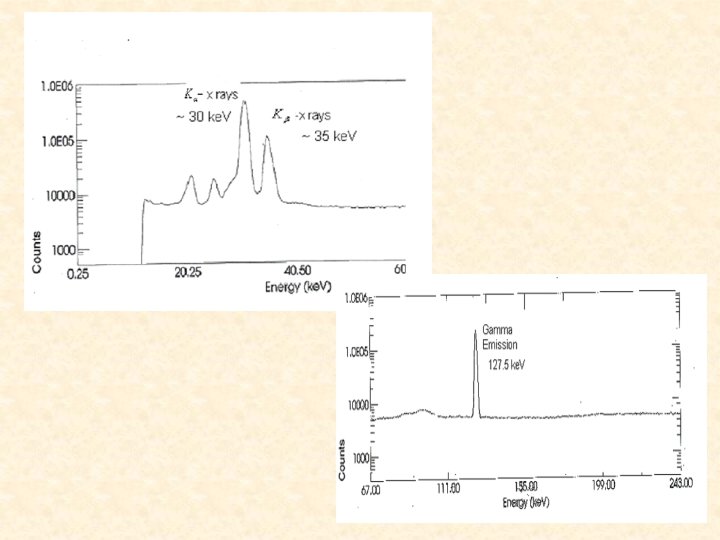
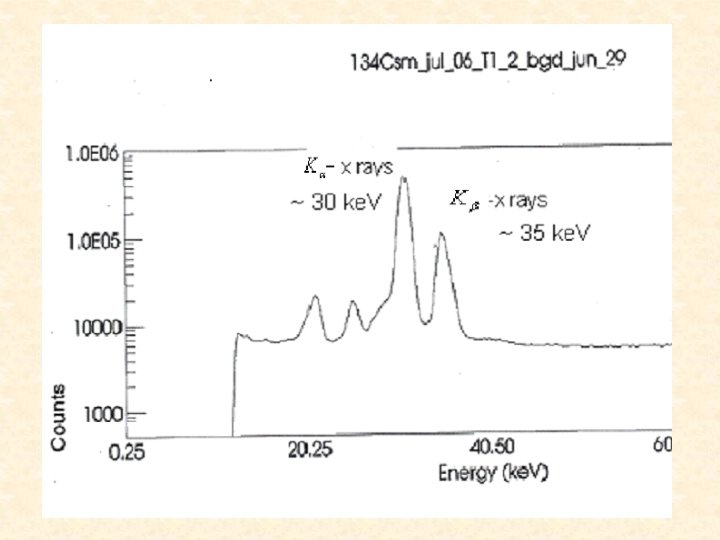
Data We used two spectra from our Cs. Cl source and one from the Cs. NO 3 source. 134 Cs
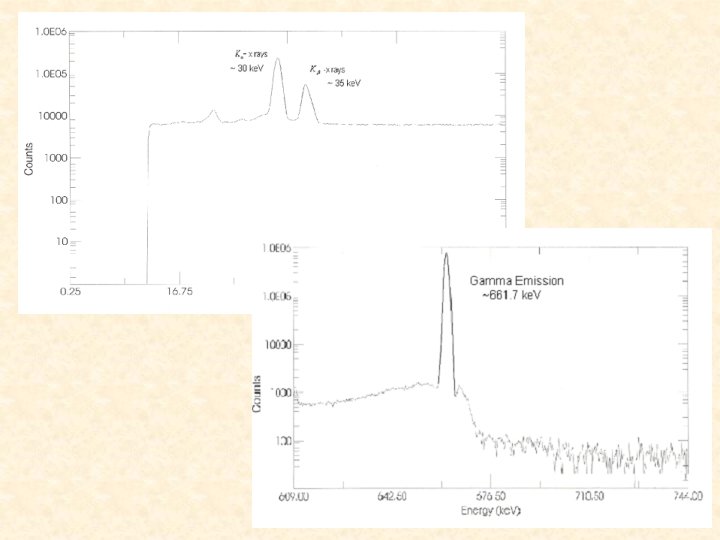
137 Ba
Impurity Analysis We used nuclide and radiation searches in order to identify the peaks caused by the impurities. For the searches we used the Nuclear Science Division LBNL website.
TORI Data (1999) Gammas from 122 Sb (2. 7238 d 2) Eg (ke. V) Ig (%) Decay mode 564. 119 17 71 b- 692. 794 17 3. 85 13 b- 1256. 901 19 0. 81 4 b- If we can make an educated guess as to what the impurity is we can use an nuclide search to confirm its identity. For instance if we guess that the peak is 122 Sb then we can see from the nuclide search there should also be a peak at 564. 1. The ratios of the areas of the two peaks should also correspond with that ratio of the intensities 71 and 3. 85. * Tables from LBNL website If we don’t have any solid ideas about what impurity causes the peak then we can use a radiation search to look for possible nuclides. The nuclides found are then tested using the same methods as before. Eg (ke. V) Decay Parent Ig (%) Half life mode 692. 70 20 1. 08 13 b- 3. 130 h 9 112 Ag 692. 794 17 1. 355 2 e+b+ 5 3. 63 m 6 122 I 692. 794 17 3. 85 13 b- 2. 7238 d 2 122 Sb 692. 8 1 0. 024 e+b+ 16. 01 h 13 170 Hf 692. 8 4 0. 07 5 e+b+ 4. 3 m
Impurity Analysis The major impurities found were 56 Mn, 122 Sb, 124 Sb, 134 Cs, 82 Br and 80 Brm.
After finding all the impurities, we checked to see which impurities could have peaks that would over lap with the peaks we are concerned about (~30 -35 ke. V, 127 ke. V). In our case 122 Sb, 124 Sb and 80 Brm had peaks that could overlap with our peaks of interest. It is important to note that the actual overlap is quite small but because we want a very exact measurement we correct for the added area to our peaks.
Calculations/Results K-shell ICC fluorescence yield N peak area detector efficiency Subscript K designates K-x rays, which result from internal conversion, and subscript designates the transition -rays
The efficiency of our detector is not well known for energies less than 50 ke. V. Since our K-x rays are less than 50 ke. V we used a ratio of ICCs of 134 Cs to 137 Ba in order to minimize our uncertainty. 137 Ba was used because it has Kx rays at almost the exact same energies as 134 Cs. From the figure you can see the ratio of 137 Ba and you can also see how closely the K-x rays overlap so that the efficiency are nearly the same.
Ratio of the ICC of 134 Cs to 137 Ba The subscript 1 indicates 134 Ce and the subscript 2 indicates 137 Ba
Conclusions • From our experiment we can see that the experimental value for the ICC of 134 Cs in Raman et al, Phys. Rev. C 66, 044312 (2002) was incorrect. • This results together with our earlier measurement of 193 m. Ir indicates that the conclusion drawn in this paper needs to be re-examined and more precise measurements are needed. • Next we plan on examining the ICC of 139 La
Acknowledgements • John C. Hardy, Ninel Nica, and the rest of the wonderful research group I was working with. • National Science Foundation, REU Summer Program Under Grant NO# 463291 -00001 • Texas A & M Cyclotron Institute • Mount Holyoke College, Physics Department • Lesilie Speikes for always unlocking the door for us.