Preciptation CLASSIFICATION OF STREAMS Influent and Effluent streams


 The net")
 The ordinates of direct runoff hydrographs due to net rains of different intensities")


- Slides: 42
Preciptation
CLASSIFICATION OF STREAMS • Influent and Effluent streams If the GWT is below the bed of the stream, the seepage from the stream feeds the groundwater resulting in the build up of water mound Such streams are called influent streams. Such streams will dry up completely in rainless period and are called ephemeral streams.
The ephemeral streams, generally seen in arid regions, which flow only for a few hours after the rainfall, are of no use for conventional hydropower. However, they can occasionally be used in pure pumped storage schemes, where the actual consumption of water is only marginal.
When the GWT is above water surface elevation in the stream, the ground water feeds the stream, Such streams are called effluent streams. The base flow of surface streams is the effluent seepage from the drainage basin. Most of the perennial streams are mainly effluent streams.
• Intermittent and perennial streams. If the GWT lies above the bed of the stream during the wet season but drops below the bed during the dry season, the stream flows during wet season (due to surface runoff and ground water contribution) but becomes dry during dry seasons. Such streams are called intermittent streams.
While in the case of perennial streams, even in the most severe droughts, the GWT never drops below the bed of the stream and therefore they flow throughout the year. For power development a perennial stream is the best; power can also be generated from intermittent streams by providing adequate storage facilities.
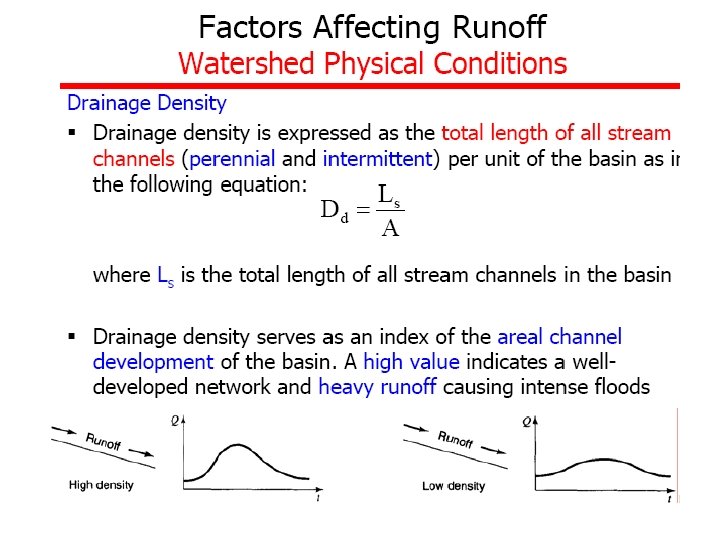
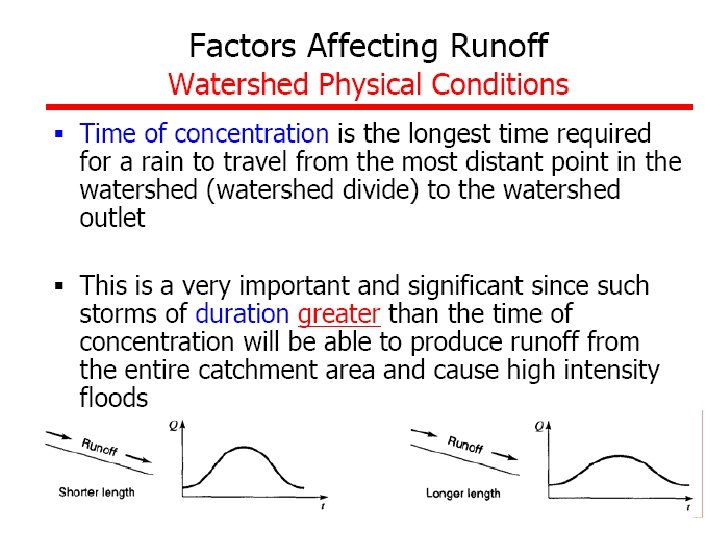
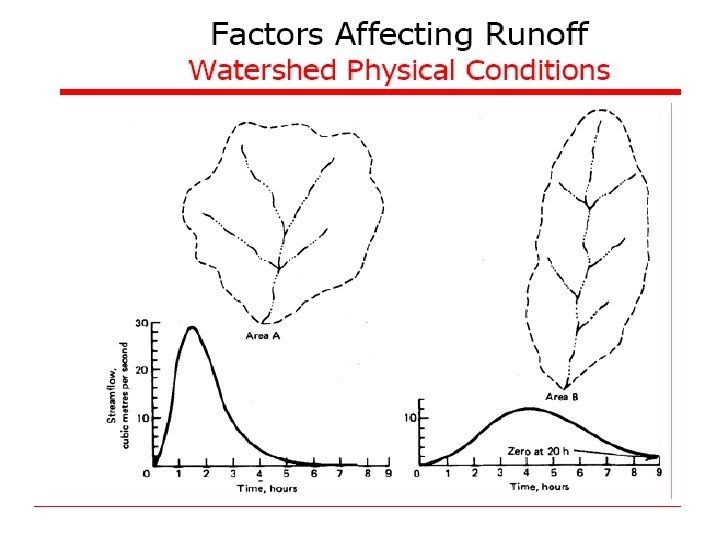
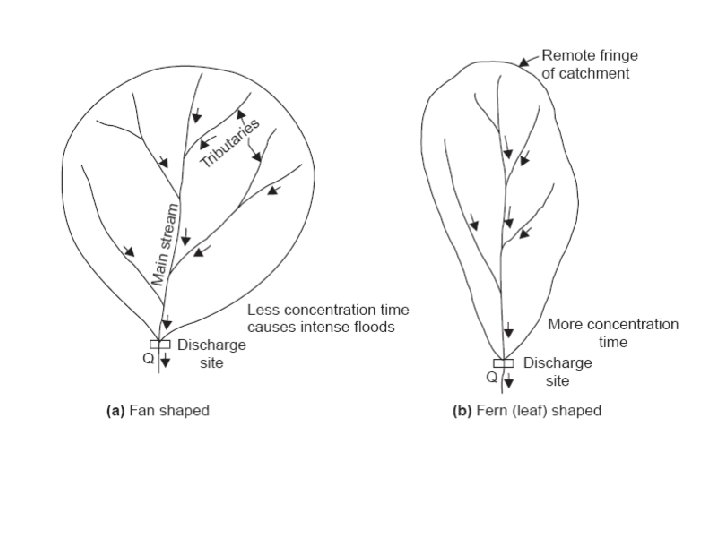
A fan-shaped catchment produces greater flood intensity since all the tributaries are nearly of the same length and hence the time of concentration is nearly the same and is less, whereas in the fern-shaped catchments, the time of concentration is more and the discharge is distributed over a long period
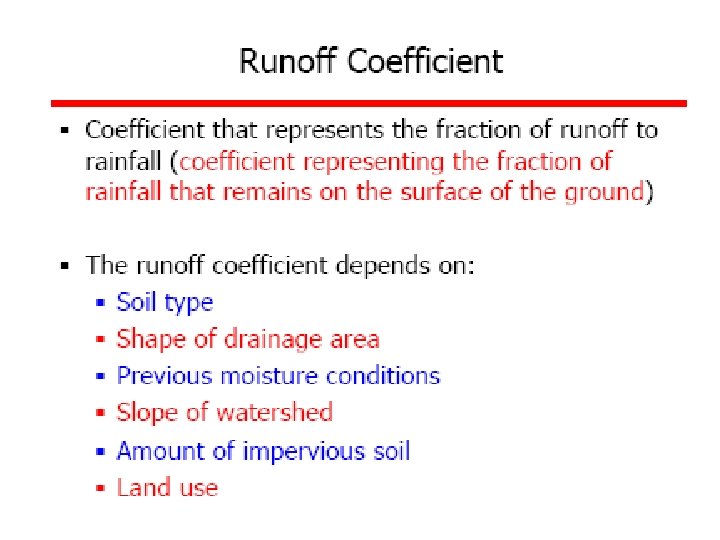
Assume Runoff Coefficient is 0. 42
Unit Hydrograph Method. The hydrograph of direct surface discharge measured at the outlet of drainage area, which produces a unit depth of direct runoff (i. e. , a Pnet of 1 cm over the entire area of the catchment) resulting from a unit storm of specified duration (called unit period) is called a unit hydrograph of that duration.
The area under the hydrograph represents a direct runoff of 1 cm,
The theory of unit hydrograph is based on the following assumptions: (i) The net rainfall is of uniform intensity within its duration (i. e. , unit period). (ii) The net rainfall uniformly occurs over the entire area of the drainage basin. (iii) For a given drainage basin, the base period of the hydrographs of direct runoff corresponding to net rains of different intensities but same unit duration, is constant.
(iv) The ordinates of direct runoff hydrographs due to net rains of different intensities (but same unit duration) are proportional. (v) A unit hydrograph reflects all the physical characteristics of the basin.
EX: the following table gives values of measured discharges ata stream-gauging site in a year. Upstream of the gauging site a weir built across the stream diverts 3 and 0. 5 Mm 3 of water per month for irrigation and for use in an industry respectively. The return flow from the irrigation is estimated as 0. 8 Mm 3 and from the industry 0. 3 Mm 3 reaching the stream upstream. Estimate the natural flow and the runoff-rainfall ratio, if the average rainfall is 185 cm and the catcment area is 180 Km 2
Application of the Unit Hydrograph. First a unit hydrograph of suitable unit duration is derived from an observed flood hydrograph for the drainage basin due to a known storm (storm loss and net rain). The unit hydrograph so derived can be applied for any other storm (of the same duration but producing different net rain) occurring on the basin and the resulting flood hydrographs can be obtained.
A river catchment has a 2 hour unit hydrograph with the ordinates 0, 3, 11, 35, 55, 66, 63, 40, 22, 9 and 2 m 3/s. Assume that the base flow at time t=0 hour is 20 m 3/s and linearly increases to 44 m 3/s at t=24 hours. a) Compute the hydrograph resulting from two successive 2 hour periods of effective rain of 2. 0 cm and 1. 5 cm respectively. b) To prevent downstream flooding, the maximum flow to be released from the catchment is set at 180 m 3/s. Calculate the space needed to store the excess water from this event (in m 3).
A river catchment has a 2 hour unit hydrograph with the ordinates 0, 3, 11, 35, 55, 66, 63, 40, 22, 9 and 2 m 3/s. Assume that the base flow at time t=0 hour is 50 m 3/s and linearly increases to 74 m 3/s at t=24 hours. a) Compute the hydrograph resulting from two successive 2 hour periods of effective rain of 2. 0 cm and 3. 0 cm respectively. b) To prevent downstream flooding, the maximum flow to be released from the catchment is set at 273 m 3/s. Calculate the space needed to store the excess water from this event (in m 3).
Derive 2 hour 1 cm Unit hydrograph from the following S-curve.
Ex: small watershed consists of 1. 5 km 2 of cultivated area (c = 0. 2), 2. 5 km 2 under forest (c = 0. 1) and 1 km 2 under grass cover (c = 0. 35). There is a fall of 20 m in a watercourse of length 2 km. The I–D–F relation for the area is given by:
Ex: 1 An irrigation tank has a catchment area of 30 km 2 and receives an annual rainfall of 90 cm. Assuming that 10% of the rainfall flows as ‘runoff’ from the catchment, calculate the area that can be brought under paddy cultivation under the tank. Assume that the tank fills one and a half times in a year and the water requirement of paddy (duty) is 100 ha-cm.
Ex: 2 the following table gives values of measured discharge at a stream gauging site in a year. Upstream of the gauging site a weir built across the stream diverts 3 Mm 3 and 0. 5 Mm 3 of water per month for irrigation and for use in an industry respectively. The return flow from the irrigation is estimated as 0. 8 Mm 3 and from the industry at 0. 30 Mm 3 reaching the stream upstream of the gauging site. Estimate the natural flow and the runoff-rainfall ratio if the catchment are is 180 Km 2 and the average annual rainfall is 185 cm.
The total quantity of surface water that can be expected in given period from a stream at the outlet of its catchment is known as yield of the catchment in that period.
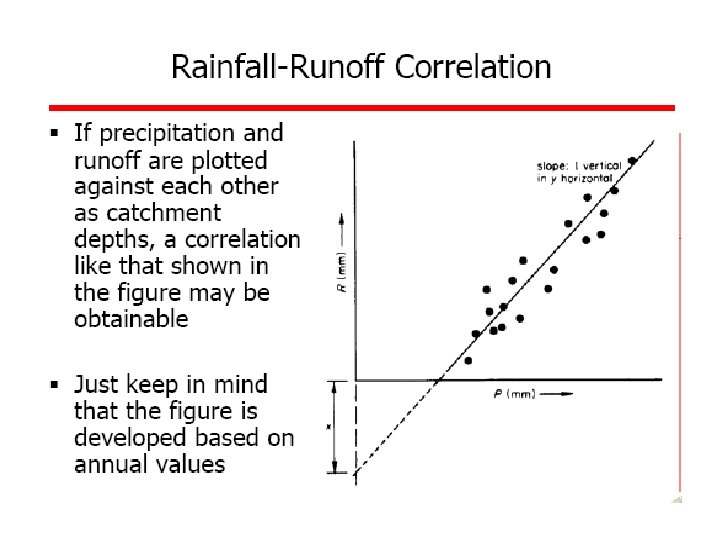
Annual measurements of rainfall and runoff for a certain watershed were summarized in the table below. Under this scenario, answer the following: 1 - Develop a linear relationship between rainfall and runoff. 2 -Find out the minimum annual rainfall necessary to produce runoff for this watershed. 3 - What would be the runoff for an annual rainfall of 950 mm?
The following table shows the observed annual rainfall and corresponding annual runoff for a small catchment. Develop the rainfall-runoff correlation equation for this catchment and find correlation coefficient. What annual runoff can be expected from this catchemnt for the annual rainfall of 100 cm?