Precipitation and IDF Curves 1 Objectives Students will

Precipitation and IDF Curves 1

Objectives Students will have the ability to: • Discuss different forms of precipitation • Explain the definition of return frequency • Create an IDF curve 2

Precipitation • Any type of falling moisture • Formed when moisture-laden air is cooled so that water condenses • Nuclei are usually needed for water droplets to form • Sources: – 90% evaporation from ocean – 10% evaporation from continents 3

Rain • Liquid Water Drops 4

Snow • Ice crystals 5
 6")
Drizzle • Mist; slow settling rates (. 04 in/hr) 6

Rime • White, opaque deposits of ice granules which are separated by trapped air. Formed by rapid freezing of supercooled water drops impinging on exposed objects. 7
 8")
Hail • Balls of ice (alternating layers of glaze and rime) 8

Sleet • Transparent, globular, solid grains of ice formed by freezing of rain drops falling through a layer of subfreezing air near the earth’s surface 9

Factors Responsible • Cyclonic-Lifting of air converging into a low -pressure area – Frontal (warm or cold) – Nonfrontal • Convective-rise of warm, lighter air in colder denser surrounding • Orographic-lifting over mountains 10
 collects and publishes data • Point rainfall")
Precip Data • National Weather Service (NWS) collects and publishes data • Point rainfall collected in vertical cylindrical rain gauges (dia. = 8”) 11

12

First Order Station • Continuous records of precipitation, temperature, humidity, wind direction, wind velocity, and other • NOAA Northeast Regional Climate Center in Ithaca, NY http: //www. nrcc. cornell. edu/ 13

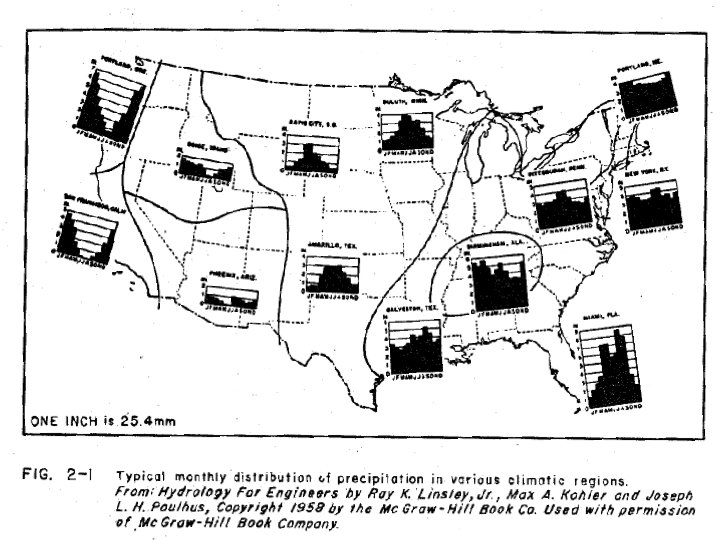
Precipitation-Varies by Region See next slide • Eastern third of country-reasonable uniform rainfall throughout the year • Central plains-Wet summer as compared to winter months • Mountainous areas-Light rainfall; not much rainfall in the summer • West Coast-Most of the rainfall in the winter months 14

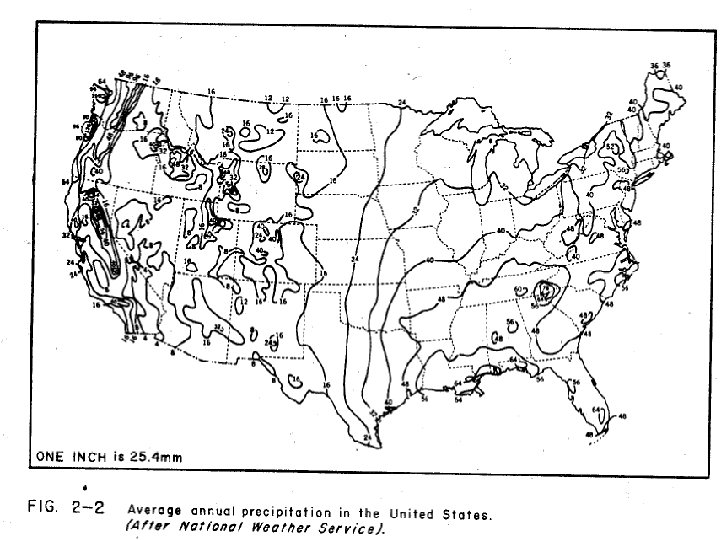
Effect of Mountains See next slide • Discontinuities in the precipitation maps caused by the Rocky Mountains, the Cascades, and to a lesser extent, the Appalachian Mountains 16

18

19

• Data is usually displayed in the form of isohyetal lines on geographical maps (total amount of rainfall in inches for a specific storm duration and for a specific recurrence interval) 20

Determining Intensity • Previous map--- shows 1” of water in 15 minutes. Convert to intensity. • 4” of water in 60 minutes • Intensity is 4” per hour 21

Intensity • 6” of precipitation falls in 2 hours • Rainfall intensity is __ per hour? 22
? 2. With respect")
Questions 1. What are the units of rainfall intensity (English system)? 2. With respect to the phrase “ 2 -year, 30 minute”. What does the 2 -year refer to? What does the 30 minutes refer to? 23

Break 24
 Storm Duration (how long")
IDF Curves • • Intensity-Duration-Frequency Rainfall Intensity (inches per hour) Storm Duration (how long the storm lasts) Frequency of storm return 25

Hydro-35 • Contains precipitation info for storms with a very short duration (<= 1 hour) • Other documents TP-40 (eastern US), Atlas 2, NOAA Atlas, etc. cover longer durations and other geographical areas. • See http: //www. nws. noaa. gov/oh/hdsc/currentpf. htm 26

Updated Data • NOAA’s NWS Precipitation Frequency Data Server • http: //hdsc. nws. noaa. gov/hdsc/pfds/ 27

Hydro-35 • 200 weather stations • 60 years of record • Includes isohyetal maps showing precipitation total for the following storm durations and frequencies: – Storm Durations (5, 15 and 60 minutes) – Frequencies (2 and 100 -years) • Equations are also given to determine data for frequencies between 2 and 100 years (5, 10, 25, 50) and for other storm durations (10 and 30 -minutes) 28

Creating an IDF Curve • Locate your particular area of interest • Calculate average intensities for: 2 -yr frequency (5, 15, and 60 minutes) 100 -yr frequency (5, 15, and 60 minutes) • Obtain other values from equations on page 28 • Graph results 29

http: //www. mathworks. com/matlabcentral/fileexcha nge/9740 -intensity-duration-frequency-curves

http: //www. pub. gov. sg/general/code/Pages/Surface. Drainage. Par t 2 -7. aspx

Design Frequencies • It is not economically feasible to provide protection against the largest flood that could occur. • For large projects (bridges/dams) a 100 -yr frequency is often used • For smaller projects design year depends on agency, type of facility, etc. 32

NYSDOT • Cross-Drainage – Interstates/major arterials 50 -yr – Minor arterials, collectors, local (lower if justified) • 10 to 25 -yr is common – Check 100 -yr • Roadside Surface Drainage System – Pipes, inlets, gutters 10 (arterials) or 5 -yr (local/collector) – Underpasses 50 -yr (collectors/local 25 -yr) – Ditches • Depth 25 (or 10 for minor arterials/collectors/local) • Velocity 10 (or 5 for minor arterials/collectors/local) 33

Statistics • Precipitation graphs are based on statistics and include the element of frequency (a 2 -yr storm theoretically happens once every 2 years) • The probability (P) of precipitation amounts equaling or exceeding a return frequency (Tr) is: • P=1/Tr 34

Example • The probability of precipitation amounts equaling or exceeding a 2 -yr storm is • P=1/2=0. 5=50% • In other words, each year there is a 50% chance that precipitation will exceed that of a 2 -yr storm 35

Relationship to design • If culverts are designed to pass flows of annual probability P, then it implies that on average P*N culverts will be overtopped each year, where N is the total number of culverts. • If a county has 100 culverts and they’re designed for a 2 -yr frequency then on average 50 culverts will be topped each year • Note: Discuss concept of freeboard 36
 of")
Probabilities over Time • What if you want to know the probability (J) of an event (F) occurring over a specified interval of time (N)? • J=1 -(1 -P)N • Where P=1/F 37
")
Probabilities over Time: Proof • What if you want to know the probability (J) of a 100 -yr event (F) occurring over a period (N)? • Probability each year that event occurs (P) = 1/F • Probability each year that event does not occur=(1 -P) • Probability that event does not occur over a time period (N)=(1 -P)N • Probability (J) that event does occur over a time period (J)=1 -(1 -P) N If you have an event that has a probability of 0. 01 of "happening" in a given trial, and so a probability of 0. 99 of "not happening", then (1 - 0. 01)^10 is the probability it does NOT happen in 10 consecutive trials. (1 - 0. 99)^10= 0. 01^10 is the probability it DOES happen in all ten trials. They don't add to 1 because there are many other things that could happen: happen in the first trial but not in other trials, happen on the first and third trial but not on other trials, etc. "happen on all trials" and "happen on no trials" do not exhaust all the possible outcomes. 38

Probabilities over Time Example • What is the probability of a 100 -year flood occurring over the 10 -yr interval it will take to build a dam? • J=1 -(1 -P)N • J=1 -(1 -. 01)10 • J=9. 6% • There is a 9. 6% chance that the 100 -yr event will be equaled or exceeded during the next 10 years 39

Questions • With respect to an IDF curve: – What is I? Units? – What is D? Units? – What is F? Units? • If you use Hydro-35 can you directly obtain intensities? If not, what do you have to do to get the intensity numbers? 40

Next Lecture • Hyetographs 41
- Slides: 41