Precedence Diagramming Method Example Precedence Diagramming Method PDM

 is a visual representation technique which is used to prepare")


- Slides: 11
Precedence Diagramming Method Example
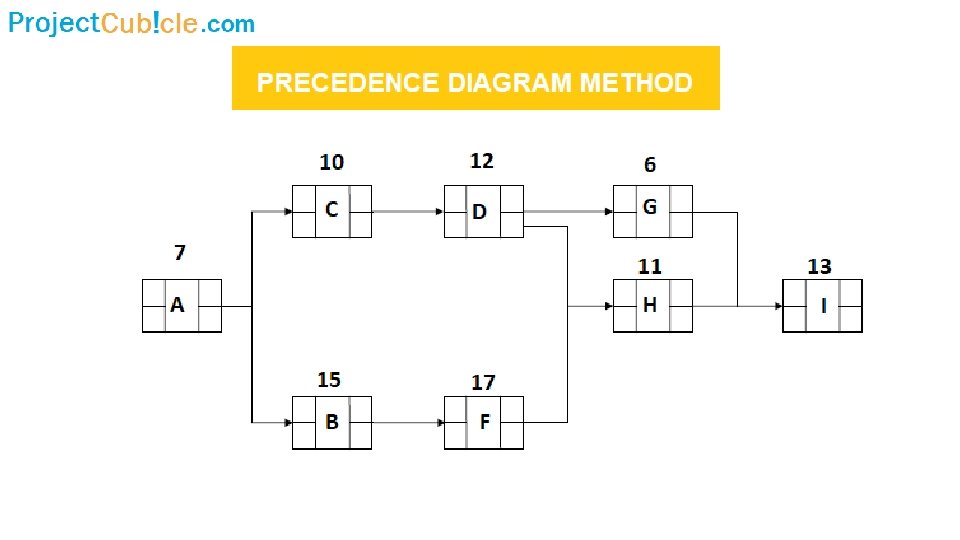
Precedence Diagramming Method (PDM) is a visual representation technique which is used to prepare the project schedule network diagrams and determine the critical path. The main advantage of Precedence Diagramming Method (PDM) is that it demonstrates the activity relationships.
Precedence Diagramming Method It is critical for a project manager to realise the activity relationships because it is important while preparing the network diagram and then creating the project schedule. For better understanding, let’s analyze the example and follow the steps.
In this example A, B, C, D, F, G, H, I are the activities. Numbers above the boxes are the durations. Activity B is a predecessor activity that logically comes before a dependent activity F in this network system. Activity F is a successor activity is a dependent activity that logically comes after the Activity F. There is a F-S Relationship between activity B and F.
Step 1 : PDM Forward Pass Calculations specify the minimum dates at which each activity can be performed and, ultimately, the minimum duration of a project.
Step 2 : PDM Backward Pass Calculations determine the latest dates by which each activity can be performed without increasing the projects minimum duration.
Step 3 : PDM Float Calculation for Each Activity
Step 3 : PDM Float Calculation for Each Activity Total float is the amount of time that an activity can be delayed without delaying the project completion date. Total float is 0 on the critical path. Total Float: LS – ES = 17 -7 = 10 Total Float: LF – EF = 27 -17 = 10 Total float can be calculated by subtracting the Early Start date of an activity from its Late Start date or Early Finish date from its Late Finish date.
Step 4 : PDM Identifying the critical path
Summary When we analyze the network diagram we will see that there are some paths and every path have duration. The critical path is the longest path in the network diagram and total float of critical path is zero. In this simpe example we show to make forward, backward, total float and critical path calculation. The Precedence Diagramming Method (PDM) enables us to make these calculations correctly. By the help of softwares it is very easy to make these calculations. Reference: https: //www. projectcubicle. com/