
Pre K12 Assessment Report Van Buren Community Schools
Pre. K-12 Assessment Report Van Buren Community Schools 2009 -2010
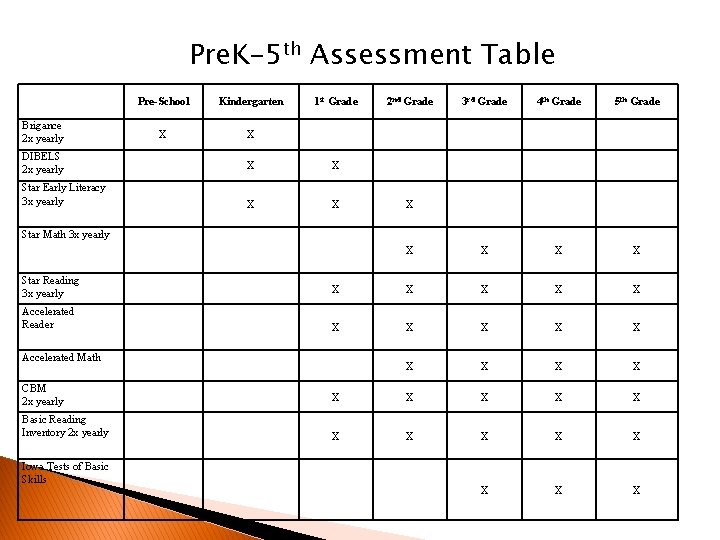
Pre. K-5 th Assessment Table Brigance 2 x yearly Pre-School Kindergarten X X 1 st Grade DIBELS 2 x yearly X X Star Early Literacy 3 x yearly X X 2 nd Grade 3 rd Grade 4 th Grade 5 th Grade X X X Star Math 3 x yearly Star Reading 3 x yearly X X X Accelerated Reader X X X X X Accelerated Math CBM 2 x yearly X X X Basic Reading Inventory 2 x yearly X X X X Iowa Tests of Basic Skills
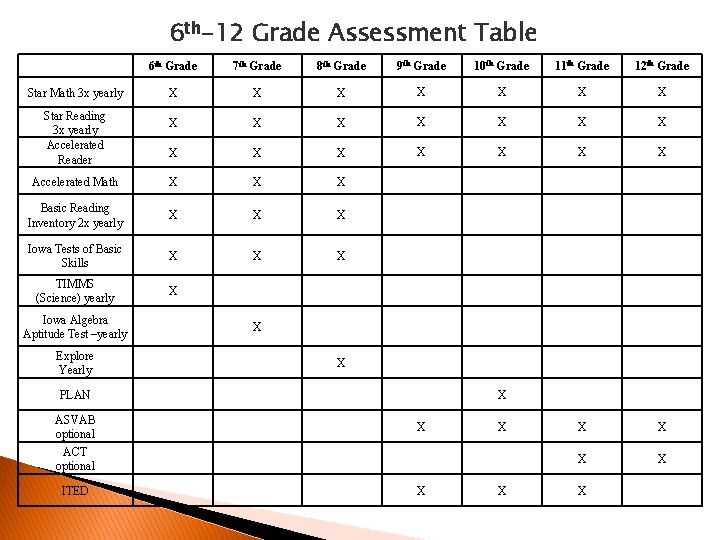
6 th-12 Grade Assessment Table 6 th Grade 7 th Grade 8 th Grade 9 th Grade 10 th Grade 11 th Grade 12 th Grade X X X X X X Accelerated Math X X X Basic Reading Inventory 2 x yearly X X X Iowa Tests of Basic Skills X X X TIMMS (Science) yearly X X X Star Math 3 x yearly Star Reading 3 x yearly Accelerated Reader Iowa Algebra Aptitude Test –yearly Explore Yearly X X X PLAN ASVAB optional ACT optional ITED X X X
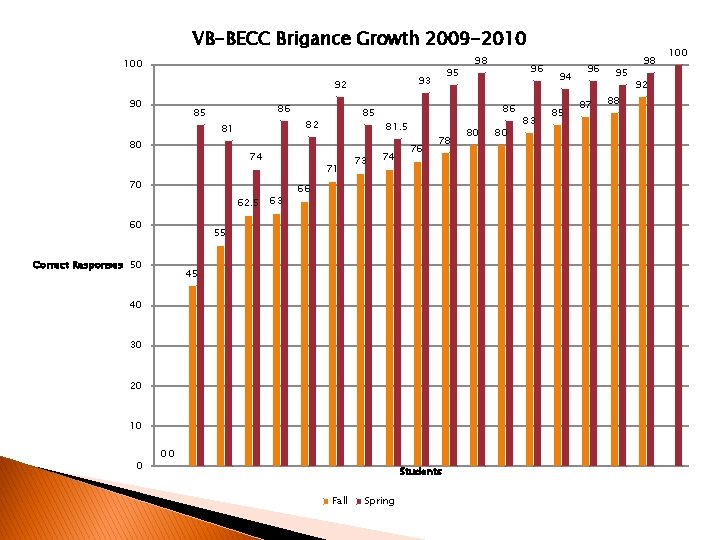
VB-BECC Brigance Growth 2009 -2010 100 92 90 86 85 80 74 71 70 62. 5 60 85 82 81 63 95 93 73 81. 5 74 76 78 66 45 40 30 20 10 0 00 Students Fall 96 86 55 Correct Responses 50 98 Spring 80 80 83 94 85 96 87 95 88 98 92 100
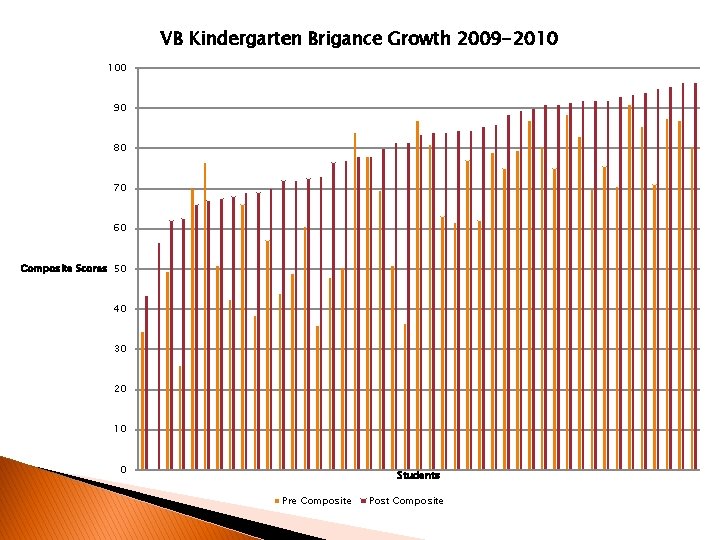
VB Kindergarten Brigance Growth 2009 -2010 100 90 80 70 60 Composite Scores 50 40 30 20 10 0 Students Pre Composite Post Composite
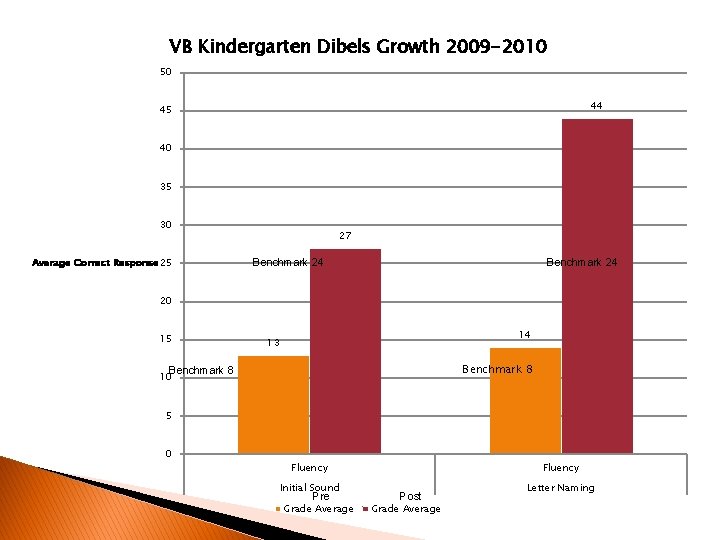
VB Kindergarten Dibels Growth 2009 -2010 50 44 45 40 35 30 Average Correct Response 25 27 Benchmark 24 20 15 14 13 Benchmark 8 10 5 0 Fluency Initial Sound Pre Grade Average Fluency Post Grade Average Letter Naming
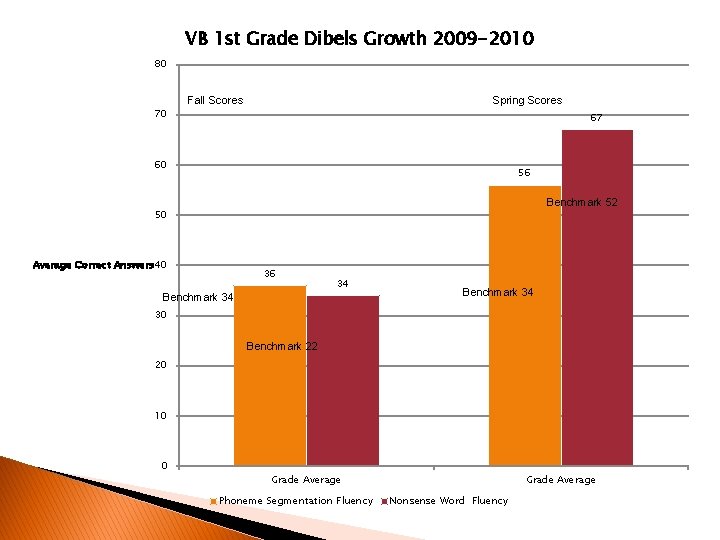
VB 1 st Grade Dibels Growth 2009 -2010 80 70 Fall Scores Spring Scores 67 60 56 Benchmark 52 50 Average Correct Answers 40 36 34 Benchmark 34 30 Benchmark 22 20 10 0 Grade Average Phoneme Segmentation Fluency Grade Average Nonsense Word Fluency
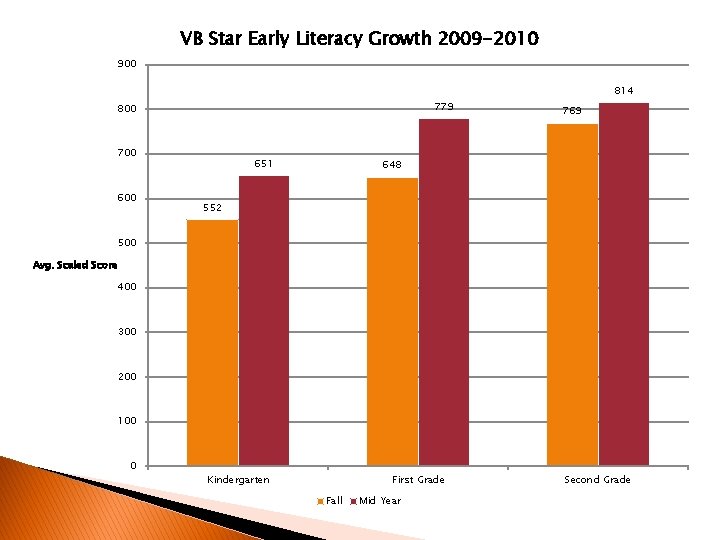
VB Star Early Literacy Growth 2009 -2010 900 814 779 800 700 651 769 648 552 500 Avg. Scaled Score 400 300 200 100 0 Kindergarten First Grade Fall Mid Year Second Grade
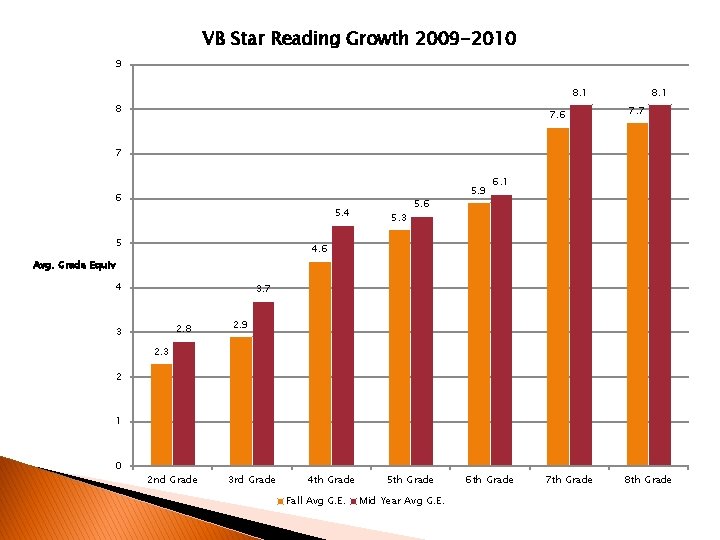
VB Star Reading Growth 2009 -2010 9 8. 1 8 7. 6 8. 1 7. 7 7 6 5. 4 5 5. 3 5. 6 5. 9 6. 1 4. 6 Avg. Grade Equiv 4 3. 7 2. 8 3 2. 9 2. 3 2 1 0 2 nd Grade 3 rd Grade 4 th Grade Fall Avg G. E. 5 th Grade Mid Year Avg G. E. 6 th Grade 7 th Grade 8 th Grade
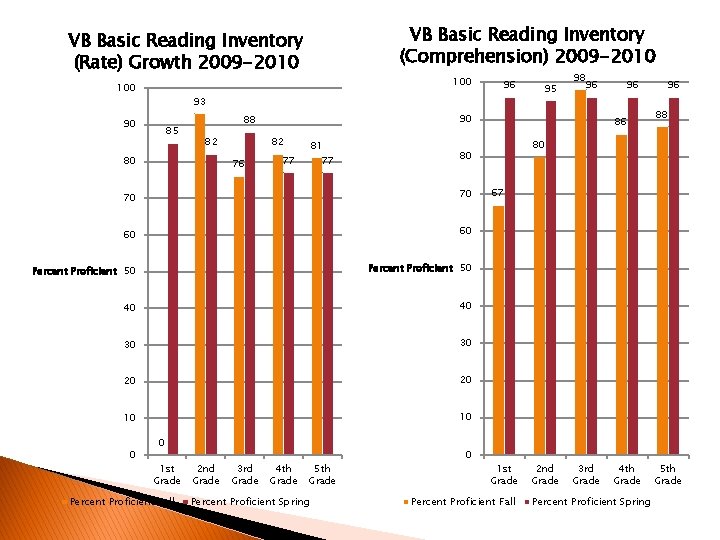
VB Basic Reading Inventory (Comprehension) 2009 -2010 VB Basic Reading Inventory (Rate) Growth 2009 -2010 100 93 90 85 82 82 76 81 77 77 70 60 60 Percent Proficient 50 40 40 30 30 20 20 10 10 0 Percent Proficient Fall 2 nd Grade 3 rd Grade 98 96 4 th Grade 5 th Grade Percent Proficient Spring 0 96 86 96 88 80 80 70 1 st Grade 95 90 88 80 0 96 67 1 st Grade Percent Proficient Fall 2 nd Grade 3 rd Grade 4 th Grade Percent Proficient Spring 5 th Grade
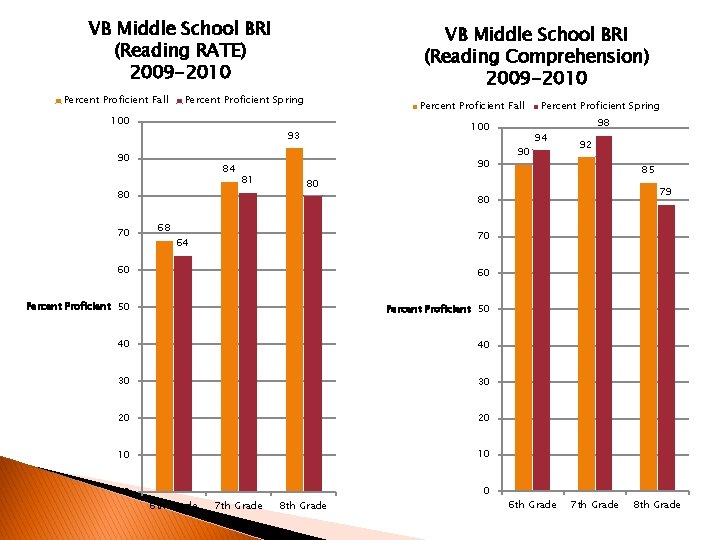
VB Middle School BRI (Reading RATE) 2009 -2010 Percent Proficient Fall Percent Proficient Spring 100 Percent Proficient Fall 100 93 90 84 80 70 VB Middle School BRI (Reading Comprehension) 2009 -2010 90 81 90 Percent Proficient Spring 94 98 92 85 80 79 80 68 70 64 60 60 Percent Proficient 50 40 40 30 30 20 20 10 10 0 0 6 th Grade 7 th Grade 8 th Grade
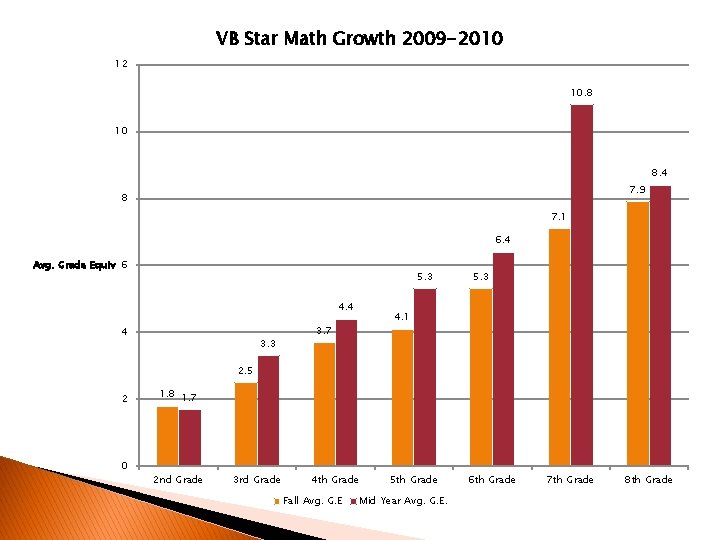
VB Star Math Growth 2009 -2010 12 10. 8 10 8. 4 7. 9 8 7. 1 6. 4 Avg. Grade Equiv 6 5. 3 4. 4 4 3. 3 5. 3 4. 1 3. 7 2. 5 2 0 1. 8 1. 7 2 nd Grade 3 rd Grade 4 th Grade Fall Avg. G. E 5 th Grade Mid Year Avg. G. E. 6 th Grade 7 th Grade 8 th Grade
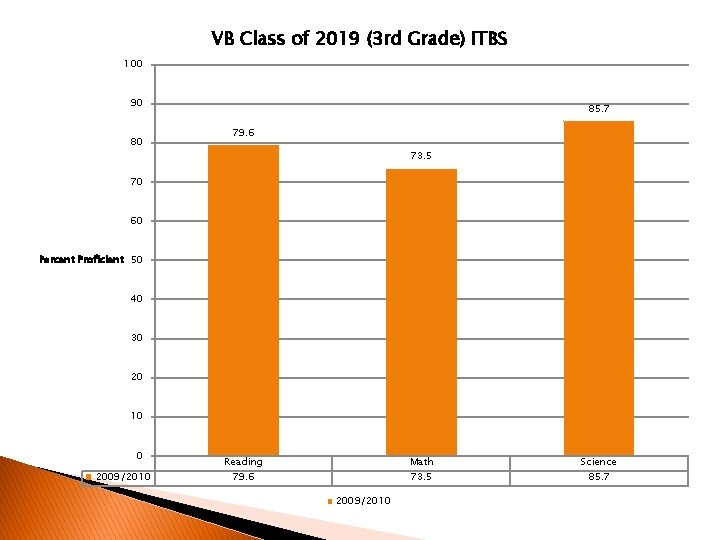
VB Class of 2019 (3 rd Grade) ITBS 100 90 80 85. 7 79. 6 73. 5 70 60 Percent Proficient 50 40 30 20 10 0 2009/2010 Reading Math 79. 6 73. 5 2009/2010 Science 85. 7
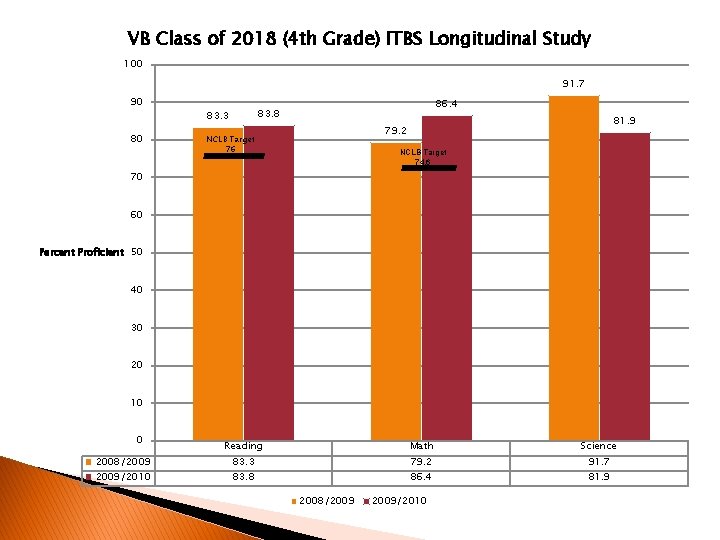
VB Class of 2018 (4 th Grade) ITBS Longitudinal Study 100 91. 7 90 80 86. 4 83. 8 83. 3 81. 9 79. 2 NCLB Target 76 NCLB Target 74. 6 70 60 Percent Proficient 50 40 30 20 10 0 2008/2009/2010 Reading Math Science 83. 8 86. 4 81. 9 83. 3 79. 2 2008/2009/2010 91. 7
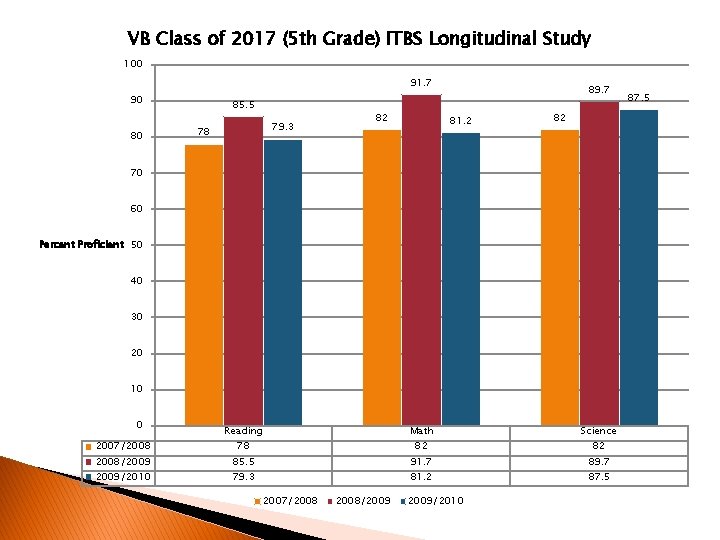
VB Class of 2017 (5 th Grade) ITBS Longitudinal Study 100 91. 7 90 80 85. 5 79. 3 78 82 89. 7 81. 2 82 70 60 Percent Proficient 50 40 30 20 10 0 2007/2008/2009/2010 Reading Math Science 85. 5 91. 7 89. 7 78 82 79. 3 81. 2 2007/2008/2009/2010 82 87. 5
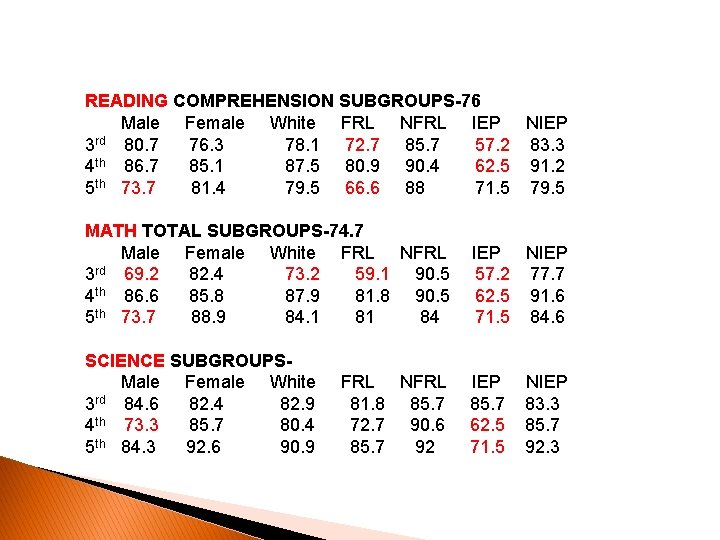
READING COMPREHENSION SUBGROUPS-76 Male Female White FRL NFRL IEP NIEP 3 rd 80. 7 76. 3 78. 1 72. 7 85. 7 57. 2 83. 3 4 th 86. 7 85. 1 87. 5 80. 9 90. 4 62. 5 91. 2 5 th 73. 7 81. 4 79. 5 66. 6 88 71. 5 79. 5 MATH TOTAL SUBGROUPS-74. 7 Male Female White FRL NFRL 3 rd 69. 2 82. 4 73. 2 59. 1 90. 5 4 th 86. 6 85. 8 87. 9 81. 8 90. 5 5 th 73. 7 88. 9 84. 1 81 84 IEP NIEP 57. 2 77. 7 62. 5 91. 6 71. 5 84. 6 SCIENCE SUBGROUPSMale Female White 3 rd 84. 6 82. 4 82. 9 4 th 73. 3 85. 7 80. 4 5 th 84. 3 92. 6 90. 9 IEP 85. 7 62. 5 71. 5 FRL NFRL 81. 8 85. 7 72. 7 90. 6 85. 7 92 NIEP 83. 3 85. 7 92. 3
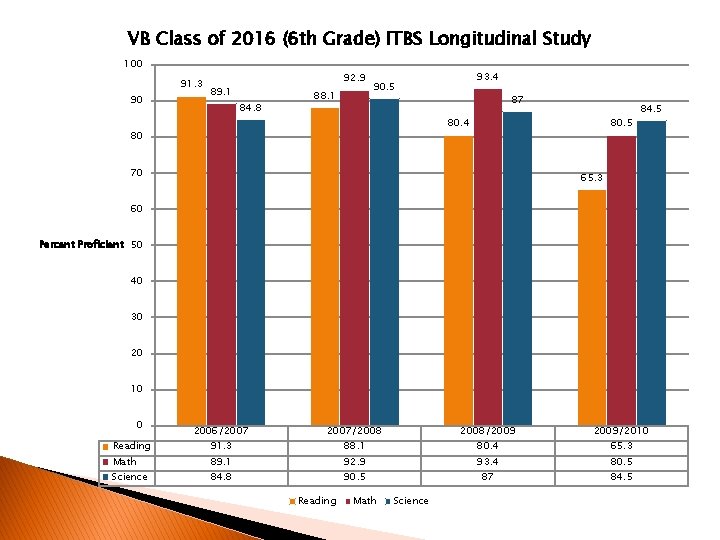
VB Class of 2016 (6 th Grade) ITBS Longitudinal Study 100 91. 3 90 92. 9 89. 1 84. 8 88. 1 93. 4 90. 5 87 80. 5 80. 4 80 70 84. 5 65. 3 60 Percent Proficient 50 40 30 20 10 0 Reading Math Science 2006/2007/2008/2009/2010 89. 1 92. 9 93. 4 80. 5 91. 3 88. 1 84. 8 80. 4 90. 5 Reading Math 87 Science 65. 3 84. 5
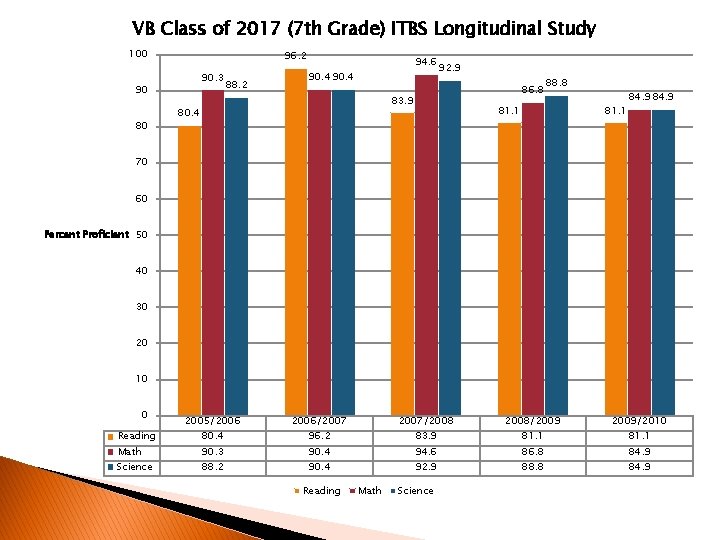
VB Class of 2017 (7 th Grade) ITBS Longitudinal Study 100 96. 2 90. 3 90 80 88. 2 94. 6 90. 4 92. 9 86. 8 83. 9 80. 4 88. 8 81. 1 84. 9 70 60 Percent Proficient 50 40 30 20 10 0 Reading Math Science 2005/2006/2007/2008/2009/2010 90. 3 90. 4 94. 6 86. 8 84. 9 80. 4 88. 2 96. 2 83. 9 90. 4 Reading 92. 9 Math Science 81. 1 88. 8 81. 1 84. 9
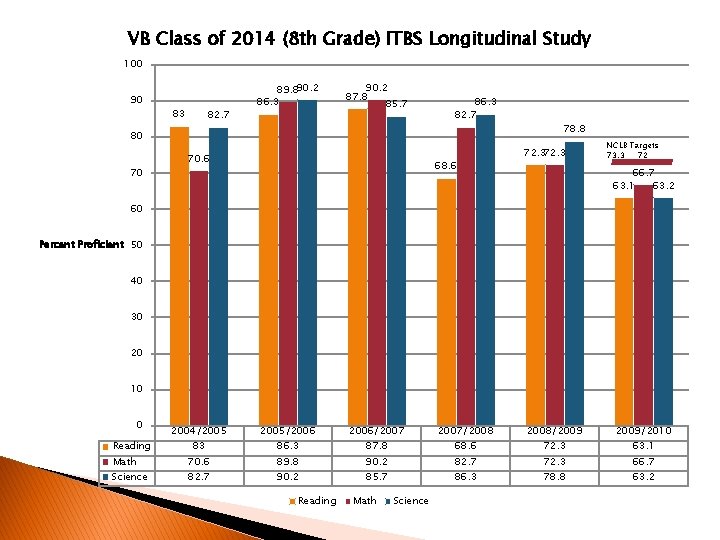
VB Class of 2014 (8 th Grade) ITBS Longitudinal Study 100 90 83 82. 7 89. 890. 2 86. 3 90. 2 87. 8 85. 7 86. 3 82. 7 80 70 70. 6 68. 6 78. 8 72. 3 NCLB Targets 73. 3 72 66. 7 63. 2 63. 1 60 Percent Proficient 50 40 30 20 10 0 Reading Math Science 2004/2005/2006/2007/2008/2009/2010 70. 6 89. 8 90. 2 82. 7 72. 3 66. 7 83 82. 7 86. 3 90. 2 Reading 87. 8 85. 7 Math 68. 6 86. 3 Science 72. 3 78. 8 63. 1 63. 2
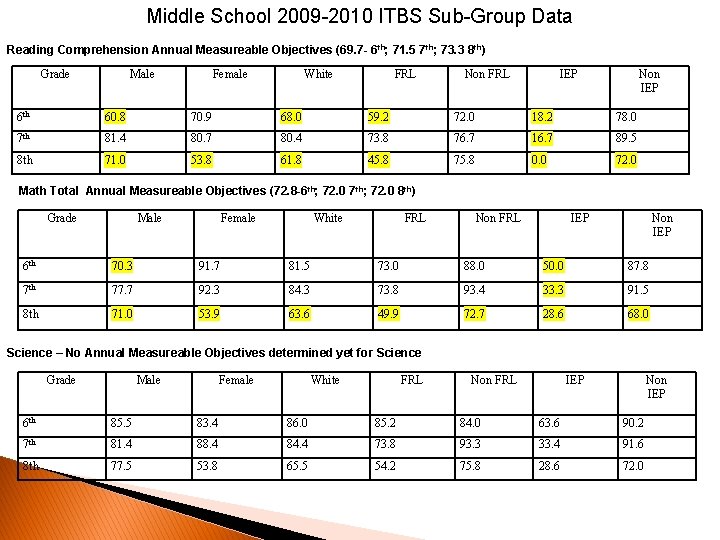
Middle School 2009 -2010 ITBS Sub-Group Data Reading Comprehension Annual Measureable Objectives (69. 7 - 6 th; 71. 5 7 th; 73. 3 8 th) Grade Male Female White FRL Non FRL IEP Non IEP 6 th 60. 8 70. 9 68. 0 59. 2 72. 0 18. 2 78. 0 7 th 81. 4 80. 7 80. 4 73. 8 76. 7 16. 7 89. 5 8 th 71. 0 53. 8 61. 8 45. 8 75. 8 0. 0 72. 0 Math Total Annual Measureable Objectives (72. 8 -6 th; 72. 0 7 th; 72. 0 8 th) Grade Male Female White FRL Non FRL IEP Non IEP 6 th 70. 3 91. 7 81. 5 73. 0 88. 0 50. 0 87. 8 7 th 77. 7 92. 3 84. 3 73. 8 93. 4 33. 3 91. 5 8 th 71. 0 53. 9 63. 6 49. 9 72. 7 28. 6 68. 0 Science – No Annual Measureable Objectives determined yet for Science Grade Male Female White FRL Non FRL IEP Non IEP 6 th 85. 5 83. 4 86. 0 85. 2 84. 0 63. 6 90. 2 7 th 81. 4 88. 4 84. 4 73. 8 93. 3 33. 4 91. 6 8 th 77. 5 53. 8 65. 5 54. 2 75. 8 28. 6 72. 0
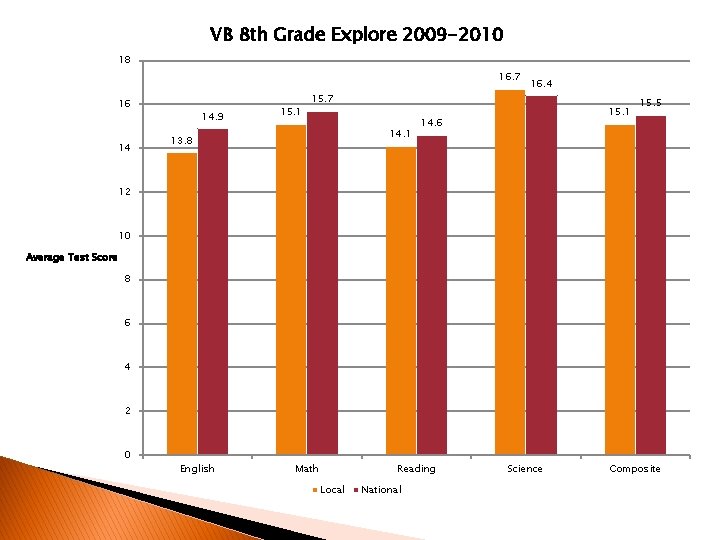
VB 8 th Grade Explore 2009 -2010 18 16. 7 16 14 14. 9 15. 1 15. 7 14. 1 13. 8 16. 4 15. 1 14. 6 15. 5 12 10 Average Test Score 8 6 4 2 0 English Math Reading Local National Science Composite
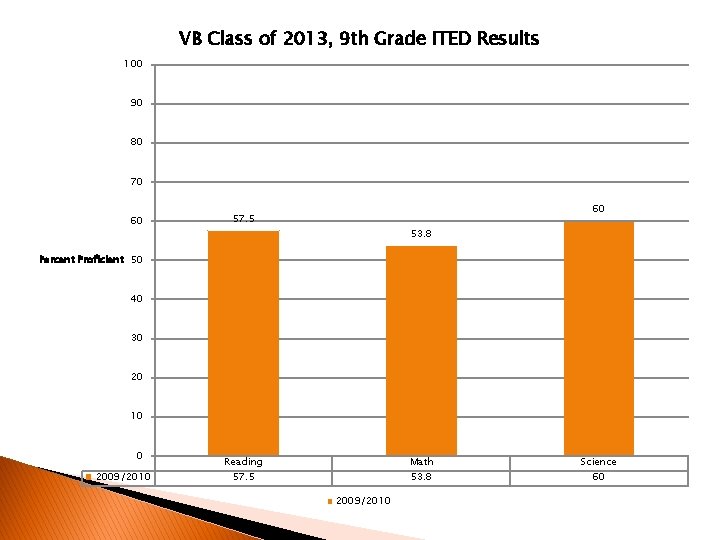
VB Class of 2013, 9 th Grade ITED Results 100 90 80 70 60 60 57. 5 53. 8 Percent Proficient 50 40 30 20 10 0 2009/2010 Reading Math 57. 5 53. 8 2009/2010 Science 60
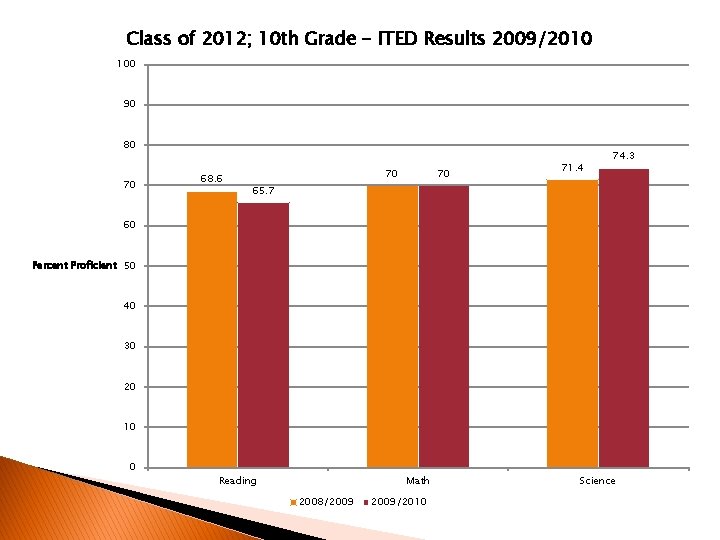
Class of 2012; 10 th Grade - ITED Results 2009/2010 100 90 80 70 68. 6 70 70 71. 4 74. 3 65. 7 60 Percent Proficient 50 40 30 20 10 0 Reading Math 2008/2009/2010 Science
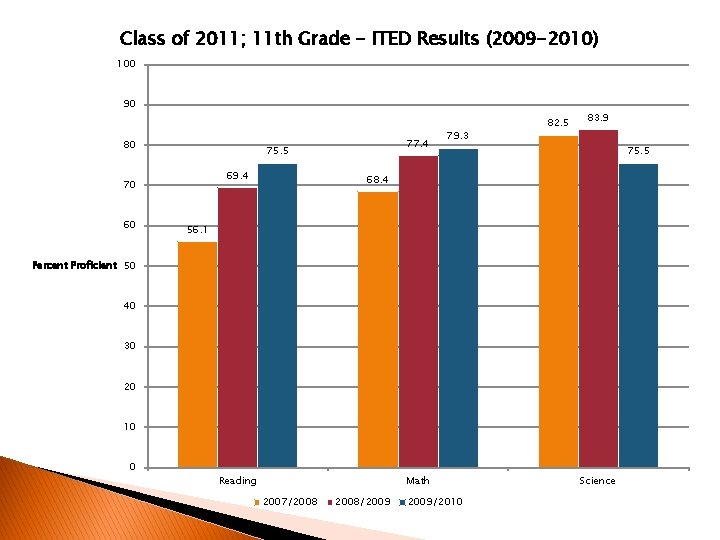
Class of 2011; 11 th Grade - ITED Results (2009 -2010) 100 90 80 75. 5 69. 4 70 60 77. 4 79. 3 82. 5 83. 9 75. 5 68. 4 56. 1 Percent Proficient 50 40 30 20 10 0 Reading Math 2007/2008/2009/2010 Science
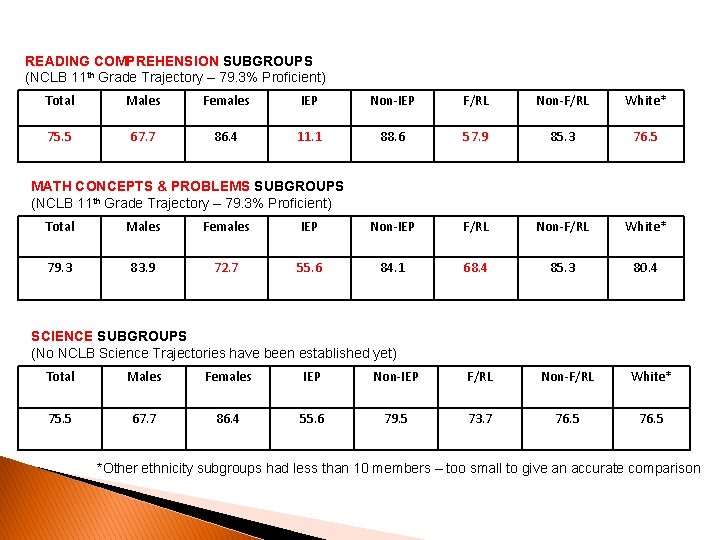
READING COMPREHENSION SUBGROUPS (NCLB 11 th Grade Trajectory – 79. 3% Proficient) Total Males Females IEP Non-IEP F/RL Non-F/RL White* 75. 5 67. 7 86. 4 11. 1 88. 6 57. 9 85. 3 76. 5 MATH CONCEPTS & PROBLEMS SUBGROUPS (NCLB 11 th Grade Trajectory – 79. 3% Proficient) Total Males Females IEP Non-IEP F/RL Non-F/RL White* 79. 3 83. 9 72. 7 55. 6 84. 1 68. 4 85. 3 80. 4 SCIENCE SUBGROUPS (No NCLB Science Trajectories have been established yet) Total Males Females IEP Non-IEP F/RL Non-F/RL White* 75. 5 67. 7 86. 4 55. 6 79. 5 73. 7 76. 5 *Other ethnicity subgroups had less than 10 members – too small to give an accurate comparison
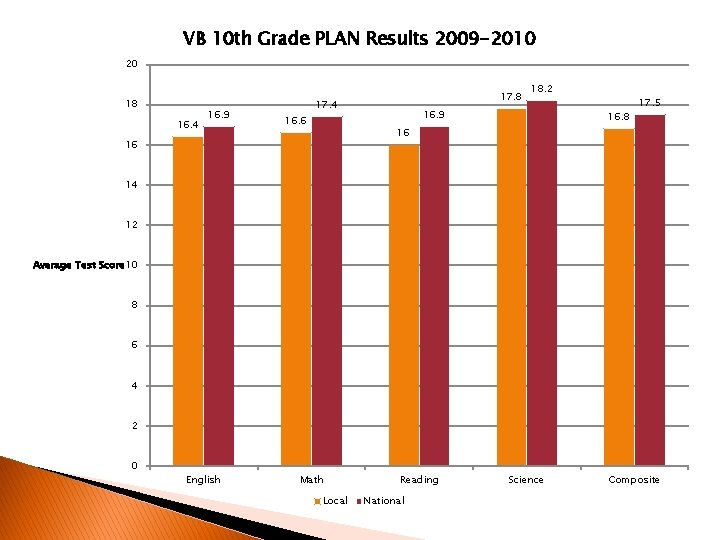
VB 10 th Grade PLAN Results 2009 -2010 20 18 16. 4 16. 9 17. 8 17. 4 16. 6 18. 2 16. 9 16. 8 17. 5 16 16 14 12 Average Test Score 10 8 6 4 2 0 English Math Local Reading National Science Composite
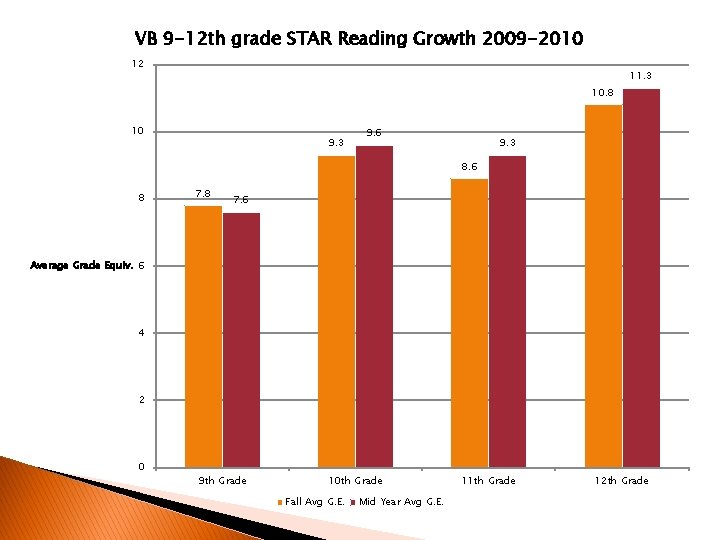
VB 9 -12 th grade STAR Reading Growth 2009 -2010 12 11. 3 10. 8 10 9. 3 9. 6 9. 3 8. 6 8 7. 6 Average Grade Equiv. 6 4 2 0 9 th Grade 10 th Grade Fall Avg G. E. Mid Year Avg G. E. 11 th Grade 12 th Grade
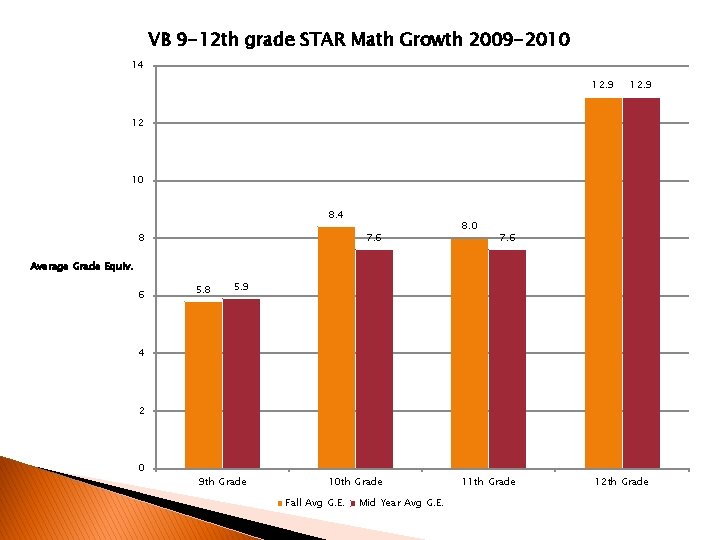
VB 9 -12 th grade STAR Math Growth 2009 -2010 14 12. 9 12 10 8. 4 8 7. 6 8. 0 7. 6 Average Grade Equiv. 6 5. 8 5. 9 4 2 0 9 th Grade 10 th Grade Fall Avg G. E. Mid Year Avg G. E. 11 th Grade 12 th Grade
Data Driven Decision Making � Data guides the decisions we make at Van Buren Community Schools: ◦ ◦ ◦ Student and staff goals Instructional practice & strategies Differentiation for staff and students District Professional Development Grant opportunities
- Slides: 29