Practical SQL Server Performance Monitoring Optimization Anil Desai

- Slides: 49

Practical SQL Server Performance Monitoring & Optimization Anil Desai http: //Anil. Desai. net Austin Code. Camp 2010

Speaker Information � Anil Desai ◦ Independent consultant (Austin, TX) ◦ Author of numerous IT books ◦ Instructor, “Implementing and Managing SQL Server 2005” (Keystone Learning) ◦ Info: http: //Anil. Desai. net or Anil@Anil. Desai. net

Agenda and Overview I. Performance Monitoring Overview II. Monitoring Database Servers III. Using SQL Profiler IV. Using the Database Engine Tuning Advisor V. Application Design Tips VI. Managing Processes, Locking, and Deadlocks

Performance Monitoring Overview Developing processes and approaches for performance optimization

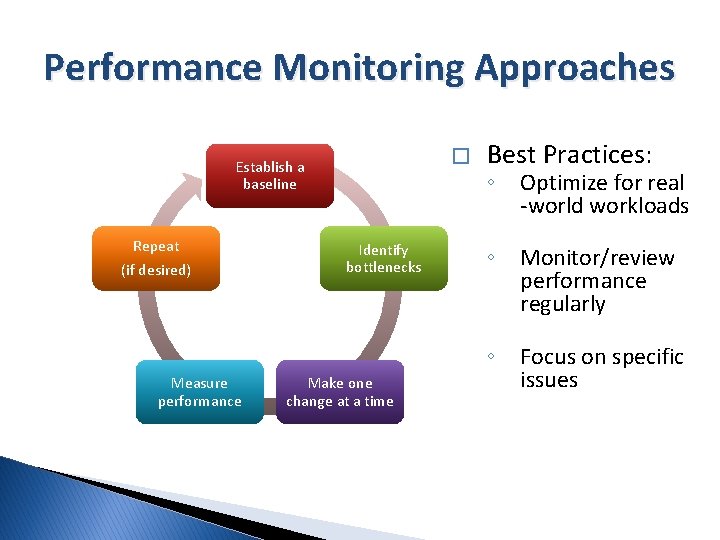
Performance Monitoring Approaches � Establish a baseline Repeat (if desired) Measure performance Identify bottlenecks Make one change at a time Best Practices: ◦ Optimize for real -world workloads ◦ Monitor/review performance regularly ◦ Focus on specific issues

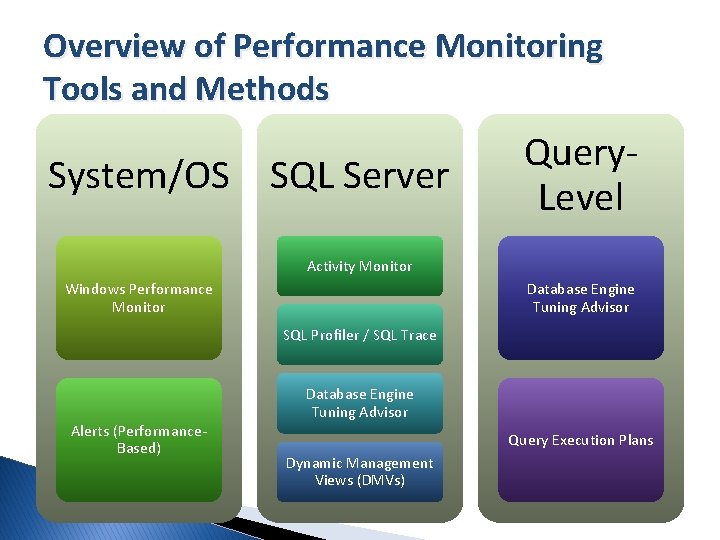
Overview of Performance Monitoring Tools and Methods System/OS SQL Server Query. Level Activity Monitor Windows Performance Monitor Database Engine Tuning Advisor SQL Profiler / SQL Trace Alerts (Performance. Based) Database Engine Tuning Advisor Query Execution Plans Dynamic Management Views (DMVs)

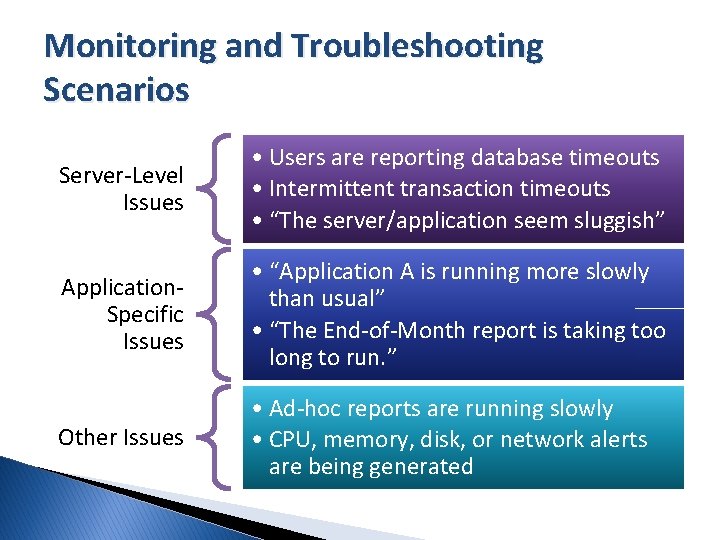
Monitoring and Troubleshooting Scenarios Server-Level Issues • Users are reporting database timeouts • Intermittent transaction timeouts • “The server/application seem sluggish” Application. Specific Issues • “Application A is running more slowly than usual” • “The End-of-Month report is taking too long to run. ” Other Issues • Ad-hoc reports are running slowly • CPU, memory, disk, or network alerts are being generated

Monitoring SQL Server Using SQL Server tools and features to monitor database activity

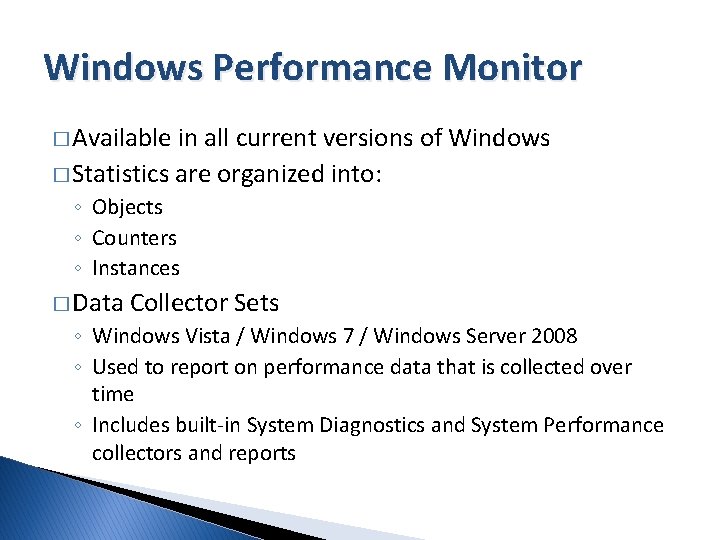
Windows Performance Monitor � Available in all current versions of Windows � Statistics are organized into: ◦ Objects ◦ Counters ◦ Instances � Data Collector Sets ◦ Windows Vista / Windows 7 / Windows Server 2008 ◦ Used to report on performance data that is collected over time ◦ Includes built-in System Diagnostics and System Performance collectors and reports

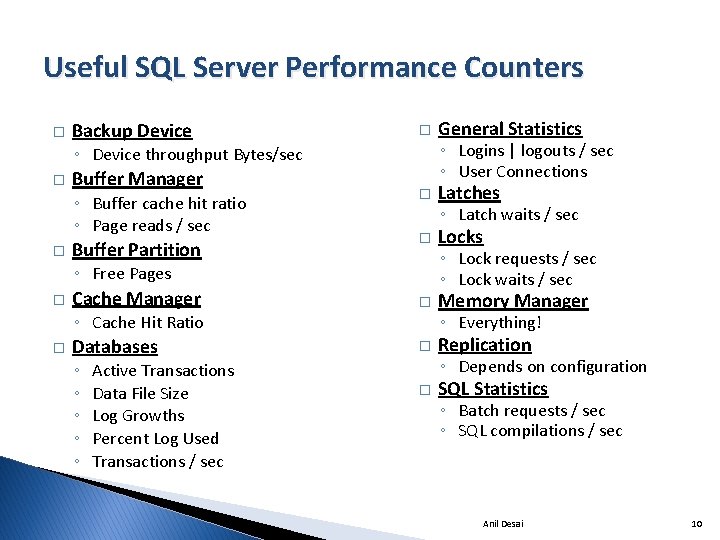
Useful SQL Server Performance Counters � Backup Device � ◦ Logins | logouts / sec ◦ User Connections ◦ Device throughput Bytes/sec � Buffer Manager ◦ Buffer cache hit ratio ◦ Page reads / sec � Buffer Partition � � Databases � ◦ ◦ ◦ Active Transactions Data File Size Log Growths Percent Log Used Transactions / sec Locks ◦ Lock requests / sec ◦ Lock waits / sec Cache Manager ◦ Cache Hit Ratio Latches ◦ Latch waits / sec ◦ Free Pages � General Statistics Memory Manager ◦ Everything! Replication ◦ Depends on configuration � SQL Statistics ◦ Batch requests / sec ◦ SQL compilations / sec Anil Desai 10

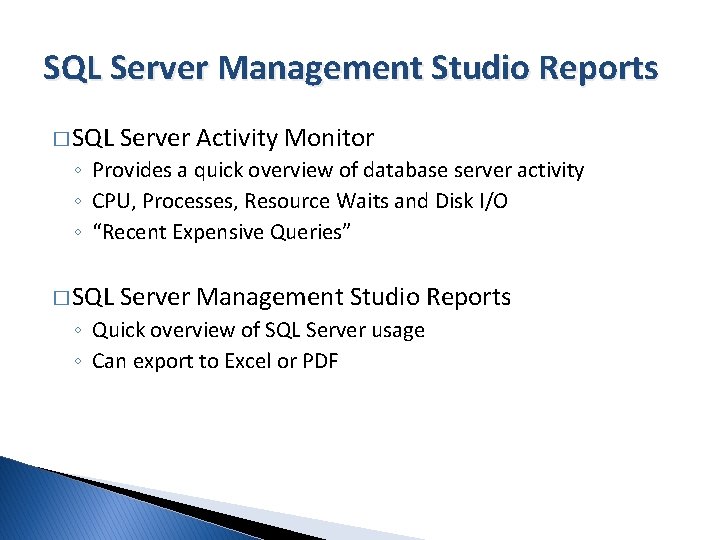
SQL Server Management Studio Reports � SQL Server Activity Monitor ◦ Provides a quick overview of database server activity ◦ CPU, Processes, Resource Waits and Disk I/O ◦ “Recent Expensive Queries” � SQL Server Management Studio Reports ◦ Quick overview of SQL Server usage ◦ Can export to Excel or PDF

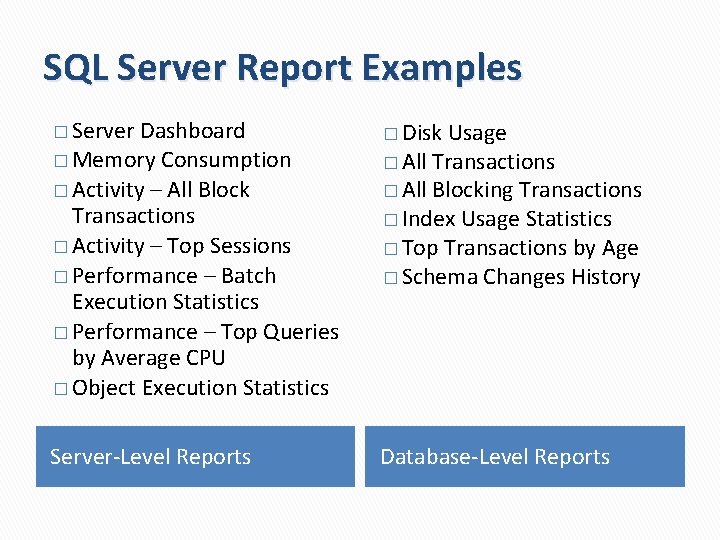
SQL Server Report Examples � Server Dashboard � Memory Consumption � Activity – All Block Transactions � Activity – Top Sessions � Performance – Batch Execution Statistics � Performance – Top Queries by Average CPU � Object Execution Statistics � Disk Server-Level Reports Database-Level Reports Usage � All Transactions � All Blocking Transactions � Index Usage Statistics � Top Transactions by Age � Schema Changes History

Monitoring SQL Server Logs � Windows Event Logs / Event Viewer ◦ Application and System Event Logs � SQL Server Management Studio ◦ SQL Server Logs �Can configure max. # of log files ◦ SQL Server Agent Error logs �Can configure logging levels (Errors, Warnings, Information) � Using the Log File Viewer ◦ Can Export / Load log information ◦ Can search for specific errors/messages

Using Dynamic Management Views (DMVs) � Purpose: ◦ Monitoring and troubleshooting ◦ View server state and performance details ◦ Returns relational result sets (use standard SELECT statements) � Full list can be viewed in “Views System Views” section of the properties of the database � Scopes: ◦ Server level ◦ Database level

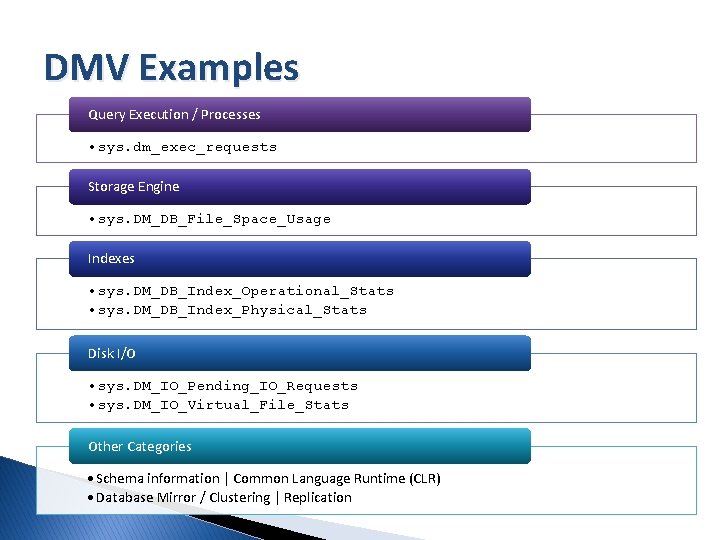
DMV Examples Query Execution / Processes • sys. dm_exec_requests Storage Engine • sys. DM_DB_File_Space_Usage Indexes • sys. DM_DB_Index_Operational_Stats • sys. DM_DB_Index_Physical_Stats Disk I/O • sys. DM_IO_Pending_IO_Requests • sys. DM_IO_Virtual_File_Stats Other Categories • Schema information | Common Language Runtime (CLR) • Database Mirror / Clustering | Replication

Using SQLDiag � Data Collected: ◦ System Information (MSINFO) ◦ Windows Event Logs ◦ SQL Server configuration � Command-Line ◦ ◦ Utility (SQLDiag. exe) Stores output to files Configuration file: SQLDiag. xml Can run as a service (/R) Can run in continuous mode

Using SQL Profiler Monitoring SQL Server Activity

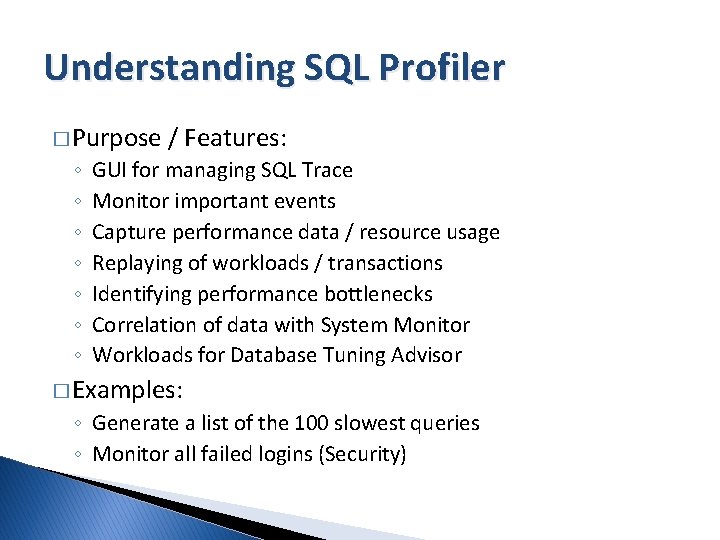
Understanding SQL Profiler � Purpose ◦ ◦ ◦ ◦ / Features: GUI for managing SQL Trace Monitor important events Capture performance data / resource usage Replaying of workloads / transactions Identifying performance bottlenecks Correlation of data with System Monitor Workloads for Database Tuning Advisor � Examples: ◦ Generate a list of the 100 slowest queries ◦ Monitor all failed logins (Security)

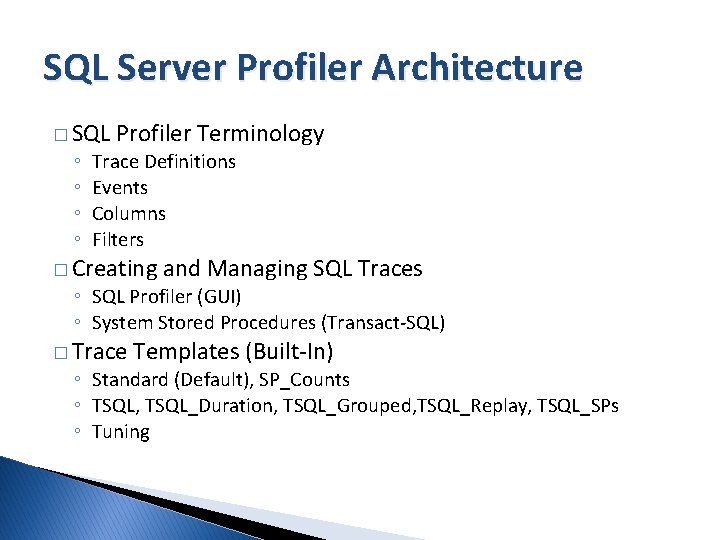
SQL Server Profiler Architecture � SQL ◦ ◦ Profiler Terminology Trace Definitions Events Columns Filters � Creating and Managing SQL Traces ◦ SQL Profiler (GUI) ◦ System Stored Procedures (Transact-SQL) � Trace Templates (Built-In) ◦ Standard (Default), SP_Counts ◦ TSQL, TSQL_Duration, TSQL_Grouped, TSQL_Replay, TSQL_SPs ◦ Tuning

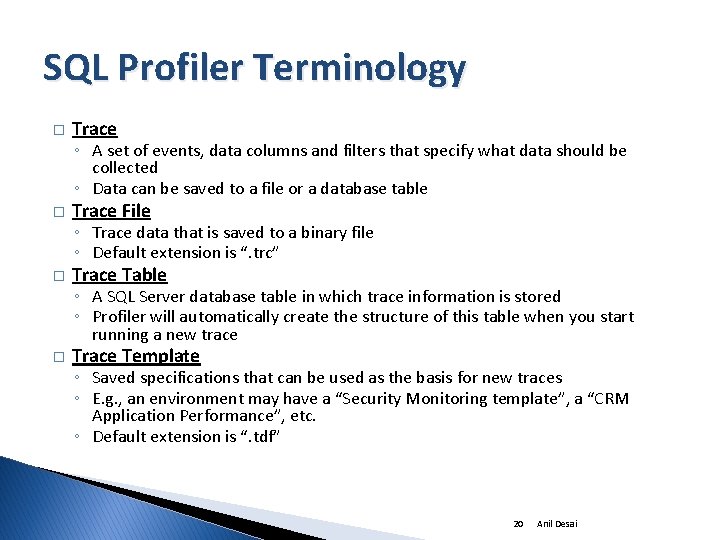
SQL Profiler Terminology � Trace ◦ A set of events, data columns and filters that specify what data should be collected ◦ Data can be saved to a file or a database table � Trace File ◦ Trace data that is saved to a binary file ◦ Default extension is “. trc” � Trace Table ◦ A SQL Server database table in which trace information is stored ◦ Profiler will automatically create the structure of this table when you start running a new trace � Trace Template ◦ Saved specifications that can be used as the basis for new traces ◦ E. g. , an environment may have a “Security Monitoring template”, a “CRM Application Performance”, etc. ◦ Default extension is “. tdf” 20 Anil Desai

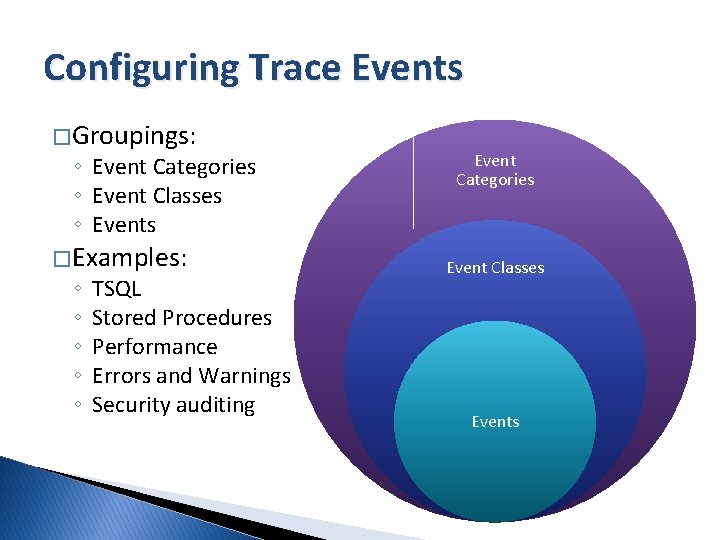
Configuring Trace Events � Groupings: ◦ Event Categories ◦ Event Classes ◦ Events � Examples: ◦ ◦ ◦ TSQL Stored Procedures Performance Errors and Warnings Security auditing Event Categories Event Classes Events

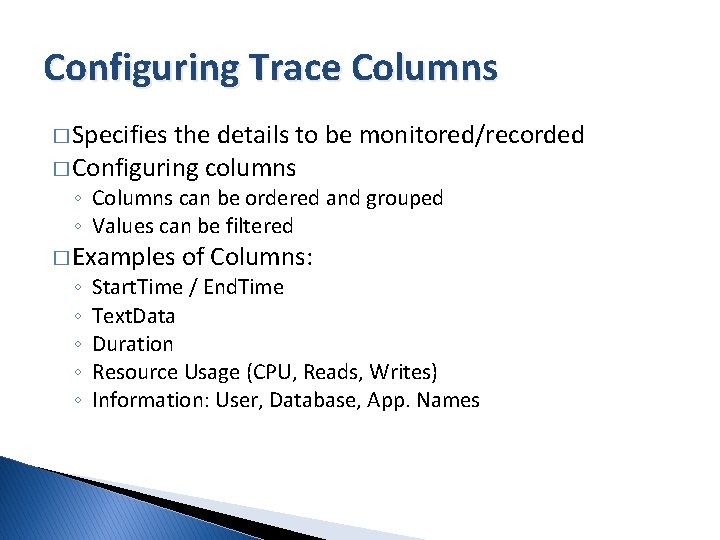
Configuring Trace Columns � Specifies the details to be monitored/recorded � Configuring columns ◦ Columns can be ordered and grouped ◦ Values can be filtered � Examples ◦ ◦ ◦ of Columns: Start. Time / End. Time Text. Data Duration Resource Usage (CPU, Reads, Writes) Information: User, Database, App. Names

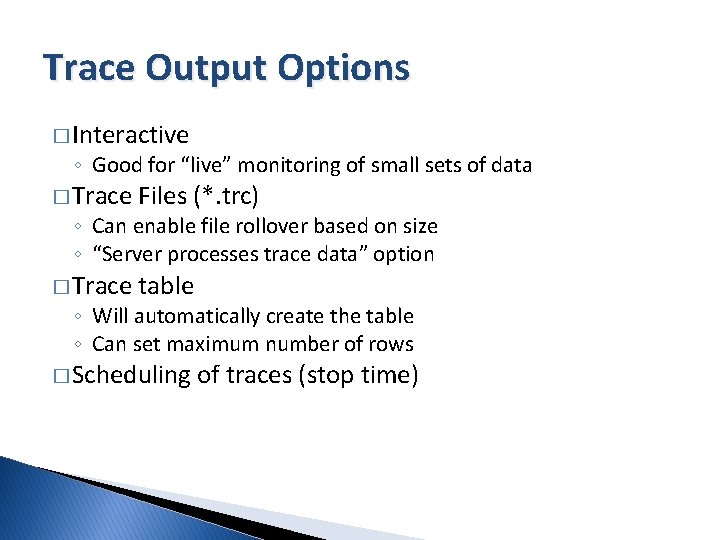
Trace Output Options � Interactive ◦ Good for “live” monitoring of small sets of data � Trace Files (*. trc) � Trace table ◦ Can enable file rollover based on size ◦ “Server processes trace data” option ◦ Will automatically create the table ◦ Can set maximum number of rows � Scheduling of traces (stop time)

Demo: Creating Profiler Traces � Launching SQL Profiler � Connecting to a database instance � Configuring output options � Create a trace definition � Specifying events, columns, and filters � Running and viewing a trace

Other SQL Profiler Options � Creating new templates using SQL Profiler � Scripting trace definitions ◦ ◦ ◦ sp_trace_create sp_trace_setfilter sp_trace_Generate. Event sp_trace_Set. Status � Extracting SQL Server Events ◦ Transact-SQL Events ◦ Show. Plan Events ◦ Deadlock Events

Using System Monitor with SQL Profiler � Purpose / Goal: ◦ Correlate server performance with database performance � Process: ◦ Define and start a counter log ◦ Define and start a SQL Profiler trace ◦ Import Performance Data in SQL Profiler � Required Trace properties ◦ Start. Time ◦ End. Time

Using the Database Engine Tuning Advisor Analyzing workloads to optimize physical database structures

Database Engine Tuning Advisor � Reviews sample workloads and makes performance recommendations � Evaluates Physical Design Structures (PDS) ◦ Indexes (clustered, non-clustered) ◦ Indexed Views ◦ Partitions � Numerous analysis options � Output ◦ Generates modification scripts ◦ Generates Reports for later analysis

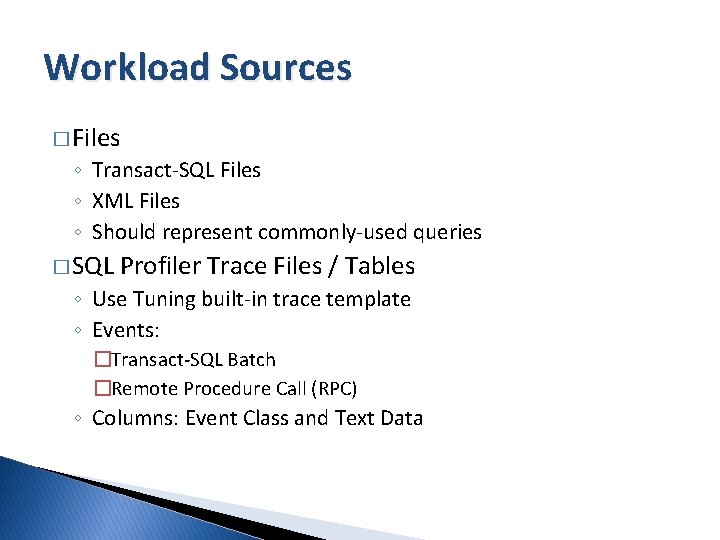
Workload Sources � Files ◦ Transact-SQL Files ◦ XML Files ◦ Should represent commonly-used queries � SQL Profiler Trace Files / Tables ◦ Use Tuning built-in trace template ◦ Events: �Transact-SQL Batch �Remote Procedure Call (RPC) ◦ Columns: Event Class and Text Data

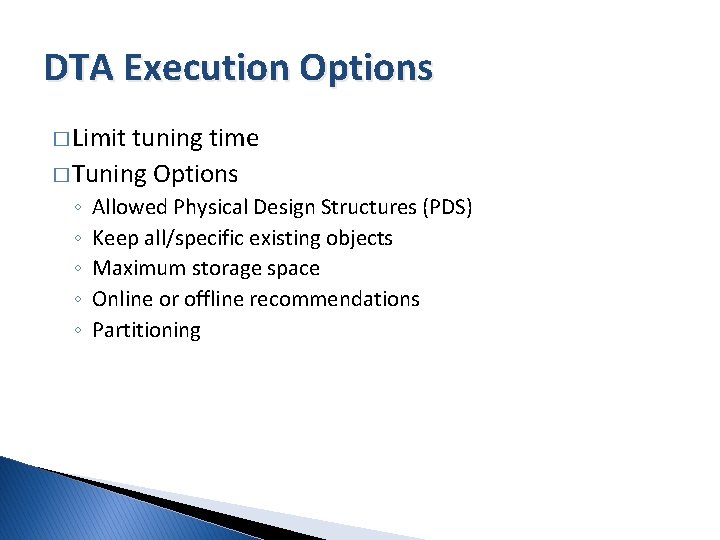
DTA Execution Options � Limit tuning time � Tuning Options ◦ ◦ ◦ Allowed Physical Design Structures (PDS) Keep all/specific existing objects Maximum storage space Online or offline recommendations Partitioning

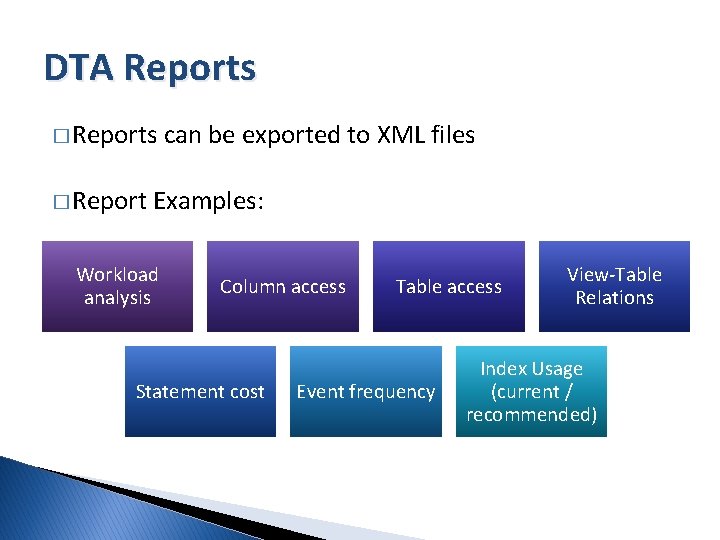
DTA Reports � Report can be exported to XML files Examples: Workload analysis Column access Statement cost Table access Event frequency View-Table Relations Index Usage (current / recommended)

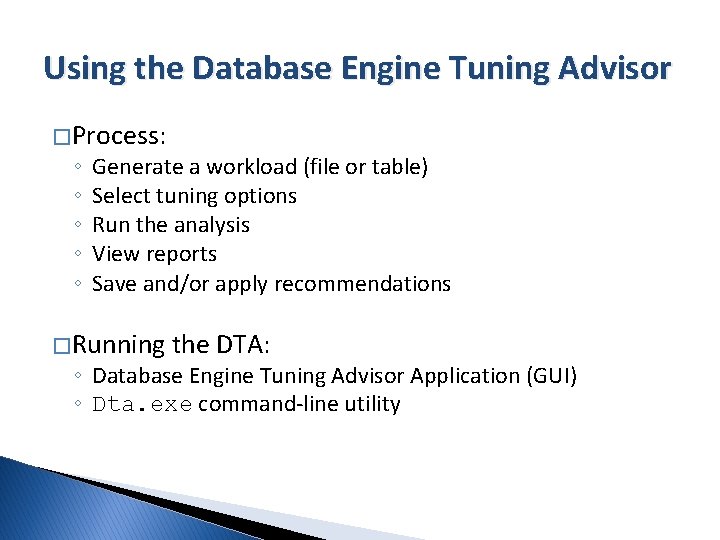
Using the Database Engine Tuning Advisor � Process: ◦ ◦ ◦ Generate a workload (file or table) Select tuning options Run the analysis View reports Save and/or apply recommendations � Running the DTA: ◦ Database Engine Tuning Advisor Application (GUI) ◦ Dta. exe command-line utility

Application Design Tips Practical ways to improve database application performance

Application Design Tips � Create an abstraction layer between the database and the presentation code ◦ Separates presentation and logic (esp. in Web Apps) ◦ Example: ADO. NET Datasets � Database design: ◦ Understand typical use-cases before designing the database ◦ Create and enforce naming conventions ◦ Balance write (OLTP) and read (reporting) performance requirements ◦ Use strategic denormalization 34 Anil Desai

Application Design Tips (cont’d. ) � Never include actions that require user input within a transaction � Use connection pooling, whenever possible ◦ Open connections late and close them early ◦ Avoid unnecessary server round-trips � Use client-side caching whenever possible ◦ Optimistic concurrency ◦ Pessimistic concurrency � Distribute processing ◦ Some operations are more efficient on the DB server (e. g. , aggregations, sorting, etc. )

Managing Processes, Locking, and Deadlocks Troubleshooting common SQL Server performance problems

Understanding Processes � Processes ◦ Interactive users �SQL Server Management Studio ◦ Applications (Connection Pooling) �SQL Profiler �Database Engine Tuning Advisor �Replication �Service Broker � Process IDs < 50 are system-related

Monitoring Processes � SQL ◦ ◦ Server Activity Monitor Processes (connected users) Locks (by Process / by Object) Filtering options Auto-refresh option � System ◦ ◦ Stored Procedures / Views Sys. DM_Exec_Sessions Sys. DM_Exec_Requests Sys. Processes sp_who / sp_who 2

Managing Processes � Process Information ◦ Current Process ID: @@SPID ◦ Session Options: DBCC USEROPTIONS � Killing Processes ◦ KILL Process. ID [WITH STATUSONLY] � Viewing Last Activity ◦ DBCC INPUTBUFFER(Process. ID) ◦ DBCC OUTPUTBUFFER(Process. ID)

Understanding Locking � Coordinates multiple accesses to the same data � Ensures ACID Properties for transactions (Atomic, Consistent, Independent, Durable) � Contention can reduce performance � Locking granularity: ◦ Row-Level, Page-Level, Table-Level, etc. � Lock Modes: ◦ Shared, Exclusive, etc. � Lock escalation

Understanding Blocking � Blocking ◦ When transaction(s) must wait for a lock on a resource ◦ LOCK_TIMEOUT setting (default = wait forever) � Locking Models: ◦ Pessimistic ◦ Optimistic

Transaction Isolation Levels � Balance of concurrency (performance) vs. consistency ◦ Affects SELECT queries ◦ SET TRANSACTION ISOLATION LEVEL � Transaction ◦ ◦ ◦ Isolation Levels READ UNCOMMITTED READ COMMITTED (default) REPEATABLE READ SERIALIZABLE SNAPSHOT � Row-Versioning: ◦ ALLOW_SNAPSHOT_ISOLATION ◦ READ_COMMITTED_SNAPSHOT

Monitoring Locking Activity � Activity Monitor � SQL Profiler ◦ Locks Event Category � System Monitor: � System Views � System Stored Procedures ◦ SQL Server Locks Object ◦ Sys. DM_Tran_Locks ◦ Sys. DM_Exec_Requests ◦ sp_Lock

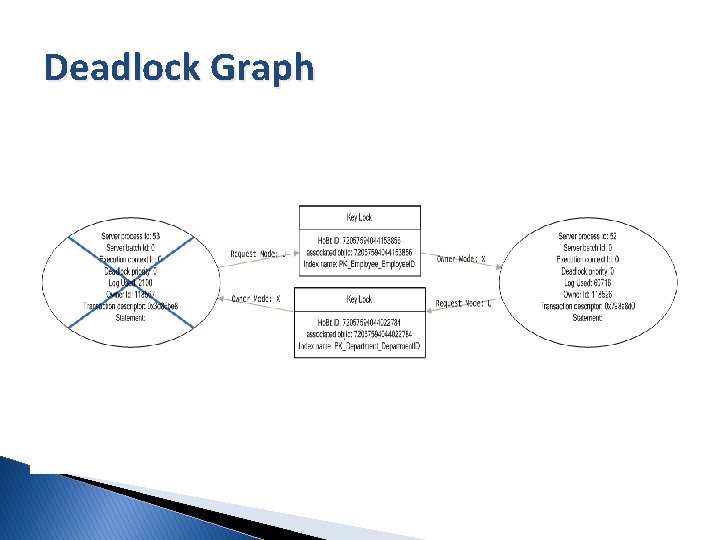
Understanding the Deadlock Process � Deadlocks: ◦ Two or more tasks permanently block each other based on resource locks ◦ Default resolution is within 5 seconds � Deadlock victim ◦ Transaction is rolled-back ◦ Process receives a 1205 error � Example: ◦ Process 1 locks the Customers table and requires access to the Orders Table ◦ Process 2 locks the Orders table and requires access to the Customers Table

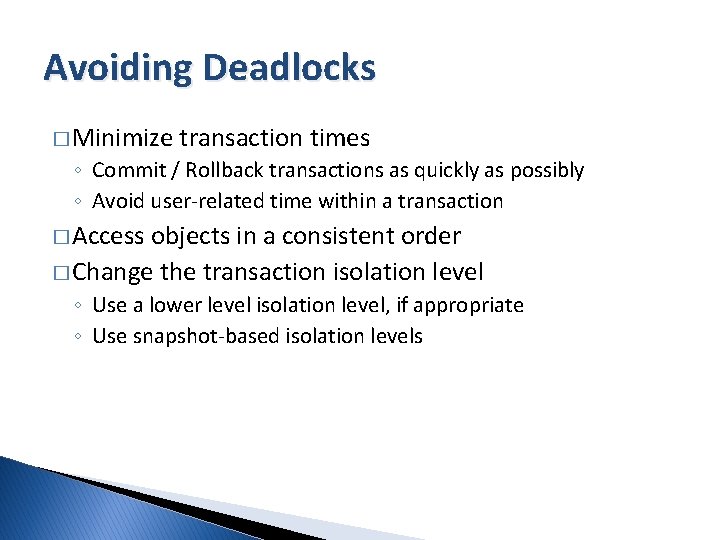
Avoiding Deadlocks � Minimize transaction times ◦ Commit / Rollback transactions as quickly as possibly ◦ Avoid user-related time within a transaction � Access objects in a consistent order � Change the transaction isolation level ◦ Use a lower level isolation level, if appropriate ◦ Use snapshot-based isolation levels

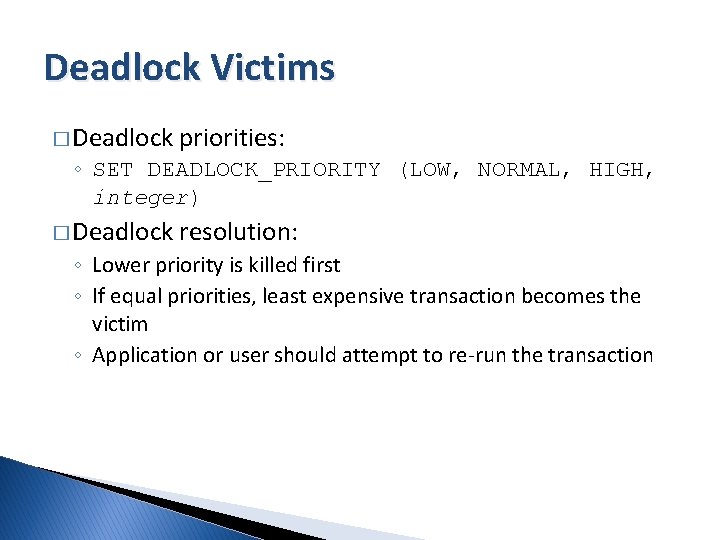
Deadlock Victims � Deadlock priorities: � Deadlock resolution: ◦ SET DEADLOCK_PRIORITY (LOW, NORMAL, HIGH, integer) ◦ Lower priority is killed first ◦ If equal priorities, least expensive transaction becomes the victim ◦ Application or user should attempt to re-run the transaction

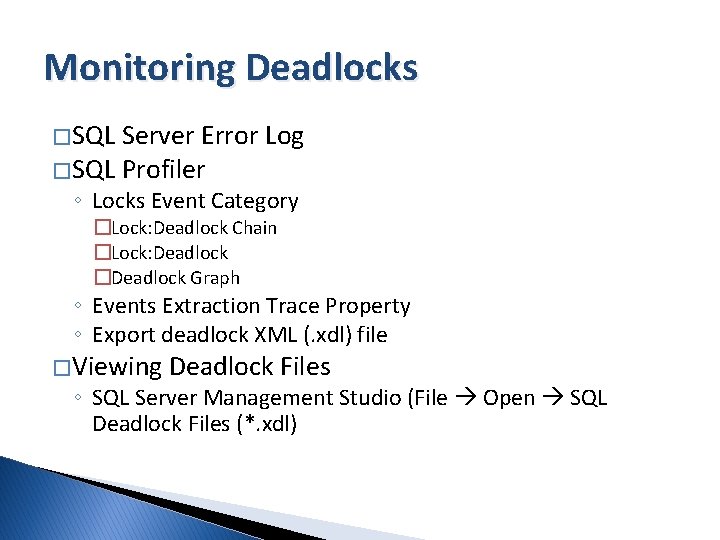
Monitoring Deadlocks � SQL Server Error Log � SQL Profiler ◦ Locks Event Category �Lock: Deadlock Chain �Lock: Deadlock �Deadlock Graph ◦ Events Extraction Trace Property ◦ Export deadlock XML (. xdl) file � Viewing Deadlock Files ◦ SQL Server Management Studio (File Open SQL Deadlock Files (*. xdl)

Deadlock Graph

Questions & Discussion For more information: http: //Anil. Desai. net Anil@Anil. Desai. net