Practical Electrocardiography Bundle Branch Block Scott Ewing D

Practical Electrocardiography – Bundle Branch Block Scott Ewing, D. O. Cardiology Fellow October 5, 2006

Syllabus u u u u u Introduction Axis Determination Atrial Arrhythmias, Bradycardias, and AV Conduction Block Junctional and Broad Complex Tachycardias Myocardial Ischemia and Acute Myocardial Infarction Conditions Affecting the Left Side of the Heart Conditions Affecting the Right Side of the Heart Conditions Not Primarily Affecting the Heart Exercise Tolerance Testing

Left Bundle Branch Block

LBBB

LBBB – Definition QRS duration ≥ 120 ms u Broad, notched R waves in lateral precordial leads (V 5 and V 6) and usually leads I and a. Vl u Small or absent initial r waves in right precordial leads (V 1 and V 2) followed by deep S waves u Absent septal q waves in left-sided leads u Prolonged intrinsicoid deflection (>60 ms) in V 5 and V 6 u

LBBB Comparison u u u Normal leads V 1 and V 6 Typical QRS-T patterns in RBBB and LBBB Note the secondary T wave inversions in leads with an r. SR' complex with RBBB and in leads with a wide R wave with LBBB
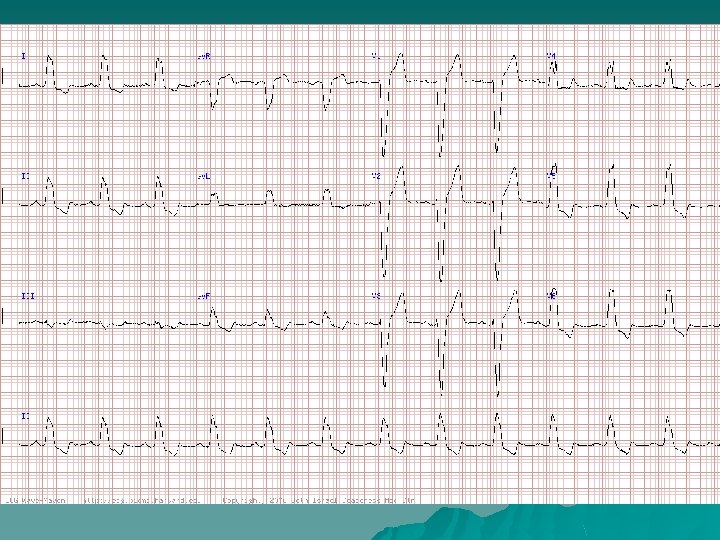

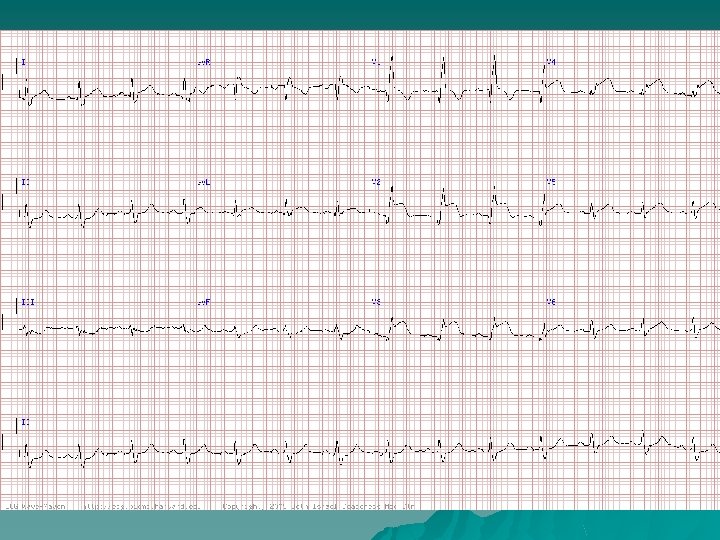
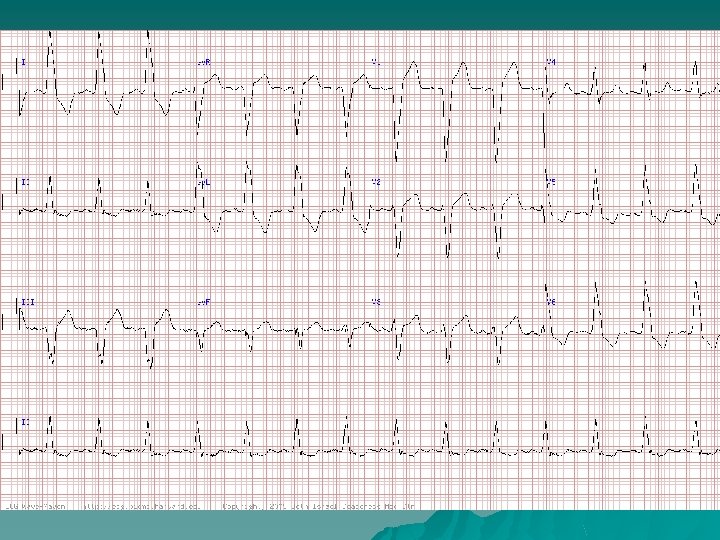
Interpretation: NSR with LBBB QRS duration 0. 16 second u Broad, notched R waves in lateral precordial leads u Small or absent initial r waves in right precordial leads followed by deep S waves u Absent septal q waves in left-sided leads u Prolonged intrinsicoid deflection (>60 ms) in V 5 and V 6 u Secondary T wave changes such that the ST-T wave vector points opposite in direction of the major vector of the QRS u

Interpretation: NSR with LBBB Complete LBBB may be associated with a normal, leftward, or rarely rightward axis u LBBB may mask or mimic the pattern of underlying myocardial infarction u LBBB is also important since it is often a marker of underlying organic heart disease (hypertensive heart disease, severe coronary disease, cardiomyopathy or valvular disease) u

LBBB Mechanisms u u u Almost completely reorganized pattern of LV activation Initial septal activation right septal surface, absence of normal septal q waves Excitation wave spreads slowly by conduction from muscle cell to muscle cell LV endocardial activation requires additional 40 – 180 ms QRS complex is prolonged and can be very wide Once LV activation begins, it proceeds in a relatively simple and direct manner around the free wall and then to the base of the heart

LBBB Mechanisms u u u Activation across the LV projects positive forces to left-sided leads and negative ones to rightsided leads Spread through working muscle fibers results in notching and slurring from discontinuous propagation RV is activated and recovers earlier than the LV, recovery vectors are directed toward the right and away from the left ST-T wave changes are generated by abnormalities in conduction, called secondary T wave abnormalities ST-T wave changes produced by direct abnormalities of the recovery process are called primary T wave abnormalities

LBBB Clinical Significance u u u Usually patients with underlying heart disease Significantly reduced long-term survival reflecting severity of underlying cardiac disease With CAD, correlates with more extensive disease, more severe LV dysfunction, and reduced survival rates Duration of the QRS complex often inversely related to LV EF Abnormal ventricular activation pattern induces hemodynamic perturbations – – abnormal systolic function with dysfunctional contraction reduced ejection fraction and lower stroke volumes reversed splitting of the second heart sound functional mitral regurgitation

LBBB Clinical Significance u u u Functional abnormalities in phasic coronary blood flow and reduced coronary flow reserve caused by delayed diastolic relaxation result in septal defects on exercise nuclear perfusion scans Obscures or simulates other ECG patterns Diagnosis of LVH is complicated by the increased QRS amplitude and axis shifts intrinsic to LBBB Very high prevalence of LVH with LBBB makes defining criteria with high specificity difficult Diagnosis of infarction may be obscured
 may be mistaken")
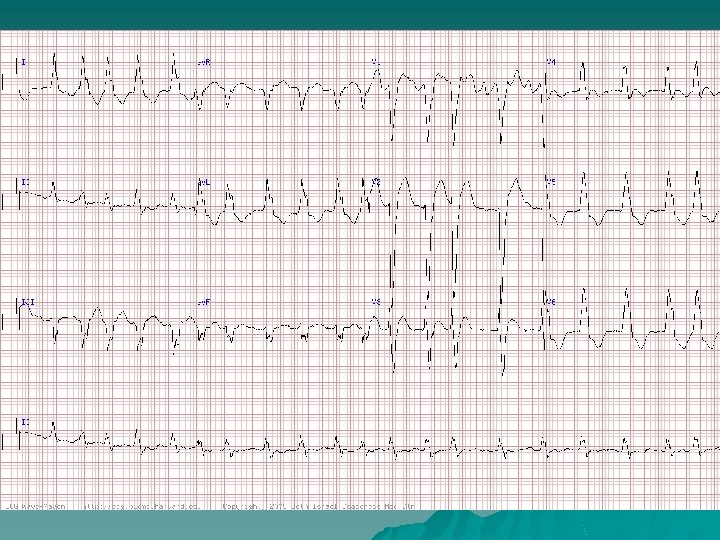
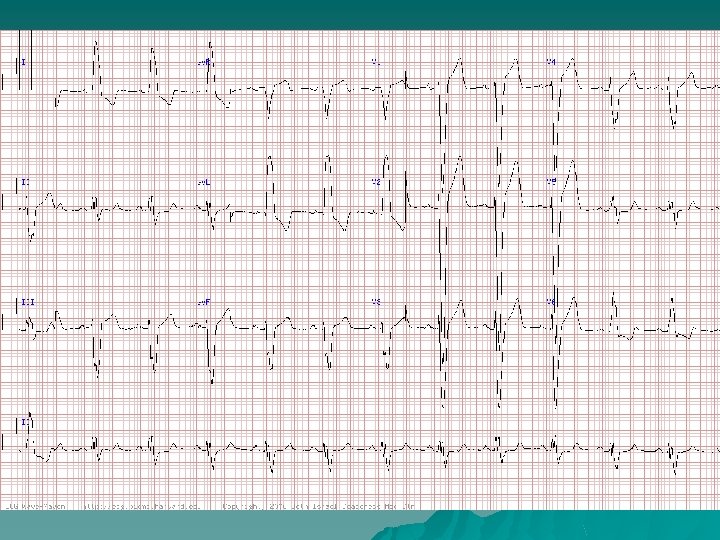
Interpretation: Afib with LBBB Coarse atrial fibrillatory waves (lead V 1) may be mistaken for atrial flutter waves u With atrial fibrillation the atrial activity varies continuously and usually the ventricular response is completely variable u QRS complex here shows a typical left bundle branch block morphology with secondary ST-T abnormalities u
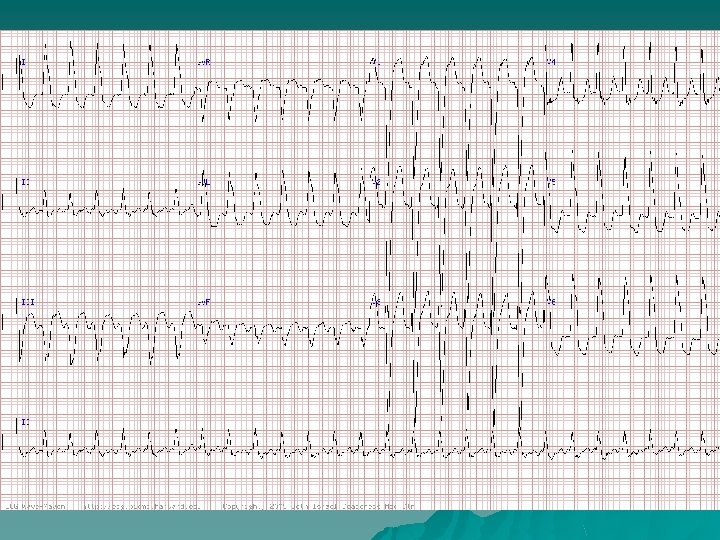

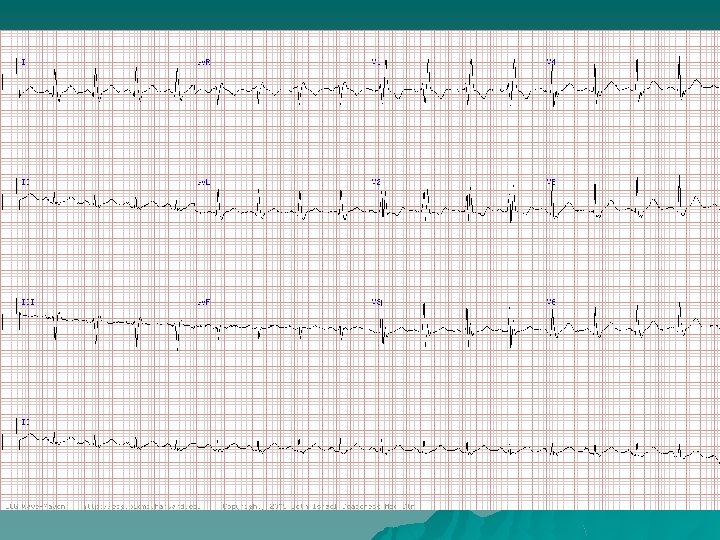
Interpretation: Atrial Flutter with 2: 1 Conduction and LBBB u Wide-complex tachycardia u Classic LBBB pattern u If you look carefully, atrial activity in the limb leads, with negative polarity in lead II, at rate of 320 bpm u Hence, atrial flutter with 2: 1 conduction and LBBB.
 also")
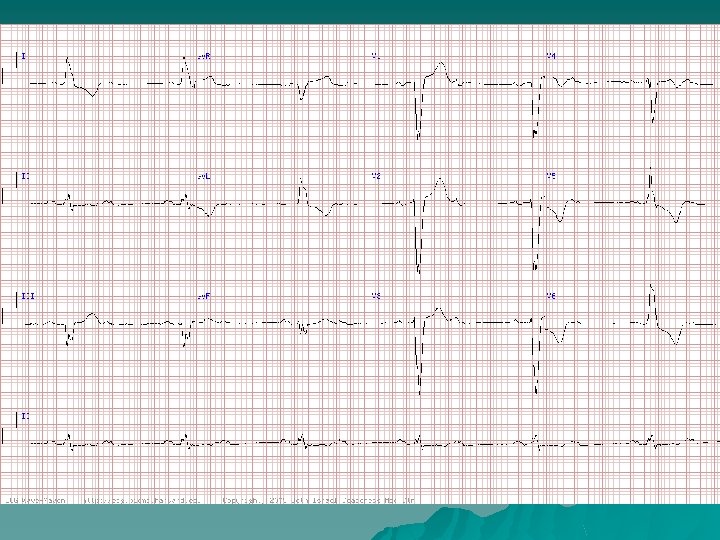
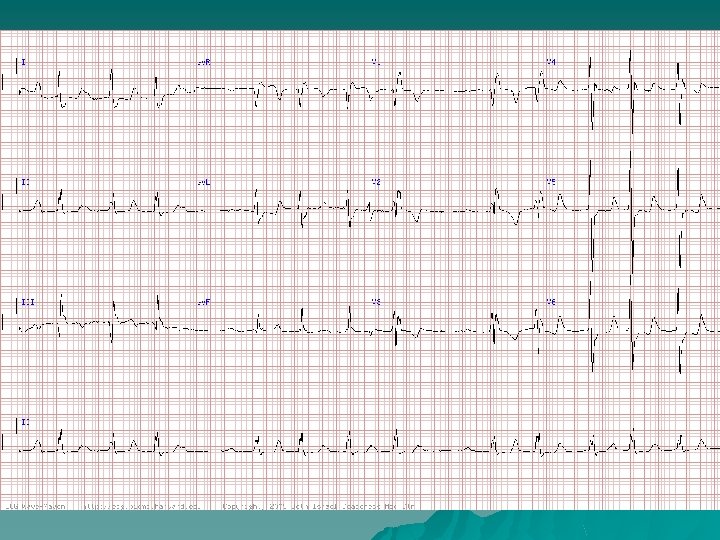
Interpretation: SR with 2: 1 AV Block and LBBB Left atrial abnormality (LAA) also noted u Patient had a history of prior silent inferior MI, hypertension, and mitral regurgitation (the latter two factors accounting for the prominent LAA) u Underwent dual chamber pacemaker implantation for his 2: 1 second-degree AV block with marked bradycardia u Location of the AV block was likely infranodal, given the presence of the LBBB and normal PR interval in the conducted beats. u

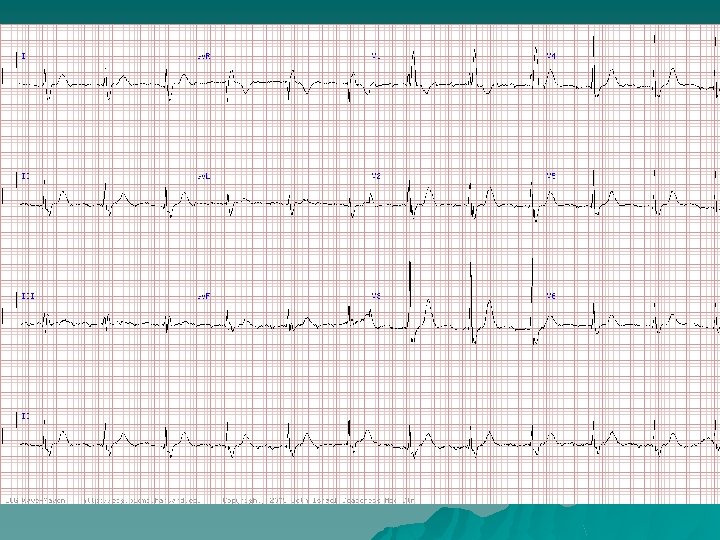
Interpretation: NSR With LBBB u u u Sinus rhythm at 72 bpm with LBBB with QRS duration 0. 16 second, normal AV conduction (PR. 0. 17 second) and a QT interval at the upper limits of normal (0. 42 second) History of hypertension and idiopathic cardiomyopathy with an LV EF 35% Ruled out for a myocardial infarction Serum potassium was normal Acute MI cannot be ruled out by ECG alone in this context, the findings of tall right precordial T waves and J point elevations of this magnitude are consistent entirely with LBBB

Right Bundle Branch Block

RBBB

RBBB – Definition u QRS duration ≥ 120 ms u Broad, notched R waves (rsr', rs. R', or r. SR' patterns) in right precordial leads (V 1 and V 2) u Wide and deep S waves in left precordial leads (V 5 and V 6)

RBBB Comparison u u u Normal leads V 1 and V 6 Typical QRS-T patterns in RBBB and LBBB Note the secondary T wave inversions in leads with an r. SR' complex with RBBB and in leads with a wide R wave with LBBB

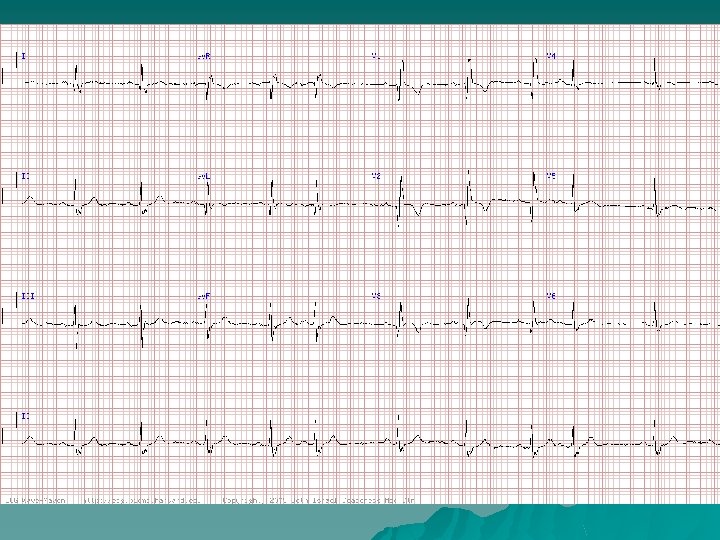
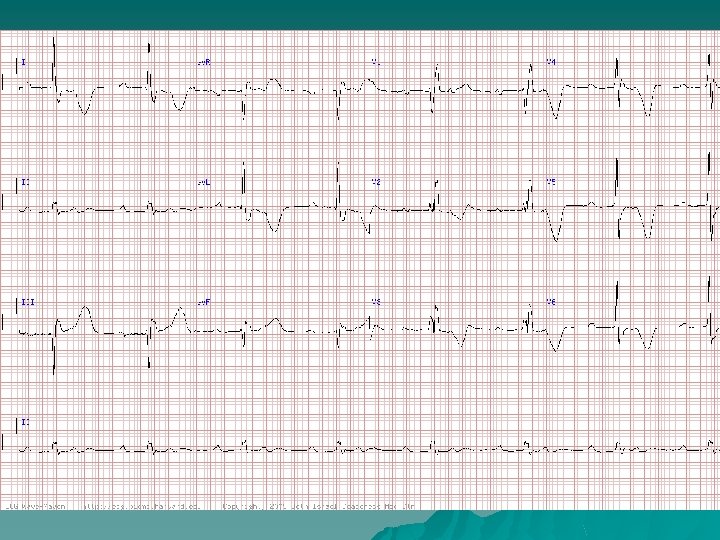
Interpretation: NSR with RBBB u u Sinus with RBBB – – QRS duration > 0. 12 second r. SR’ complex with a wide terminal R wave in V 1 q. RS complex with a wide S wave in V 6 Secondary T wave changes – – COPD Pulmonary hypertension Atrial septal defect Pulmonic stenosis Usually associated with an underlying pathology causing RVH Also, age related degenerative changes Finally, LAD occlusion in AMI since LAD typically supplies the proximal right bundle

Causes RBBB u Rheumatic heart disease u Cor pulmonale / RVH u Myocarditis or cardiomyopathy u Ischemic heart disease u Degenerative disease of the conduction system u Pulmonary embolus u Congenital heart disease such as ASD

RBBB Mechanisms u u Activation of the right side of the septum is initiated after slow transseptal spread of activation from the left septal surface RV free wall then excited slowly, with variable participation of the specialized conduction system Result is delayed and slowed activation of the RV with much or all of the RV undergoing activation after depolarization of the LV has been completed Because LV activation remains relatively intact, the early portions of the QRS complex are normal

RBBB Mechanisms u u u Delayed activation of the RV causes prolongation of the QRS duration and a reduction in the cancellation of RV activation forces by the more powerful LV activation forces The late and unopposed emergence of RV forces produces increased anterior and rightward voltage Discordant ST-T wave patterns are generated by the same mechanisms as for LBBB; with RBBB, recovery forces are directed toward the earlieractivated LV and away from the RV

RBBB Clinical Significance u u u u RBBB is common and often no evidence of structural heart disease With new onset RBBB higher rate of CAD, CHF, mortality With CAD, RBBB suggests advanced disease RBBB interferes with other ECG diagnoses (lesser extent than LBBB) RVH more difficult to make with RBBB because of the accentuated positive potentials in V 1 Usual criteria for LVH can be applied but have lower sensitivities Combination of LAA or LAD with RBBB suggests underlying LVH

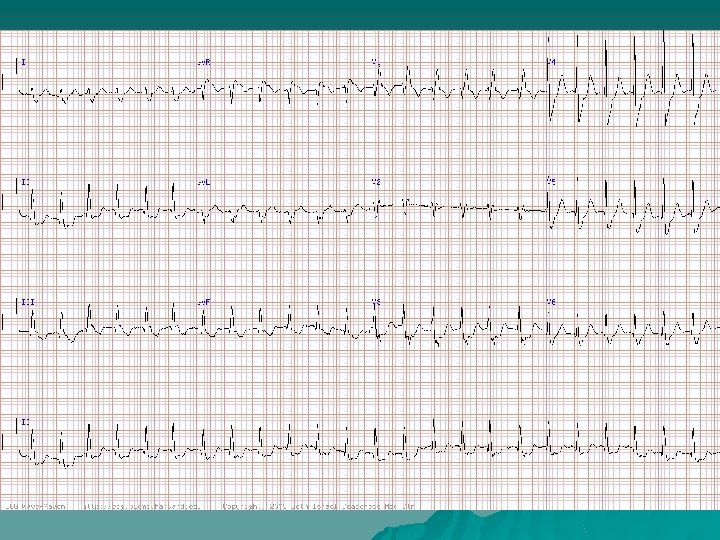
Interpretation: SR with 2° Type I AV Block and RBBB Sinus rhythm with 1° AV block and 2° Type I AV block u A 5: 4 Wenckebach sequence is present in the middle of the recording u The AV Wenckebach sequences are "atypical" in that the RR intervals do not progressively shorten u Complete RBBB u LAA also noted along with non-specific repolarization abnormalities u

Interpretation: Atrial Flutter with 4: 1 Conduction and RBBB u Flutter waves are well-seen in V 1 and lead III u Rate of about 280/min, with a ventricular response at about 70/min u Classic RBBB pattern is also present u Patient had rheumatic mitral valve disease, moderate pulmonary hypertension, and tricuspid regurgitation

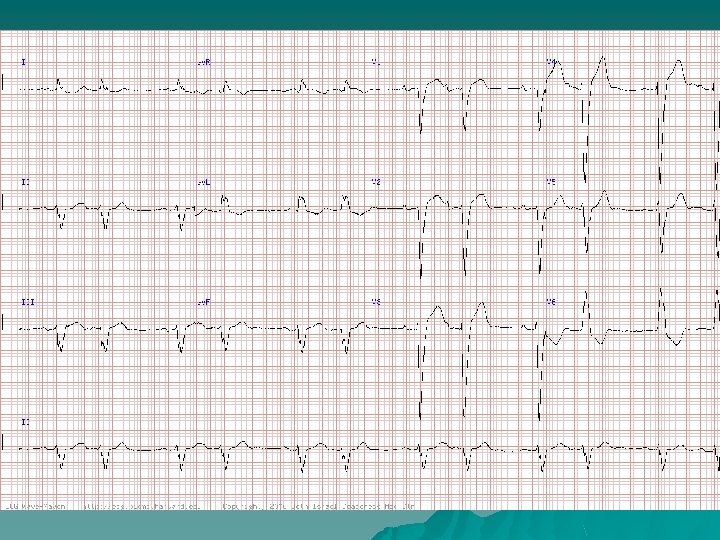
Interpretation: Anteroseptal MI with RBBB u u Anterior precordial leads reveal a q. R pattern marked ST elevation, and upright T waves Three points are worth making with regard to a RBBB – Secondary T wave inversions are typically seen in the right precordial leads (only in those leads with a terminal R'). Upright T waves in such leads might indicate ischemia, etc. T wave inversions in leads with no terminal R' might also be ischemic – ST elevations are not normally seen in RBBB – Right precordial Q waves may be seen in RBBB without an infarct (especially in the setting of acute right ventricular overload), but if the Q waves extend past V 2 or if they are slurred or wide, they suggest pathology u Bottom Line: Bundle branch block, especially RBBB does not render the ECG uninterpretable!!

Interpretation: NSR With Prior MI and RBBB u ECG shows sinus rhythm with PAC’s u RBBB causing widely but physiologically split S 2 on physical exam u Pathologic Q wave V 1 -V 3 due to prior anteroseptal MI caused by left anterior descending occlusion

Acute Ischemia and LBBB

Acute Ischemia and LBBB u u Many different electrocardiographic criteria have been proposed for identifying acute infarction with LBBB (none sufficiently sensitive) Features indicating possible acute ischemia – ST↑ in leads with positive QRS complex “inappropriate concordance” – ST↓ in leads V 1, V 2, or V 3 which have predominantly negative QRS complexes “inappropriate concordance” – Extreme ST↑ (>5 mm) in leads V 1 and V 2 u If doubt persists, serial electrocardiograms may show evolving changes.
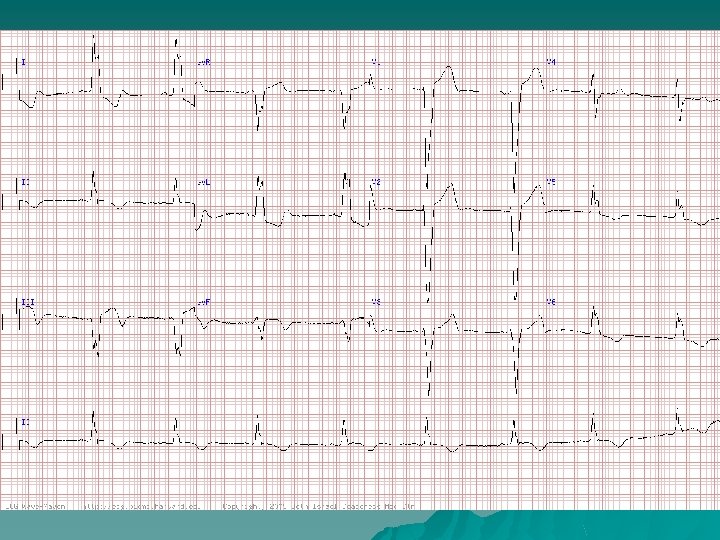

Interpretation: Inferior AMI with LBBB u u u Sinus bradycardia and LBBB with primary ST-T wave changes LBBB morphology with primary biphasic and inverted T waves in leads 2, 3 and a. VF Uncomplicated bundle branch blocks should have "secondary" T wave changes Inverted T waves suggest that a "primary" or ischemic process is evolving in the inferior distribution Pt had a myocardial infarction with a CK of 700 and 21% MB fraction Ischemic ECG changes can sometimes be read despite the presence of a bundle branch block
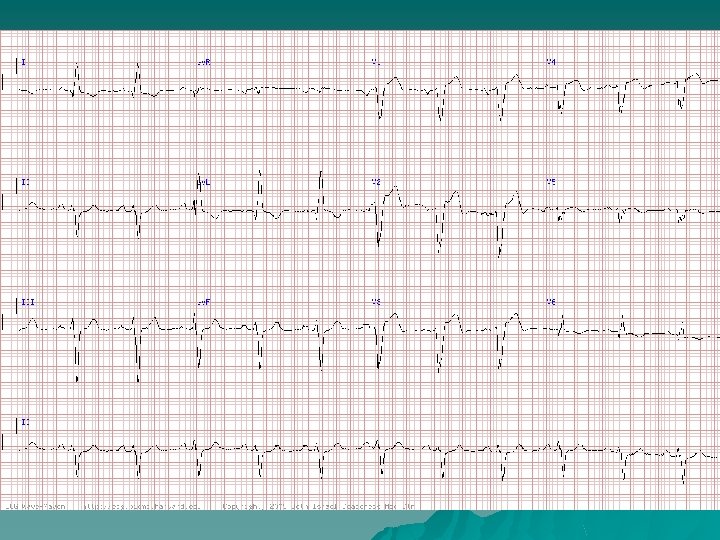

Interpretation: Anterior AMI with LBBB u u u Evidence of prior and possibly evolving MI superimposed on LBBB Prior MI is indicated by Q waves as part of a q. R in I and V 6 Notching of the ascending limb of the S wave in the mid-left chest leads consistent with prior MI (Cabrera's sign) Biphasic T waves in the mid-left chest leads raise consideration of evolving ischemia/MI Statement that "LBBB precludes diagnosing MI" is not correct Yet, LBBB often does mask changes of prior or acute MI

Review

Bundle Branch Block Review QRS duration ≥ 120 ms u LBBB u – Broad, notched R waves in leads V 5 and V 6 and usually leads I and a. Vl – Small or absent initial r waves in leads V 1 and V 2 followed by deep S waves – Absent septal q waves in left-sided leads – Prolonged intrinsicoid deflection (>60 ms) in V 5 and V 6 u RBBB – Broad, notched R waves (rsr', rs. R', or r. SR' patterns) in leads V 1 and V 2 – Wide and deep S waves in leads V 5 and V 6

Bundle Branch Block Review u u u Normal leads V 1 and V 6 Typical QRS-T patterns in RBBB and LBBB Note the secondary T wave inversions in leads with an r. SR' complex with RBBB and in leads with a wide R wave with LBBB

Interpretation: NSR With LBBB u u u Patient had hypertrophic obstructive cardiomyopathy with chronic LBBB Note evidence of LAA Most patients with LBBB have LVH Presence of LAA with LBBB is also strongly suggestive of underlying LVH Note: there is some baseline artifact here that at times simulates a pacemaker stimulus--however the patient did not have an electronic pacemaker and the P waves and wide QRS are due to native conduction entirely

Interpretation: SR with 2: 1 block and RBBB Slow AV nodal conduction (note long PR of conducted beats) and infra-nodal block of His-Purkinje disease u RBBB, also LAA and LVH u Dual-chamber pacemaker was implanted u Marked T-wave inversions in the anterolateral leads with QT prolongation, which was not due to MI or CAD u Prominent T-wave inversions like these have been reported after episodes of profound bradycardia and syncope (may have neural basis) u
 making VT")
PSVT with RBBB u Classic RBBB morphology (rs. R' in V 1) making VT unlikely u No definite atrial activity is seen (P waves or flutter waves) u Regular rate 150 bpm excludes afib u Flutter waves? No. u Rhythm most consistent with PSVT u Most likely AVNRT

Interpretation: NSR With PAC’s and LBBB u u u Frequent PACs which appear in a bigeminal pattern, accounting for the “group beating” pattern, simulating sinus rhythm with AV Wenckebach with 3: 2 conduction However, the second P wave in each couplet is premature and has a different morphology, since it comes from an ectopic atrial site Biphasic P waves with prominent negative component in V 1 indicative of LAA Subtle but important supportive finding is the distinct notching of the ascending part of the S wave in lead V 5 with the LBBB This finding in leads V 3 -V 5 with LBBB is referred to a Cabrera’s sign and is a marker of myocardial scarring due to myocardial infarction or other causes Biventricular heart failure was present with severe LV dysfunction with a LV EF 20 -25% and both MR and TR (due to chemotherapy-induced cardiomyopathy)
- Slides: 56