ppmv 350 Last Interglacial Last Ice Age Carbon

 350 Last Interglacial Last Ice Age Carbon Dioxide 300 250 200 [Adapted from")
(ppmv) 350 Last Interglacial Last Ice Age Carbon Dioxide 300 250 200 [Adapted from Figure 6. 3, ©IPCC 2007: WG 1 -AR 4] 600 500 400 300 200 100 0 Thousands of Years Before Present Humans are ‘forcing’ the system in a new way. CO 2 increases are mainly due to fossil fuel burning. CO 2 has not been this high in more than half a million years. Ice ages are not random. They are 'forced' (by earth’s orbital clock…. changes in the sunlight received).

Emission pathways that lead to stabilization Pay-off between costs and uncertainty: – 650 : 0. 3% of GDP, 0 -10% chance of meeting 2 o. C – 550 : 0. 7% of GDP, 0 -30% chance of meeting 2 o. C – 450 : 1. 4% of GDP, 20 -70% chance of meeting 2 o. C Den Elzen, Meinshausen and Van Vuuren. Multigas stabilisation pathways. 5 Kram / van Vuuren, 2 degrees under uncertainty

Global Anthropogenic GHG Emissions IPCC AR 4 By Gas By Sector

8 Historical emission Projection emission

2. วธการจดทำ � Bottom-up • IPCC Methodology • Life Cycle Assesmment Approach � Top-down • Greenhouse gas measurements & atmospheric modeling
 Inventory")
IPCC Methodology �UNFCCC requested IPCC to provide methodology to estimate National GHG (NGI) Inventory to be reported with the same standard for both Annex I and Non-Annex I �IPCC has developed Inventory Guidelines

2000 Good practice guidance on GHG inventory and Uncertainty management 1996 IPCC Revised Guidelines 12 The Reporting Instructions (Volume 1) 2003 Good practice guidance on LULUCF The Workbook (Volume 2) The Reference Manual (Volume 3)

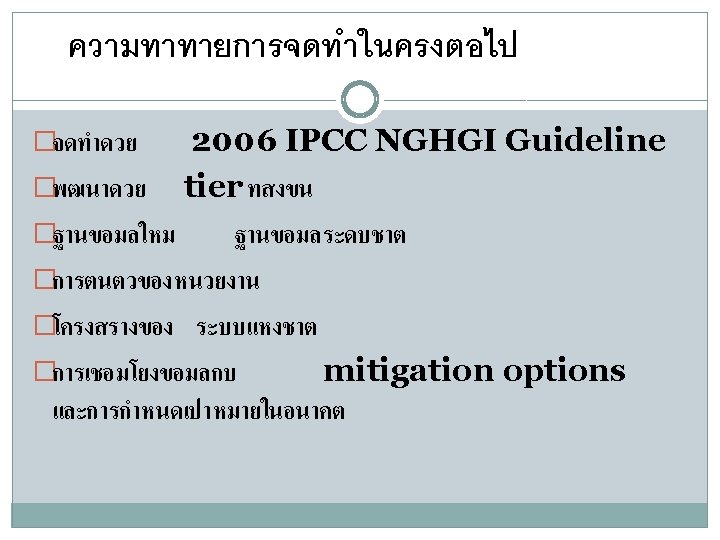
2006 IPCC Guidelines 13 2006 IPCC Guidelines 5 volumes Vol. 1 GGR Vol. 2 Energy Vol. 3 IPPU Vol. 4 AFOLU Vol. 5 Waste Agriculture is combined with LULUCF

UNFCCC – National GHG Inventory

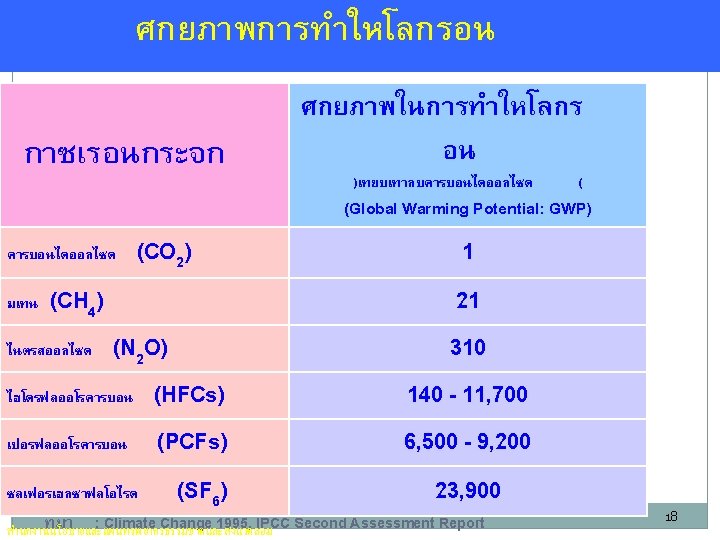
วธการคำนวณ Mass of fossil fuel= tonnes Energy used = k. Wh Area =hectare Volume = m 3 wastewater Emission = ( CO 2, CH 4, N 2 O, PFC, HFC. SF 6) kg GHG / unit of activity Activity Data (AD) x Emission Factor (EF) Tonnes CO 2 equivalent of the estimated year CO 2 =1 CH 4=21 N 2 O=310 HFC= 140 -11700 PFC= 9200 SFC= 23900

Conceptual framework of GHG estimation

National GHG Inventory Calculation Emission = Activity Data x Emission Factor DEDE 5 sectors EGAT Energy PTT OTP Industrial Process Emission factors IPCC default value National Research EPPO DIW DLD OAC RFD BMA PCD Agriculture Land Use Change and Forestry Waste Review literature International driver Expert consultation Relevant institution consultation Activity data
 AD =")
Level of Methodologies � Tier 1 Default emission factor (IPCC 1996 guidelines) AD = country data or international driver EF =IPCC default value � Tier 2 Country-specific emission factor AD = country data EF= country specific � Tier 3 Specific emission factor (fuel and technology used) Specific methodology used AD= country data disaggregate by types EF = country specific disaggregate by activity data types Specific model use

4. ������ (Agriculture( 1. ����� (Energy( A. ������������� (Fuel Combustion ( 1. ����������� (Energy Industries( A. ��������������������� Tier 1 (Enteric Fermentation( B. ����������� (Manure Management) 2. ���������������� (Tier 2 for N 2 O) (Manufacturing Industries and Construction( Tier 1/2 3. ����� (Transport( C. ������ (Rice Cultivation( Tier 2 4. ����� (Other Sectors ( D. ������������ (Agricultural Soils( Tier 1 4 a. ���� Commercial/Institutional 4 b. ������� (Residential( Tier 1 4 c. ������ (Agricultural/Forestry/Fishing( 5. ����� (Other( B. ����� Fugitive Emissions from Fuels 1. ���� Solid Fuels 2. ���� Oil and Natural Gas 2. ����������� (Industrial Processes( A. ��������� (Mineral Products( B. ���������� (Chemical Industry( C. ������������� (Metal Production( D. �������������� (Other Production( E. �������������� (Prescribed Burning of Savannas( F. ������������� (Field Burning of Agricultural Residues( G. ����� (Other( Tier 2 - 5. ������������������ (Land Use, Land-Use Change and Forestry( A. �������������������� (Changes in Tier 2 Forest and Other Woody Biomass Stocks) B. ����������������� (Forest and Grassland Tier Conversion) C. ��������������� (Abandonment of Managed Lands) D. ����� (Other( 2 Tier 2 - 6. ����� (Waste( E. Tier 1 ��������������������������� A. ������������� (Solid Waste Disposal on Land( ������� (Production of Halocarbons and SF 6( B. ����������� (Wastewater Handling( F. ������������������������� C. ������������� (Waste Incineration( (Consumption of Halocarbons and SF 6( D. ����� (Other( G. ����� (Other( 7. ���� (Other( 3. Solvent and Other Product Use ) ������� ( - Tier 2 -

Energy Sector 21 Combustion process : CO 2 , (CH 4, N 2 O, ) Power plant, Industries, transportation

Emission from industrial process 22 Chemical process ; CO 2 , (CH 4, N 2 O, ) HFC, PFC, SF 6

Emission from 23 industrial process �Cement production--- CO 2 �Petrochemical -----N 2 O CH 4 �Iron and steel ------ CH 4 �Carpolactam-----N 2 O

Agriculture How methane and N 2 O produced 24
![Methane emission from rice field 25 Denier van der Gon, 1996].](http://slidetodoc.com/presentation_image_h/30735a1387648c7f612445866900ae5c/image-25.jpg "Methane emission from rice field 25 Denier van der Gon, 1996].")
Methane emission from rice field 25 Denier van der Gon, 1996].

Land-use change and forestry 26 Land degradation: CH 4, N 2 O Thermal process ; CO 2 , (CH 4, N 2 O, )

Land-use change and forestry 27 �Changes in forest and other woody biomass stocks· � Forest and grassland conversion �Abandonment of croplands, pastures, plantation forests, or other managed lands

Waste sector 28 SWDS and Wastewater Biological and thermal process: CH 4, N 2 O) CO 2)

Solid Waste Landfill Anaerobic digestion 29 Incineration

Wastewater handling and discharge �Domestic waste water 30 �Industrial wastewater

Cross cutting issues �Uncertainty analysis Activity data Emission factor Overall �Transparency Documentation Source by source description template Worksheet calculation �Key sources analysis �Time series 2000 -2004

3. Emission in 2000 by sectors

National total including LULUCF = 229. 09 Mt CO 2 eq Emission in 2000 (Mt CO 2 eq, %) – by sector
")
Emission in 2000 of Energy sector (Mt CO 2 eq, %)
")
Emission in 2000 of ‘Industrial Process’ (Mt CO 2 eq, %)
")
Emission in 2000 of ‘Agriculture’ (Mt CO 2 eq, %)
")
Emission in 2000 of ‘LULUCF’ (Mt CO 2 eq, %)
")
Emission in 2000 of ‘Waste’ (Mt CO 2 eq, %)

Global GHG Emission Gt. CO 2 -eq/yr Total GHG emissions 60 55 50 70% จาก 1970 -2004 เพมขน 40 35 30 25 CO 2 ตวการหลก 20 15 10 5 0 1970 1980 1990 IPCC AR 4 WGIII 2007 2000 2004 39 จาก fossil fuel

Emission in 2000 by gas types

Share of GHG type by sector

Key Categories Analysis

Key Categories with LUCF

Key Categories : CO 2 emission and removal

Key Categories: CH 4

Key Categories: N 2 O

TIME SERIES 2000 - 2004

National Total Emission 2000 – 2004 with LULUCF

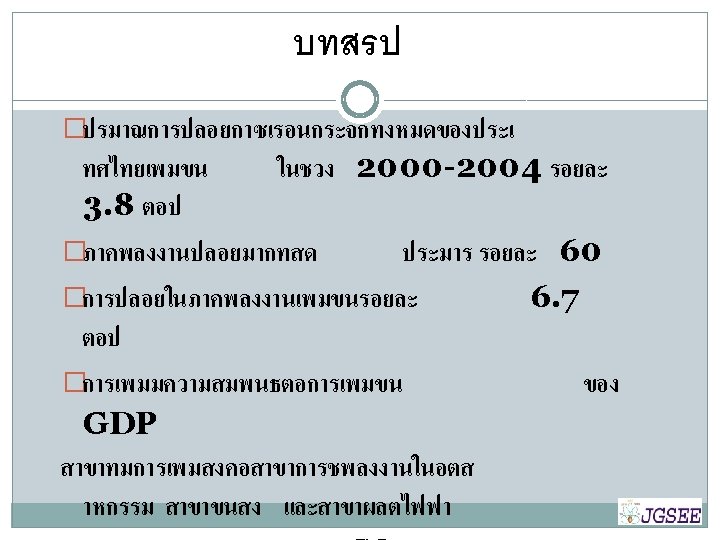
National Total Emission 2000 – 2004 49 3. 2 % increase per year 5. 6 % increase per year 1. 2 % increase per year 8. 4% increase per year 5. 9 % increase per year สำนกงานนโยบายและแผนทรพยากรธรรมชาตและสงแวดลอม 2553


LUCF LULUCF AFOLU

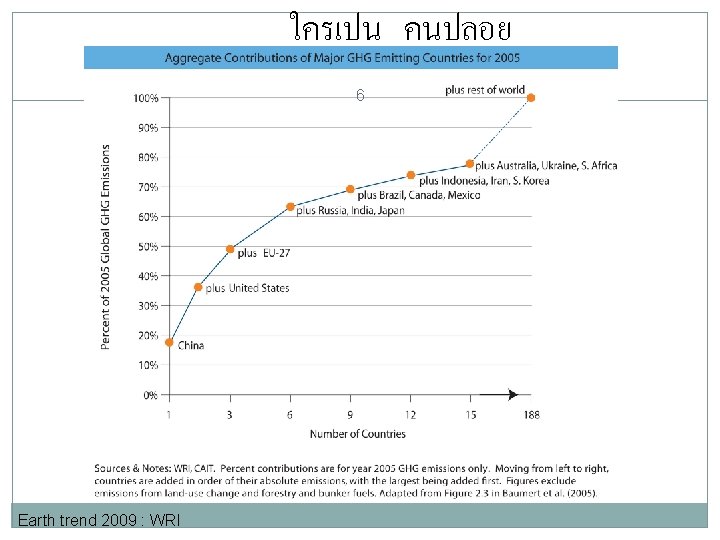
Thailand 3. 3 Data Sources and Notes 2009 WRI, CAIT

CO 2/GDP Data Sources and Notes 2009 WRI, CAIT

Data Sources and Notes 2009 WRI, CAIT

- Slides: 61