PPG Conference Workshop B 20 April 2016 Lee

PPG Conference Workshop B 20 April 2016

Lee Faris Wickford TSA 2

Lee Faris Headof. School@stambridge. es sex. sch. uk

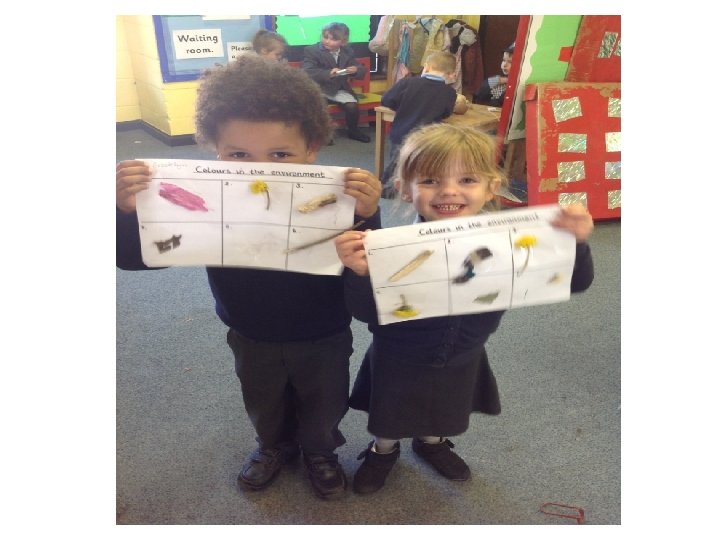
Schools opening a PVI/ Nursery to promote parental engagement and PP pupils' attainment

Schools opening a PVI/ Nursery to promote parental engagement and PP pupils' attainment

Our settings: • • • Maintained nursery at Briscoe Maintained class at Waterman Maintained class at Stambridge PVI Briscoe PVI Wickford C of E


Why we did it? • • • Build links with parents PP intervention Moral purpose HEARTS values ( Service) Baseline data / stop moaning

Starting nursery 2015 Area of Overall Learning Attainment Attended Our Nursery did not attend our nursery Term MR SC MFB MH HSC LA U B 28% 39% 36% 23% 34% 31% B 35% 50% 40% 59% 55% 40% B 31% 25% 50% 31% 0% 13% S R W N SSM 25% 0% 0% 26% 11% 35% 0% 0% 45% 20% 19% 0% 0% 0% 6%

CL focus

2014 -15 GLD • 84% of those who attended BPS provision at GLD compared to 65% Essex • School readiness through early starts for PP children

Separate But equal
")
Admissions • FSM • FEEE 2 criteria • HEARTS criteria • (beyond PP)

Parental engagement • • Stay and play Induction 3 x Relationships with staff SEND / EHCP process Early Intervention Children’s centres Services

Behaviour

No profits Money on resources and subs. places

Staffing • Qualified teachers • Lesson study , teach meet , CPD entitlement

Jenni Saward Lyons Hall TSA 20

Parental Engagement Case-Study Jenni Saward Assistant Head Notley Green Primary

Five Schools in the study Notley Green Primary. John Ray Infants School. Wethersfield C of E Primary. Great Bradfords Junior School. Beckers Green Primary School.

Before embarking on the study. . I did a bit of research to see if what everyone was doing was the best for raising standards according to the most recent research.

Key points to consider…. . 2007 -Research for DCSF by Professor Alma Harris and Janet Goodhall, University of Warwick ‘Engaging Parents in Raising Achievement’ ‘What look like low aspirations may often be high aspirations that have been eroded by negative experience’ ‘Parental engagement is a powerful lever for raising student achievement in schools. Where parents and teachers work together to improve learning, the gains in achievement are significant. ‘… hard to reach parents tend to see the school as hard to reach’

JRF Kintera et al. 2011 This study challenged the widespread presumption that poorer children and their parents have low aspirations. It found that poorer children (along with their families) often have high aspirations and that many want to go to university or get professional jobs. It also found that rather than raising aspiration in order to raise attainment there is a real need for children and parents to be offered support to learn more about educational and career options so they can make more informed decisions about their future. What parents do is more important than who parents are. Parenting has more influence on achievement than household income or level of education and can help protect a child from multiple disadvantage. Children spend only 15% of their waking time in school. The family plays a crucial role in deciding how the remaining 85% of time is spent.

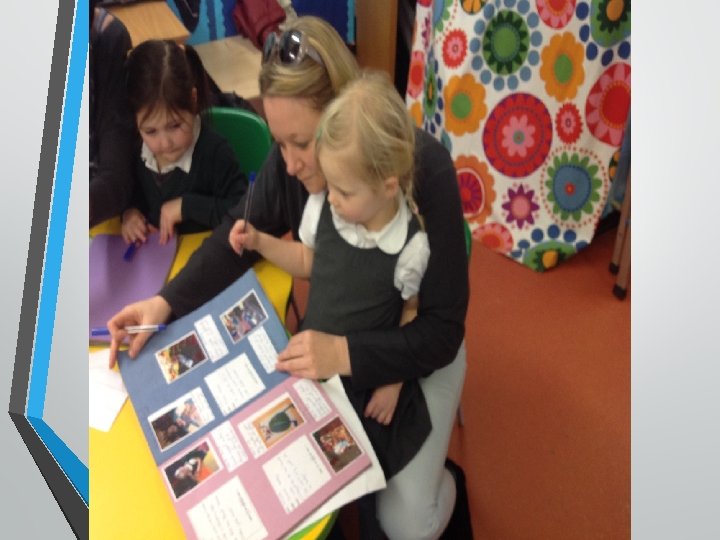
So what is everyone doing? All schools had a heavy focus on relationships. Big emphasis on attendance! Being ‘present’ at the school gate in the morning and at home time. Tea and chat opportunities. Most schools had some form a ‘pastoral care team’. Disadvantaged families more often than not, have communications with these teams regularly. It is here where the barriers, judgements and preconceived ideas about school can be broken down. FAST teams- They have worked in school with groups of children on self-esteem, friendship issues, carried out home visits to support parents with children’s challenging behaviour at home and discussed barriers to attendance.

Helping difficult home lives. Some strategies involved supporting home routines and increasing flexibility. Breakfast clubs (supports morning routines) Extended parents evenings (all week) Home visits- Invaluable in EYFS to begin the processes of good relationships.

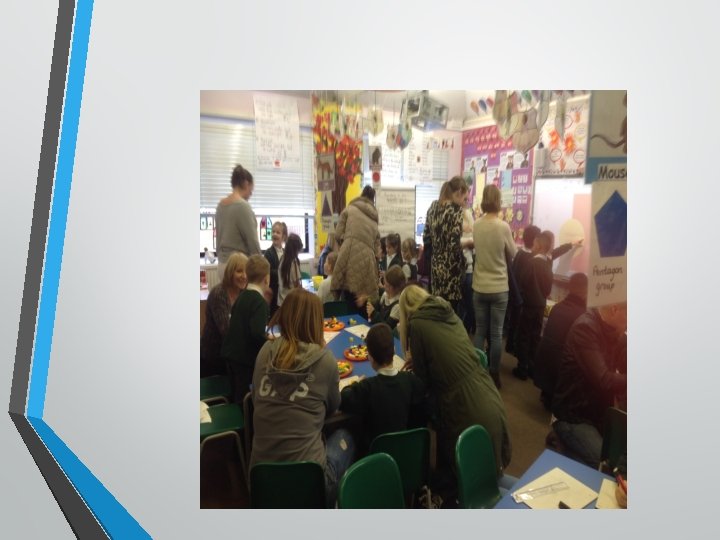
Enjoyable sessions! Outcome afternoons. “Romans Afternoon for Year 3: - Included the chance for parents to stage an attack on their children with foam balls as they defended themselves with Roman shields. This also included a food tasting session for parents while laying on a couch of cushions and listening to Roman speeches written by the children. ”

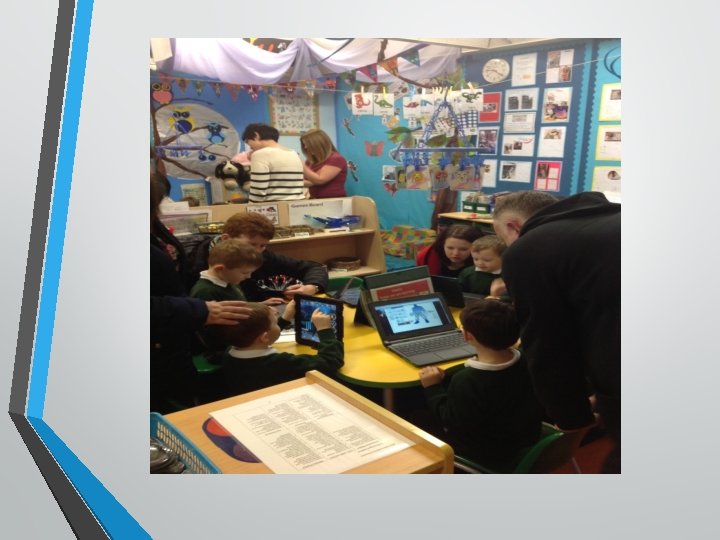
Access to information. Innovative The idea! POD! Getting the message across to disengaged parents via outside information pods.

What does the data say?

In Summary. Data suggests that the impact of all the different strategies working cohesively and collectively is narrowing the gap. One single strategy doesn’t have as great an impact as lots of avenues. Relationships and time spent breaking down barriers including attendance is a key place to start. An occasional innovative strategy draws in attention for all!

Questions? Email: jenni. saward@notleygreen. essex. sch. uk

THANK YOU!

George Law Rayleigh TSA 34

Starting Point A child who can identify and pronounce most phonemes (scoring highly in baseline tests) correctly but apparently has difficulty applying her knowledge in real-word context.

‘Laura’ Pupil Characteristics: • Often appears to be disinterested from class activities. • Peer relationships often fractious. • Little enthusiasm for learning generally. • Craves attention even if this is achieved via petty negative behaviour. • Limited vocabulary.

Cause for concern • September 2014 After a meeting between Laura’s mother and her class teacher it was agreed that poor reading progress was a cause for concern. Her mother stated that she had found it difficult to engage Laura in reading at home for the following reasons: • Laura demonstrated resistance to reading. • Mother was often too tired to force the issue due to difficult home circumstances. • Laura had been withdrawn at home since her father left home. • Laura did not have many interests aside television.

Actions • Screening of memory and processing to check cognitive functioning. (Screening profile showed Laura’s results to be age appropriate). • Child conference revealed she was actually acutely aware and afraid that she was ‘falling behind’. • I. T. - based phonic intervention started with a visual map of 146 speech sounds-speech sounds are highlighted when mastered and progress is expressed as a percentage of the ‘phonic-grid shaded-in.

Small steps of progress • Progress is initially slow: a two percent increase from September – October 2014. (‘Laura is a reluctant learner’). She fails to score on the Salford Reading Test. • Between November and December Laura manages to attain a thirteen percent increase. For the first time she demonstrates pride in her achievements with a ‘subdued smile’. Her achievement is acknowledge with a school House token and a text home. • After the Christmas break there is a slowing of progress -she starts January recording a five percent increase at the end of the month.

Significant Milestones • APRIL 2015 mother reports the home circumstances have improved and she would like to know more about how to help Laura at home-a meeting is made and a plan of action started. Laura scores her first Salford reading age of 4. 5 years. Both Laura and mother are pleased. • Laura is confident enough to take her work home via a ‘Tenminute Challenge Book’. This links her I. T. -phonic work with spelling lists and accompanying pictures to help her link ‘new’ vocabulary with sounds and meaning. • Since Laura is becoming confident, she feels willing and able to take on a reading recovery book too (Rapid Readers). She wants to spell and read every day and gets praise from both home and school.

Flying High • June 2015 -Class teacher reports greater enthusiasm generally. • Gap between reading-age and chronological-age narrows to minus three months. • November 2015 - The difference is no more: Laura’s reading age is PLUS seven months. • December 2015 - The difference is PLUS fifteen months. Laura is taken off intervention and is keen to demonstrate her intelligence. • Laura is a success and she is has achieved the greatest rate of reading progress in school.

Data Summary • • Month Sep. 14 Nov. 14 April 15 May 15 Oct. 15 Nov. 15 Dec. 15 % phonic score 18 33 45 55 58 65 70 Reading Age No score 4. 5 Yrs. 4. 8 Yrs. 6. 4 Yrs. 7. 3 Yrs. 7. 11 Yrs. Difference -19 months -16 months -2 months + 7 months + 17 months

What made the difference? • A visual system of tracking making progress visual to parent and child. • The perception that progress is celebrated at home and school. • Home and school have shared aims. • The parent is a partner in the education process. • Learning occurred in context relating visuals, sounds and vocabulary. • Laura found out that she is clever and can do!

A Different Child • Laura cannot now stop reading. • She often stops me to tell me how she is doing. • She takes pride in her work. • She actually smiles more and is more confident. • She has Improved peer relationships. • Laura is NOT a different child-she just needed the support to help her discover she is clever.

Sue Matthews Rayleigh TSA 45

Pupil Premium Conference th Wednesday 20 April 2016 Engaging parents’ of disadvantaged

Hockley Primary School Context • In south of Essex • Slightly larger than average Primary School – 315 • Lowest percentile for BME • Lower than National percentage of parents receiving higher education • Outstanding OFSTED judgment in January 2016

Disadvantaged pupils • • Lower percentile of pupils in the free school meals group Average annual funding of around £ 42, 000 Between 3 and 8 pupils in each year group “The attainment of disadvantaged pupils is generally above the national average for this group, but below that of their peers in school in some subjects. They are making rapid progress and are closing this gap as they move through the school. ” OFSTED January 2016

School Expectation • For all staff to know who the PP children are • For PP list to be updated every half term • Teachers receive analysis of PP GAP each term • Focused discussion at Pupil Progress meetings regarding funding impact • Identification of next steps

Getting to know the parents • Early identification of PP pupils – sibling link/ National insurance number search • EYFS – home visits informing parents of expectations – 3 parent meetings pre start with Literacy and Maths workshops • Early identification of any specific needs

Communicate with parents. • Keep parents informed of school improvement • September Curriculum meetings • School improvement updates on weekly e-newsletter • Open door policy – parents encouraged to come in and ask questions

Engagement of parents • • • EYFS parents have half termly “stay and play” afternoons Regular workshops to develop home school support – reading/phonics/EYFS practice/GPS/ maths – calculation, multiplication/e-safety Assessment is discussed with parents at parents’ evenings – assessment workshops presented to parents Parents’ booklet of assessment Further support focused on closing the GAP with parents of PP pupils and ways they can support further at home. Monitoring of impact discussed

Assessment • • Termly pupil progress meetings – focus on PP attainment and progress Compare GAP between PP pupils and others in cohort GAP comparison to National and local schools Early intervention of support for PP pupils Tailor the interventions to the needs of the pupils Detailed planned expenditure of funding using Sutton trust – shared on website More detailed discussions with parents to ensure clear understanding of how funding is used

Closing the GAP Year 4 – Spring 2016 50 Autumn 2015 Spring 2016 Summer 2016 1 = 2% Reading Sum B/L APS GAP PROG GAP APS PROG APS GAP PROG GAP Notes PROG COHORT 50 (100%) 52. 5 54. 0 53. 6 1. 1 56. 0 3. 5 Girl 26 (52%) 52. 5 53. 5 -0. 1 1. 0 -0. 1 55. 9 -0. 1 3. 5 = Boy 24 (48%) 52. 6 53. 7 +0. 1 1. 1 = 56. 2 +0. 2 3. 6 +0. 1 Pupil Premium 5 (10%) 52. 1 53. 2 -0. 4 1. 1 = 55. 8 -0. 2 3. 6 +0. 1 Pupil Premium + 1 (2%) 53. 0 -0. 6 0 -1. 1 55. 0 -1. 0 2. 0 -1. 5 Disadvantaged 6 (12%) 52. 3 53. 7 -0. 4 1. 3 -0. 2 55. 7 -0. 3 3. 4 -0. 1 52. 6 54. 0 56. 1 +0. 1 3. 6 +0. 1 Other cohort Other /Dis (no disadvantaged) Other /Dis 1. 5 -0. 3 -0. 2 SEN ASI 5 (10%) 50. 2 51. 2 -2. 4 1. 0 -0. 1 53. 8 -2. 2 3. 6 +0. 1 SEN (EHCP) 0 Inwardly Mobile 4 (8%) 52. 5 54. 0 +0. 4 1. 5 +0. 4 56. 5 +0. 3 4. 0 +0. 5 BME 2 (4%) 50. 0 51. 0 -2. 6 1. 0 -0. 1 53. 5 -2. 5 3. 5 = EAL 0 PROG GAP Writing Sum B/L APS GAP PROG GAP APS PROG APS GAP PROG COHORT 50 (100%) 52. 2 53. 5 52. 9 1. 3 0. 7 55. 2 3. 3 Girl 26 (52%) 52. 3 52. 9 = 0. 6 -0. 1 55. 2 = 3. 2 -0. 1 Boy 24 (48%) 52. 1 53. 0 +0. 1 0. 9 +0. 2 55. 3 +0. 1 3. 5 +0. 2

Closing the GAP Year 4 – Spring 2016 50 Autumn 2015 Spring 2016 Summer 2016 1 = 2% Pupil Premium 5 (10%) 52. 0 52. 4 -0. 5 0. 4 -0. 3 55. 0 -0. 2 3. 4 +0. 1 Pupil Premium + 1 (2%) 52. 0 -0. 9 0 -0. 7 54. 0 -1. 2 2. 0 -1. 3 Disadvantaged 6 (12%) 52. 0 53. 0 -0. 6 1. 0 -0. 4 54. 8 -0. 4 3. 1 -0. 2 52. 2 53. 6 55. 3 -0. 1 3. 3 = 53. 0 -2. 2 3. 6 +0. 3 Other cohort Other /Dis (no disadvantaged) SEN ASI 5 (10%) Other /Dis 1. 4 -0. 6 49. 8 50. 2 -0. 4 -2. 7 0. 4 -0. 3 SEN (EHCP) 0 Inwardly Mobile 4 (8%) 53. 8 54. 3 +1. 4 0. 5 -0. 2 57. 0 +1. 8 4. 2 +0. 9 BME 2 (4%) 49. 0 EAL 0 Maths Sum B/L 50. 0 APS -2. 9 COHORT 50 (100%) 52. 0 53. 1 1. 0 APS GAP +0. 3 52. 0 PROG GAP PROG APS -0. 2 52. 8 1. 1 0. 8 55. 8 3. 5 APS GAP +0. 2 PROG 55. 8 4. 0 PROG GAP APS GAP PROG GAP PROG 4. 0 Girl 26 (52%) 51. 7 52. 4 -0. 4 0. 7 -0. 1 55. 3 -0. 5 3. 8 -0. 2 Boy 24 (48%) 52. 4 53. 1 +0. 3 0. 7 -0. 1 56. 3 +0. 5 4. 2 +0. 2 Pupil Premium 5 (10%) 51. 8 52. 8 = 1. 0 +0. 2 55. 8 = 4. 4 +0. 4 Pupil Premium + 1 (2%) 51. 0 -1. 8 0 -0. 8 54. 0 -1. 8 3. 0 -1. 0 Disadvantaged 6 (12%) 51. 7 52. 5 -0. 3 0. 8 = 55. 5 -0. 3 4. 2 +0. 2 52. 1 53. 1 55. 8 = 4. 0 = SEN ASI 5 (10%) 49. 8 50. 6 -2. 2 0. 8 = 53. 2 -2. 6 3. 6 -0. 6 SEN (EHCP) 0 Inwardly Mobile 4 (8%) 53. 0 53. 5 +0. 7 0. 5 -0. 3 56. 0 +0. 2 3. 5 -0. 5 BME 2 (4%) 51. 5 52. 5 -0. 3 1. 0 +0. 2 55. 5 -0. 3 5. 0 +1. 0 EAL Other cohort Other /Dis (no disadvantaged) -0. 6 Other /Dis 1. 1 -0. 3

Attendance • For some PP pupils attendance can be lower than 95% • Parents kept informed through letter reminders • Below 95% parents meeting with HT and extended schools support – has led to PP families being supported by family support • Monitoring shows with this support attendance always improves

OFSTED • “Because the school knows the precise needs of each pupil exceptionally well, the creative and resourceful use of additional funding for disadvantaged pupils is very effective. Additional support, ‘booster’ sessions to ensure that pupils catch up if they are falling behind activities that broaden their cultural awareness are routinely planned. As a consequence, these pupils continue to grow in confidence and make progress similar to, and often better than, their peers. ”

Any Questions smatthews@hockley. essex. sch. uk
- Slides: 62