Pp 4 CHAPT 4 Sampling Distributions and Hypothesis

Pp # 4 CHAPT 4 Sampling Distributions and Hypothesis Testing 1

Sampling Distributions §Probability and Samples: § Distribution of Sample Means 2
 and population parameter")
Sampling Error The amount of error between a sample statistic (M) and population parameter (µ). Distribution of Sample Means: Distribution of Sample Means is the collection of sample means for all the possible random samples of a particular size (n) that can be obtained 3

4
 M § The Standard Deviation of the distribution of sample")
Standard Error (σ ) M § The Standard Deviation of the distribution of sample means is called Standard Error of Mean (σM). Ex: M 1=8, M 2= 3, M 3=5, M 4=4, § σ= √(ss/N) Means 8 3 5 4 µ=5 SS=Σx²-[(Σx)²/N] =114 -(400/40=14 § σ = √(14/4)=1. 87 => same as =>σM =1. 87 § The mean of all means is 5 (sampling distribution) µ=5 5
 M § The Standard Deviation of the distribution of sample")
Standard Error (σ ) M § The Standard Deviation of the distribution of sample means is called Standard Error of Mean (σM). § *The standard error provides a measure of how much distance is expected on average between sample means (M) or (x ) and the population mean (µ). § σM= σ/√n 6

Standard Error § 7

Standard Error § σM=σ/√n § Or σM=√σ²/n 8

Standard Deviation of z is equal to = σM μ=500, σ=100, M=540, n=25 σM=σ/√n σM =20, which is equal to one σ for Z. 9

Sampling Distribution § Sampling Distribution is a distribution of statistics obtained by selecting all the possible samples of a specific size from a population. Ex. Every distribution has a mean and standard deviation. The mean of all sample means is called Sampling Distribution. The standard deviation for theses means is called Standard Error of Mean (σM). 10
 or (x )")
Expected Value of M The mean of the distribution of (M) or (x ) sample means (statistics) is equal to the mean of the Population of scores (µ) and is called the Expected Value of M or Central Tendency M = µ And, the standard deviation for all of these means is called Standard Error of Mean, σM. σM provides a measure of how much distance is expected on average between a sample mean (M) and the population mean (µ) 11
? § The standard error of")
What is the standard error of the mean (σM)? § The standard error of the mean estimates the variability between sample means that you would obtain if you took multiple samples from the same population. *The standard error of the mean (σM) estimates the variability between samples whereas the standard deviation (σ) measures the variability within a single sample. Ex. next 12

§ Ex; You have a mean delivery time of M=3. 80 days with a standard deviation of σ=1. 43 days based on a random sample of n=312 delivery times. These numbers yield a standard error of the mean of σM=0. 08 days (1. 43 divided by the square root of √ 312). Had you taken multiple random samples of the same size and from the same population the standard deviation (σ) of those different sample means would be around 0. 08 days. 13

We use the σM to determine how precisely the mean of the sample estimates the population mean. Lower values of the (σM) indicate more precise estimates of the population mean (μ). Usually, a larger standard deviation (σ) will result in a larger standard error of the mean (σM) and a less precise estimate. A larger sample size (n) will result in a smaller standard error of the mean (σM) and a more precise estimate. *Small S and large n => smaller standard error 14

https: //www. youtube. com/watch? v=0 p. CSw 93 B 63 I §SPSS uses the standard error of the mean (σM) to calculate the confidence interval (CI), which is a range of values likely to include the population mean 15

σ Calculate the CI and M for the following Sample Means: see next slide measures the values in Metric or %, but not in proportion. See minimum and maximum values for the CI. §SPSS 16

17

18

19

20

21
, the")
The Law of Large Numbers states that the larger the sample size (n), the more probable it is that the sample mean (M) or (x ) will be close to the population mean (µ) n≈ N 22

The Central Limit Theorem Describes the distribution of sample means by identifying 3 basic characteristics that describe any distribution: 1. The shape of the distribution of sample mean has 2 conditions 1 a. The population from which the samples are selected is normal distribution. 1 b. The number of scores (n) in each sample/group/treatment is relatively large (30 or more/variable) The larger the n the shape of the distribution tends to be more normal. Or, 30 participants per variable i. e. in Regression , ANOVA etc. 23

24

The Central Limit Theorem § 2. Central Tendency: States that the mean of the distribution of sample means M is equal to the population mean µ and is called the expected value of M. M = µ This µ means the average distance between M and is about Zero. § 3. Variability: or the standard error of mean σM. § The average standard deviation (σ) of the distribution of sample means is called the standard error of mean σ M. § It measures the standard amount of difference one should expect between M and µ is simply due to chance. 25
/σ § X= σ(Z)+µ for single score § µ= X- σZ")
FYI Z-Score § Z=(X-µ)/σ § X= σ(Z)+µ for single score § µ= X- σZ § σ= (X-µ)/Z § If X=60 § µ=50 26

Hypothesis Testing Z-Score for a sample M=110, μ=100, σ=15 27

Computations/ Calculations or Collect Data and Compute Sample Statistics Z Score for Research § 28

Computations/ Calculations or Collect Data and Compute Sample Statistics Z Score for Research § 29

Computations/ Calculations/Collect Data and Compute Sample Statistics Z Score for Research § 30

31

32

Effect Size http: //www. polyu. edu. hk/mm/effectsizefaqs/calculator. html Independent of sample size Reflects the size of association of variables © 2014, 2013, 2010 by Pearson Education, Inc. All rights reserved. Used to compare the strength of findings from different studies

d=Effect Size/Cohn’ d § Cohen's §A d and Effect Size statistically significant result does not mean that the result is practically significant (treatment effect). To correct this problem, it is recommended that whenever researchers report a statistically significant effect, they also provide a report of the effect size (see the guidelines presented by L. Wilkinson and the APA Task Force on Statistical Inferences, 1999). Therefore for different hypothesis test (test statistics) there are different options for measuring and reporting effect size.

d= Effect Size/Cohn’ d § The “effect size” gives an indication of whether something is practically significant. There are different ways of calculating an effect size. Examples: §r which is the correlation coefficient or R² which is the coefficient of determination Use Eta squared ή² for ANOVA Use Cohen’s d for Z and t-test § Use Phi Coefficient and Cramer, s V for Chi Square

What is effect size and why is it important? Effect size is the standard difference or standard mean difference between two treatment or variables (X, Y). Effect size is a statistical estimate of the size or magnitude of a treatment effect. The larger the effect size, the stronger the relationship between the independent and dependent variables, and the fewer subjects needed to detect a treatment effect.

Explain the relationship between effect size and sample size. Effect size determines the number of subjects required to detect a treatment effect. Researchers determine the number of subjects required for an expected effect size using power charts or programs that incorporate these charts.

What is the minimum number of subjects for each group? You should have at least 30 subjects in each treatment condition to detect a strong treatment effect. Fewer subjects in each condition risks not detecting the effect of the IV on the DV. Selecting and Recruiting Subjects

Evaluating effect size with Cohen’s d Magnitude of d Evaluation of effect size d= 0. 2 Small effect (mean difference around 0. 20 standard deviation) d= 0. 5 Medium effect (mean difference around 0. 5 standard deviation) d= 0. 8 Large effect (mean difference around 0. 8 standard deviation) 39
 Is the difference between the means in a treatment")
d=Effect Size/Cohn d § (d) Is the difference between the means in a treatment condition. It tells us How large the differences are, and The result from a research study is not just by chance alone, meaning (there is a big difference). 40

41
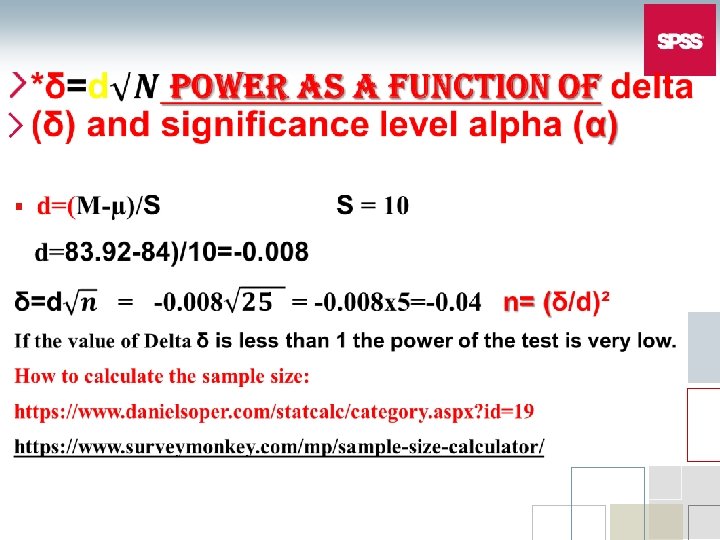
/σ 42")
d=Effect Size or d= (H 1 -H 0)/σ 42
and Sample size (n). As the sample size")
The relationship between Standard Error (σm )and Sample size (n). As the sample size increase there will be less error between the sample mean and population mean 43

Problem 1 §The population of scores on the SAT forms a normal distribution with µ=500 and σ=100. If you take a random sample of n=25 students, what is the probability (%) that the sample mean will be greater than 540. M ≥ 540? § Hint: First calculate the Z Score then, look for the proportion and convert into percentage (see graph next page). 44

45

Problem 2 § Once again, the distribution of SAT forms a normal distribution with a mean of µ=500 and σ=100. For this example we are going to determine what kind of sample mean (M) is likely to be obtained as the average SAT score for a random sample of n=25 students. Specifically, we will determine the exact range of values that is expected for the sample mean 80% of the time. § Hint: Since it didn't say greater or less therefore, we are interested in the middle 80%. Look for The Z value across the (proportion between mean M and z) or D=. 40. The Z critical values for top and bottom should be ± 1. 28. Then, Calculate the § σ M and use this formula M=Z. σM + µ twice with different Z values to determine the range of means (see graph next slide). 46

47

Sample Questions for Q 5 § 1. For a population with μ= 50 and σ= 5, the distribution of sample means based on n =100 will have a standard error of _____. 48

Sample Questions § 2. For a population with μ= 100 and σ= 15, the distribution of sample means based on n =25 will have a standard error of _____. 49

Sample Questions § 3. For a particular population a sample of n = 9 scores has a standard error of 5. For the same population, a sample of n = 36 scores would have a standard error of _____. § Hint: Since is the same population, first calculate the σ, then plug it into the σ M formula. 50

Sample Questions § 4. A sample of n = 49 scores is determined to have a standard error of 4 points. What is the standard deviation for the population from which the sample was obtained? 51

Sample Questions § 5. A random sample is selected from a population with a standard deviation of σ= 12. If the sample mean has a standard error of 3 points, how many scores are in the sample? 52

Sample Questions § 6. A normal population has µ = 10 and σ= 8. A random sample of n = 64 scores from this population has a mean of 14. What is the z-score for this sample mean? 53

Sample Questions § 7. A random sample of n = 16 scores is obtained from a population with μ= 20 and σ= 8. If the sample mean is M = 24, what is the z-score corresponding to the sample mean? 54

Sample Questions § 8. If a sample is selected from a normal population, then the probability that the sample mean will have a z-score less than z = 1. 50 is? 55

Sample Questions § 9. A treatment is administered to a sample selected from a population with a mean of μ= 100 and a standard deviation of σ= 5. After treatment, the sample mean is M = 105. Based on this information, the effect size as measured by Cohen's d is _____. 56

Hypothesis Testing 57

Hypothesis Testing § Hypothesis: an educated guess or Statement such as “The relationship between IQ and GPA (Topic of a research). It consisted of: § Information-> Knowledge-> Theory Question Hypothesis Information=> working with autistic children Knowledge=> learn or acquiring about autistic children Theory=> develop your own theory Question=> what is your research question? Hypothesis=> formulate your hypothesis 58

59

Hypothesis Testing § Hypothesis Test: Is a statistical method that uses sample data to evaluate a hypothesis about a population. § The statistics used to Test a hypothesis is called “Test Statistic” or “Statistical Test” i. e. , Z, t, r, F, etc. 60

Hypothesis Testing § The Logic of Hypothesis: § If your sample mean is consistent with your prediction we conclude that your hypothesis is reasonable. However, if there is a big discrepancy we decide that your hypothesis is not reasonable. § Ex. “Registered Voters are Smarter than Average People. ” 61

Hypothesis is a Research Topic § “High Cholesterol Can Cause Heart Attack” Experimental Research 62

Hypothesis is a Research Topic § “Heart Attack is Related to High Cholesterol” Correlational Research 63

Hypothesis is a Research Topic § “A Causal Relationship Study of The effect of High Cholesterol on Heart Attack” SEM 64

Hypothesis is a Research Topic §A META ANALYTIC STUDY of Heart Attack and High Cholesterol 65

Hypothesis is a Research Topic Study of Heart Attack and High Cholesterol: A Meta Analysis 66

Ho=Null H 1=Alternative 67

How should we support null hypothesis testing? An American Psychological Association task force recommended that researchers should include estimates of standard mean difference or effect size (d), and Confidence Intervals (CI), in addition to p values in their research. When you calculate a p value that is statistically significant, this means that your results are unlikely to be due to chance (are probably real).
 is a range")
How should we support null hypothesis testing? A Confidence Interval (CI) is a range of values above and below a sample mean that is likely to contain the population mean (usually 95% or 99% of the time).

Steps in Hypothesis-Testing Step 1: State The Hypotheses §H 0=Null Hypothesis §H 1 or ( HA ) : Alternative Hypothesis Researcher Hypothesis or (first/main hypothesis) 70

NULL HYPOTHESIS § States that there is no difference/relationship between the independent and dependent variables under study. A statement of equality. § Ho : µ 1 = µ 2 no difference between the two means § Ho: Null hypothesis § µ 1: Theoretical average of population’ sample/Alternative Hypothesis, Researcher Hypothesis

PURPOSE OF NULL HYPOTHESIS § A starting point for analysis § Assumes that chance caused any observed differences § Provides a benchmark for comparison § Accepted as true, otherwise prove that it is not.

THE RESEARCH HYPOTHESIS: H 1 §A statement of inequality §A relationship exists between the independent and dependent variables (there are difference between the groups) • H 1: Research hypothesis/Alternative hypothes

DIRECTIONAL/one tailed research hypothesis VS. NONDIRECTIONAL/two tailed RESEARCH HYPOTHESi. S § Directional Research Hypothesis § Groups are different, and direction is specified § Non-directional § Groups Research Hypothesis are different, but direction is not specified

Role of Statistics in Research 76

Steps in Hypothesis-Testing Step 1: State The Hypotheses §H 0 : µ ≤ 100 average §H 1 : µ > 100 average §Statistics: § Because the Population mean (µ) is known the statistic of choice is § z-Score 77
 or Set the Criteria for a")
Hypothesis Testing Step 2: Locate the Critical Region(s) or Set the Criteria for a Decision 78

Directional Hypothesis Test 79

Directional Hypothesis Test 80

None-directional Hypothesis Test 81

82

Hypothesis Testing Step 3: Computations/ Calculations or Collect Data and Compute Sample Statistics § 83

84

Hypothesis Testing Step 4: Make a Decision 85

Hypothesis Testing Step 4: Make a Decision 86

Statistical Significance p <. 05 Less than 5 in 100 chance that the difference/co rrelation would happen by chance alone © 2014, 2013, 2010 by Pearson Education, Inc. All rights reserved. Both strength of correlation/mean difference and size of sample influence statistical significance

Uncertainty and Errors in Hypothesis Testing § Type I Error α § Type II Error β next slide True H 0 False H 0 Reject Type I Error Fail to Reject/ Correct Decision Retain (Accept) α Correct Decision Power=1 -β Type II error β 88

True State of the World decision True H 0 Reject Fail to Reject /Retain (Accept) False H 0 Correct Decision Type I Error α Power =1 -β power to reject the Null Correct Decision Type II error β 89
 Type I error: H 0 is rejected even though it is true")
α&β §(α) Type I error: H 0 is rejected even though it is true (false positive). §(β) Type II: H 0 is not rejected even though it is false (false negative) 90

α&β § type I error is the incorrect rejection of a true null hypothesis (a "false positive", i. e. , accepting a false hypothesis as correct) § type II error is the failure to reject a false null hypothesis (a "false negative", i. e. , rejecting a true hypothesis as incorrect) 91

Power § Power is about the accuracy of a research/test. § The power of a statistical test is the probability that the test will correctly reject a false null hypothesis. § That is, power is the probability that the test will identify a treatment effect if one really exists. 92

102

103

The α level or the level of significance: § The α level for a hypothesis test is the probability that the test will lead to a Type I error. § That is, the alpha level determines the probability of obtaining sample data in the critical region even though the null hypothesis is true. 104

The α level or the level of significance: §It is a probability value which is used to define the concept of “highly unlikely” in a hypothesis test. 105

The α level or the level of significance: Increasing the alpha level (for example from α =. 01 to α =. 05): § Increases the probability of a Type I error. § Increases the size of the critical region. § Increases the probability that the sample will fall into the critical region 106

The Critical Region § It is composed of the extreme sample values that are highly unlikely (as defined by the α level or the level of significance) to be obtained if the null hypothesis is true. § If sample data fall in the critical region, the null hypothesis is rejected. 107

Factors that influence the outcome of hypothesis test are: Power to reject the H 0 § 1. Sample Size (Power as a function of n) § 2. Alpha level As α increases, power increases § 3. The Particular Test to be employed (One-tailed tests more power, less accurate. Two -tailed tests less power more accurate) § 4. Variance σ²/S² Standard Error § σm = √ σ²/n smaller more power 108

d=Effect Size/Cohn d §It is the difference between the means in a treatment condition. §It means that the result from a research study is not just by chance alone. It determines the size or strength of a treatment effect (similar to Power). 109

Effect Size=Cohn’s d §Effect Size tells us that the Result from a research study is more than what we expected to be just by chance alone. Ex. next 110

Effect Size=Cohn’s d § Ex. Select two Stats classes. Apply a special teaching technique to a treatment group (class 1) only. The Control group (class 2) will receive an average/regular teaching method. Give both groups an exam and Compare their exam’s mean. (see next slide). 111

Cohn’s d=Effect Size § 112

Evaluation of Cohn’s d Effect Size with Cohn’s d Table Magnitude of d Evaluation of Effect Size d≈0. 2 Small Effect Size d≈0. 5 Medium Effect Size d≈0. 8 Large Effect Size 113

Research Problem 1 § Researchers have noted a decline in cognitive functioning as people age (Bartus, 1990) However, the results from other research suggest that the antioxidants in foods such as blueberries can reduce and even reverse these age-related declines, at least in laboratory rats (Joseph, Shukitt-Hale, Denisova, et al. , 1999). Based on these results one might theorize that the same antioxidants might also benefit elderly humans. Suppose a researcher is interested in testing this theory. Next slide n
")
Problem 1 § Standardized neuropsychological tests such as the Wisconsin Card Sorting Test (WCST) can be use to measure conceptual thinking ability and mental flexibility (Heaton, Chelune, Talley, Kay, & Kurtiss, 1993). Performance on this type of test declines gradually with age. Suppose our researcher selects a test for which adults older than 65 have an average score of μ=80 with a standard deviation of σ=20. The distribution of test score is approximately normal. The researcher plan is to obtain a sample of n=25 adults who are older than 65, and give each participants a daily dose of blueberry supplement that is very high in antioxidants. After taking the supplement for 6 months. 115

Problem 1 § The participants were given the neuropsychological tests to measure their level of cognitive function. M=92, Use 2 tailed, α = 0. 05 § The hypotheses is that the “Blueberry supplement does appear to have an effect on cognitive functioning. ” Test this Hypothesis. Step 1 State the Hypotheses H 0 : H 1 : μ with supplement = 80 μ with supplement ≠ 80 116
 or Set the Criteria for a Decision 117")
Step 2: Locate the Critical Region(s) or Set the Criteria for a Decision 117

step 3 : Computations/ Calculations or Collect Data and Compute Sample Statistics Z Score for Research § 118

119

Step 4: Make a Decision 120

§ Problem 1 M=92, α = 0. 05 If one tailed then, If the hypothesis stated that the consumption of blueberry supplement will increase the cognitive functioning then, Step 1 H 0 : H 1 : μ ≤ 80 μ > 80 121

Directional Hypothesis Test 122

Problem 1 § M=92, α = 0. 05 If one tailed, another option If the hypothesis stated that the consumption of blueberry supplement will decrease the cognitive functioning then, Step 1 H 0 : H 1 : μ ≥ 80 μ < 80 123

Directional Hypothesis Test 124

Z-Score Calculator for a Sample http: //www. socscistatistics. com/tests/ztest_sample_ mean/Default 2. aspx Use this calculator to calculate the problem 1 125

Problem 2 § Alcohol appears to be involve in a variety of birth defects, including low birth weight and retarded growth. A researcher would like to investigate the effect of prenatal alcohol on birth weight (hypothesis). A random sample of n=16 pregnant rats is obtained. The mother rats are given daily dose of alcohol. At birth, one pop is selected from each litter to produce a sample of n=16 newborn rats. The average weight for the sample is M=16 grams. 126

Problem 2 § The researcher would like to compare the sample with the general population of rats. It is known that regular new born rats have an average weight of μ=18 grams. The distribution of weight is normal with σ=4, set α=0. 01, and use a 2 tailed test, which is, 0. 005 on each tail and the critical value is Z=2. 58 Test this Hypothesis. H 0 : H 1 : Step 1 μ alcohol exposure = 18 μ alcohol exposure grams ≠ 18 grams 127
 required to hold the sampling error within the")
Estimate the minimum sample size (n) required to hold the sampling error within the specific limits. There are different statistical procedures to estimate the (n) should be ≥ 30. (Law of large number). participants /variable 30 1. n= (σ/d)² d=effect size d=M-µ/σ 2. n= (σ/σm) ² σm= σ/√n Standard error of mean for pop Ex. Z score Sm=S/√n Estimated Standard Error of the Mean for a sample. Ex. t-distribution 128

Z-Scores Calculator P Values to Z-Scores Calculator http: //www. measuringu. com/zcalcp. php Z-Scores to P Values Calculator https: //www. easycalculation. com/statistics/p-value-for-zscore. php 130

Z-scores and effect size Calculator § https: //www. youtube. com/watch? v=FAjb. L 6 n. WEw. A http: //www. measuringu. com/zcalcp. php https: //www. easycalculation. com/statistics/p-value-for-zscore. php 131

effect size calculator § To Calculate the effect size http: //www. polyu. edu. hk/mm/effectsizefaqs/calculator/calc ulator. html

G*POWER §Use G*POWER to calculate the Power § http: //www. gpower. hhu. de/en. html

Problems § 1. A population is known to have a mean of μ=60. If a researcher predicts that the experimental treatment will produce an increase in the population mean, then the null hypothesis for a one-tailed test would state. 2. A researcher administers a treatment to a sample of n=30 participants and uses a hypothesis test to evaluate the effect of the treatment. The hypothesis test produces a z-score of z = 1. 40. Assuming that the researcher is using a two-tailed test, what would be your decision with α=0. 01 and α=0. 05? 134

§ 3. The critical boundaries for a hypothesis test are Z=+1. 21 and – 1. 21. If the z-score for the sample data (calculated Z) is z =1. 11, then what is the correct statistical decision? § 4. A treatment is administered to a sample selected from a population with a mean of μ=35 and a standard deviation of σ=5. After treatment, the sample mean is M=45. Based on this information, the effect size as measured by Cohen's d is? § 5. A treatment is administered to a sample selected from a population with a mean of μ=40 and a standard deviation of σ=4. After treatment, the effect size is measured by computing Cohen's d, and a value of d=0. 40 is obtained. Based on this information the mean for the treated sample is M =? . 135
- Slides: 125