Powerful SAS Output Delivery with ODS HTML and

 1. Plain solid backgrounds")

 /* relocatable results */ body=\"Your. File. Name.")


 body=\"Demo 2. html\" (title=\"&Title\") style=Minimal; /*")


 =. . . style(data)")


 style=Minimal body ='Ignore_This_Demo 8_body. html'")


 style=Minimal body ='Ignore_This_Demo 9_body. html'")


")


, see Output Delivery System: The")

- Slides: 96
Powerful SAS® Output Delivery with ODS HTML and ODS Excel: Part 1, ODS HTML – 20 June 2018 Le. Roy Bessler Consulting and Research Visual Data Insights™ Strong Smart Systems™ Le_Roy_Bessler@wi. rr. com Copyright 2018. All rights reserved. SAS is a registered trademark or trademark of SAS Institute Inc. in the USA and other countries. ® indicates USA registration. Other product and brand names are trademarks or registered trademarks of their respective owners.
Communication-Effective Web Design The Short List (See also the paper) 1. Plain solid backgrounds that offer high contrast with text and numbers. White is always OK. 2. Colored text, numbers, & lines must be thick, colored plot point/markers and legend samples must be big. This is relevant for any graph or table, web-deployed or not. 3. For graphs, use ODS HTML. . . GTITLE GFOOTNOTE 4. Size graphs so that they require no scrolling NOTE: ODS Styles other than Minimal, have no communication value. They are decoration.
Screen Captures Google Chrome as web browser 1920 X 1080 screen resolution
Basic Syntax ods html path="Your. Path" (url=none) /* relocatable results */ body="Your. File. Name. html" style=Minimal gtitle gfootnote /* doing a graph */ ; < your code here > ods html close; /* default style in recent SAS versions is HTMLBlue */
Common Framing %let Path = C: ! ! ! ODS HTMLresults; ods results off; /* not opening result in SAS session */ ods _all_ close; < ODS HTML Code Block goes here > ods results on; /* so later processing can open results in this same SAS session, unless results turned off */
- Some code is omitted - The paper contains more code - All code available via email request
Default Web Table
Default Web Table proc summary data=sashelp. shoes nway; class region; var sales; output sum= out=work. Shoe. Sales. By. Region(drop=_type_ _freq_); run; ods html path="&Path" (url=none) body="Demo 1. html"; title 1 height=32 pt color=black 'Demo 1. . . '; title 2 height=32 pt 'Default. . . '; title 3 height=32 pt 'Its. . . '; title 4 height=32 pt 'Its. . . '; title 5 height=32 pt 'Its. . . '; proc print data=work. Shoe. Sales. By. Region noobs; run; ods html close;
Customized Web Table
Customized Web Table %let Title = Demo 2 - Customized Web Table. . . ; ods html path="&Path" (url=none) body="Demo 2. html" (title="&Title"); /* The above Title text appears in the web browser title bar */ title 1 height=32 pt font='Arial/Bold' "&Title"; title 2 height=32 pt font='Arial/Bold' color=blue 'Fonts: . . . '; proc print data=work. Shoe. Sales. By. Region noobs style(header)={font_size=32 pt font_face='Arial' font_weight=bold} style(data) ={font_size=32 pt font_face='Arial'}; run; ods html close;
The Web Browser Title Bar
Using ODS Style Minimal
Using ODS Style Minimal ods html path="&Path" (url=none) body="Demo 2. html" (title="&Title") style=Minimal; /* The benefit of ODS styles other than Minimal is decoration, not communication */
Custom Web Graph
Custom Web Graph – HTML “frame” %let Title = Demo 4 - Bar Chart Of Shoe Sales By Region; ods html path="&Path" (url=none) style=Minimal gtitle /* title(s) inside the image, not in the html source */ body="Demo 4. html" (title="&Title"); title 1 height=32 pt font='Arial/Bold' "&Title"; < graph code here > ods html close;
Custom Web Graph – Graph Preliminary proc catalog cat=work. gseg kill; run; quit; * If rerun during same session, SAS/GRAPH can reuse the graph name. For a batch run, which runs this once, this is not needed. */
Custom Web Graph – Graph Creation goptions ftext='Arial' htext=32 pt; goptions xpixels=1200 ypixels=900; /* my monitor 1920 X 1080 */ proc gchart data=sashelp. shoes; axis 1 style=0 label=none; axis 2 style=0 label=none major=none minor=none value=none; hbar Region / sumvar=Sales name='Sales. In. Each. Region' /* graph filename */ descending discrete noframe coutline=same maxis=axis 1 raxis=axis 2 width=2 space=2 sumlabel='Dollars'; run; quit; /* NOTE: Default graph filetype is PNG */
Screen Captured Web Graphs Graph mages were created with goptions xpixels=1200 ypixels=900; My monitor resolution is 1920 X 1080, so the web graph display has lots of white space at both sides.
Target Folder File Content for Web Graph Demo 4. html Sales. In. Each. Region. png
Horizontal Bar Chart Design Tip Unless a huge number of bars, e. g. , all fifty states of USA, and you want easy alphabetic lookup, order bars by size: descending if big=good ascending if small=good. In that case, maybe offer both alphabetic and by size. If web graphs, interlink them.
Summary Graph Linked to Detail Graphs
Detail Graph Linked Back To Summary
Summary Graph Links to Detail Web Pages %macro Link. Vars; %do h = 1 %to &Region. Count %by 1; if Region EQ "&&Region&h" then Link. Var = 'href="' || "Demo 5_Bar. Chart. Of&&Region. Filename&h. . . html" || '"'; %end; %mend Link. Vars; data work. Sales. Data. With. Links; length Link. Var $ 100; set work. Sales. By. Region. By. Product; %Link. Vars; run;
Summary Graph Creation Using Link. Var proc gchart data=work. Sales. Data. With. Links; hbar Region / sumvar=Sales name="Sales. By. Region" html=Link. Var < other options > ; run; quit;
Detail Graph Links to Summary Web Page title 2 height=30 pt font='Arial/Bold' color=blue underlin=2 /* underlin=1 underline would be too thin */ link="Demo 5. html" "Click here to go back to Shoes Sales By Region" ;
Summary Web Table Links to Detail Tables
Detail Web Table Linked Back To Summary
Summary Web Table Links to Detail Tables data work. Shoe. Sales. By. Region. With. Links; length Region $ 100 Region. For. Filename $ 32; ; set work. Shoe. Sales. By. Region; Region. For. Filename = translate(trim(Region), '__', ' /'); Region= '<A ' || compress('HREF="Demo 6_Table. Of' || Region. For. Filename||'. html') || '">' || trim(Region) || '</A>'; run; /* For graph links, give HREF assignment as value of HTMLVAR. For table links, imbed HTML anchor tags inside data set variable values. */
Detail Table Links to Summary Web Page title 2 height=32 pt font='Arial/Bold' color=blue underlin=1 /* underlin=1 is OK for web table links */ link="Demo 6. html" "Click here to go back to Shoes Sales By Region" ;
Two Tables in One Web Page
Scrolling Down to the Second Table
Two Tables in One Web Page proc summary data=sashelp. shoes; /* NO nway */ class region product; var sales; output sum= out=work. Sales. Summary(drop=_freq_); run; /* put two PROC PRINTs inside the code block */ ods html. . . ; title 1. . . ; proc print data=work. Sales. Summary. . . ; where _type_ EQ 2; var Region Sales; sum Sales; run; title 1. . . ; proc print data=work. Sales. Summary. . . ; where _type_ EQ 1; var Product Sales; sum Sales; run; ods html close;
Highlighting the Totals proc print data=work. Sales. Summary noobs style(header) =. . . style(data) =. . . style(grandtotal)= {font_size=32 pt font_face='Arial' font_weight=bold backgroundcolor=yellow };
ODS HTML Table of Contents for Tables
Main Panel Is Really Scrollable
Scrollable, but the Table of Contents Provides Short. Cut to any Item of Interest. Most Useful when Items are Very Many.
Close. Up of ODS HTML Table of Contents
ODS HTML Table of Contents ods html path="&Path" (url=none) style=Minimal body ='Ignore_This_Demo 8_body. html' contents='Ignore_This_Demo 8_contents. html' frame ='Click_Here_For_Demo 8. html' (title="Demo 8. . . "); /* For each table, code of this form: */ ods proclabel 'Shoe Sales. . . '; proc print data= contents='Click for Table'. . . ; run; ods html close;
ODS HTML Table of Contents for Graphs
ODS HTML Table of Contents for Graphs
ODS HTML Table of Contents ods html path="&Path" (url=none) style=Minimal body ='Ignore_This_Demo 9_body. html' contents='Ignore_This_Demo 9_contents. html' frame ='Click_Here_For_Demo 9. html' (title="Demo 9. . . "); /* For each graph, code of this form: */ ods proclabel 'Shoe Sales. . . '; proc gchart data=. . . ; hbar. . . / description='Click for Bar Chart'. . . ; run; ods html close;
ODS Table of Contents can be used for a mixture of tables and graphs
Many report users prefer a spreadsheet instead of a Web Table Results can be reformatted as they like Results can be used further as they like Using a tool that everyone has and knows See my companion paper also in the conference proceedings: Powerful SAS® Output Delivery with ODS HTML and ODS Excel: Part 2, ODS Excel
Interlinked Plot, Table, and Spreadsheet Note the Mouseover Text for Jeffrey
Mouseover Text for Jeffrey
Links to Table and Spreadsheet
Web Table With Link Back To Plot
Spreadsheet With Link Back To Plot
Creating the Table and Spreadsheet ods excel file="&PathDemo 10_Spread. Sheet. xlsx" options(sheet_name='SASHELP. CLASS Information' embedded_titles='yes' title_footnote_nobreak='yes') style=Minimal; ods html path="&Path" (url=none) style=Minimal body="Demo 10_Web. Table. html" (title="&Title"); title 1. . . ; title 2 height=30 pt justify=left font='Arial‘ color=blue underlin=1 link="Demo 10_Plot. html" "Go To Plot Of This Data"; proc print data=sashelp. class. . . ; run; ods _all_ close;
Preparing Mouseover Text for Plot data work. sashelp. Class. Data. To. Plot; length Alt. Text. Var $ 200; set sashelp. class; Alt. Text. Var = 'title="Weight in Lbs: ' || trim(left(PUT(weight, 5. 1))) || '0 D'X || 'Height in Inches: ' || trim(left (PUT(height, 4. 1))) || '0 D'X || 'Student: ' || trim(left (Name)) || '0 D'X || 'Age: ' || trim(left (PUT(Age, 2. ))) || '0 D'X || 'Sex: ' || trim(left (Sex)) || '"'; /* '0 D'X forces a line break */ run;
Creating the Plot title 1. . . ; title 2. . . ; title 3 h=31 pt color=blue underlin=2 link="Demo 10_Web. Table. html" "Go To Web Table Of This Data"; title 4 h=31 pt color=blue underlin=2 link="Demo 10_Spread. Sheet. xlsx" "Go To Spread. Sheet Of This Data"; ods html path="&Path" (url=none) style=Minimal gtitle body="Demo 10_Plot. html" (title='. . . '); proc gplot data=work. sashelp. Class. Data. To. Plot; plot weight*height / html=Alt. Text. Var . . . ; run; quit; ods html close;
Sending HTML-formatted email from SAS Even Plain Text Email from SAS supports: - address(es) for TO, CC, BCC - attachments HTML format supports imbedding in email body: - web table(s) - web graph(s) - stand-alone links
Sending HTML-formatted email from SAS 1. See the paper in the Proceedings for full code 2. For more information on SAS email, see the work of Erik Tilanus, who I call the International Post. Master General of SAS Email. E. g. , he has a 68 -page monograph Using SAS as Your Mail Room in the 2015 Wisconsin Illinois SAS Users Conference Proceedings at http: //www. wiilsu. org
Top of the Email Message
Bottom of the Email Message
Magnifying the upper left corner of email
Excerpting and magnifying hyperlinks in the email itself created with PROC ODSTEXT
For links in ODS outside of a table or graph /* specify the link with ^S={ url='. . . ' } */ ods escapechar="^"; proc odstext; p "^S={url='www. sas. com'} Go to SAS Institute Home Page"; p "^S={url='https: //support. sas. com/rnd/base/ ods/Tipsheet_List. Text. Blks. pdf'} SAS ODS List and Text Block Tip Sheet"; p "^S={url='file: ///C: /! ! ! ODS HTML/code'} Go To Folder of Code Used for This Paper"; run;
Magnifying the Graph
Magnifyied Email Header Too Fuzzy To Read Shows An Attachment Is Present
Images in next examples are not realistic, but were created expressly for exercises. They can be whatever you wish.
NOTE: When using images in web pages, they must be stored out on the world wide web, or must be on a disk accessible to anybody who will access your HTML file. If you use them to create a PDF, RTF, or Excel file with ODS, they are physically imbedded in the file.
Easy, But Unsatisfactory
Default Web Table proc print data=sashelp. class noobs style= {preimage = "&Img. Path. Image. Between. Titles. And. Table. gif" postimage = "&Img. Path. Image. Between. Table. And. Footnotes. gif"} . . . ;
Better, But More Coding
Better, But A Little More Coding proc print data=sashelp. class noobs Style = {prehtml = '<IMG src = "C: imagesImage. Between. Titles. And. Table. gif" vspace=15 >' posthtml = '<IMG vspace=15 src = "C: imagesImage. Between. Table. And. Footnotes. gif" >'}. . . ;
Now at top & bottom, but too far left
Best Example Positioning Options
Good Example Code proc template; define style Minimal. Imgs. Top. Bottom. Positioned; parent=styles. Minimal; class body / preimage ='C: imagesImage. At. Top. Of. Body. gif' prehtml ='<center>' /* center top image */ posthtml ="<img align=left hspace=570 /* shift right from left margin */ src='C: imagesImage. At. Bottom. Of. Body. gif'>"; end; run; title 1 height=16 pt ' '; /* space between top image and table because vspace does not work */ /* Space between footnote and bottom image occurs automatically. No code needed. */
Data-Dependent Images & Color-Coding Custom Text & Background Colors
Getting Fancy - Data-Dependent Images proc format; value ageimg 13 = '<IMG src = "C: imagesNew. Teen. Ager. gif" hspace=15 >' other = '<IMG src = "C: imagesAll. Other. Ages. gif" hspace=15 >'; run; /* in the PROC PRINT step */ var Age / style(header) = {. . . } style(data) = {. . . posthtml = ageimg. };
Getting Fancy – Data-Dependent Colors proc format; value $sexcolor 'F' = 'CXFFCCCC' /* very light red */ other = 'CXCCCCFF' /* very light blue */ ; run; /* in the PROC PRINT step */ var Sex / style(data) = {. . . background = $sexcolor. };
Custom Text Colors & Background Colors %let Font. Parms = font_size=32 pt font_face='Arial'; proc print data=sashelp. class noobs n style(header) = {&Font. Parms font_weight=bold} /* default for header of ALL non-ID variables */ style(data) = {&Font. Parms } /* default for data cells of ALL non-ID vars */ style(grandtotal) = { &Font. Parms font_weight=bold foreground=blue background=yellow } style(n) = { &Font. Parms font_weight=bold foreground=yellow background=blue }; id Name / style(header) = {. . . } style(data) = { &Font. Parms font_weight=bold foreground=yellow background=black vjust=center };
Getting Fancy – Unintended Consequences Displaying images inside data cells has unexpected effects on placement of text/numbers in those cells AND in cells of OTHER columns. The paper shows how to use just and vjust to adjust horizontal and vertical placement of text.
if not using NOOBS and an ID statement /* Options to use on PROC PRINT statement: */ style(obsheader) = { Whatever you like } style(obs) = { Whatever you like }
Animation - In the paper two examples use the gifanim device driver and SAS/GRAPH. - For how to do animation with ODS Graphics, do this Google search: sas animation "ods graphics" - Some hits are “Fun” but results have no real communication value. I have a bias for communication-effective data visualization.
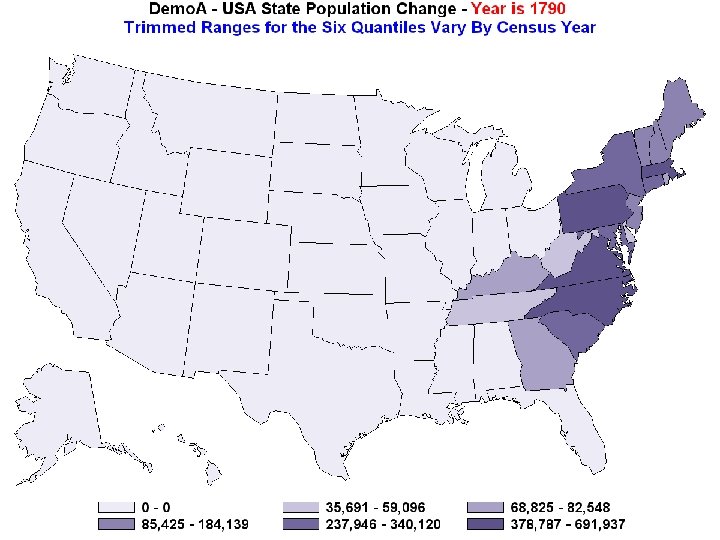
USA Population Change By State By Census Decade 1790 to 2010 plus 2017 estimates The state populations, during each decade, are assigned to ranges and states are colored according to range.
USA Population Change By State Two Range Assignment Methods, Color Palettes - SAS/GRAPH PROC GMAP default - Le. RB design/method
SAS/GRAPH PROC GMAP default Range Assignment Method, Color Palette - six quantiles as trimmed ranges vary by decade - color palette is six shades of purple
SAS/GRAPH PROC GMAP default Color Palette: six shades of purple, in a gradient - “color gradient” use popular, not best choice - It can be difficult to reliably distinguish more than five shades of the same hue
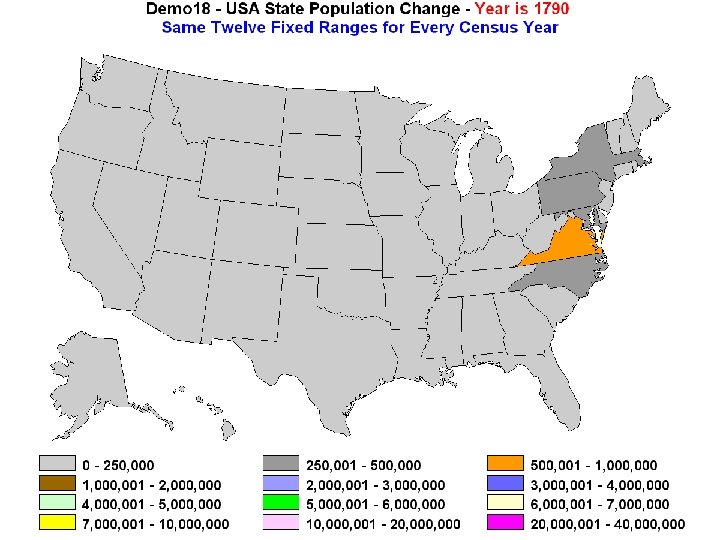
Le. RB Custom Animated Map Range Assignment Method, Color Palette - twelve fixed ranges - color palette twelve easily distinguished colors and no Red-Green color blindness possibility (such blindness not exceedingly rate, despite regrettable popularity of “traffic lighting” method of data color-coding for bad vs good)
Le. RB Custom Animated Map Color Palette - No Red-Green color blindness possibility - Such blindness not exceedingly rare - Despite regrettable popularity of “traffic lighting” method of data color-coding for bad vs good
Two Range Assignments & Color Palettes The twelve fixed ranges method has the disadvantage of less granularity during the early decades when the populations were smaller. An alternative could accept the default range assignment of six trimmed quantiles, but specify the color palette as six distinct colors, not a color gradient of one shade.
Starting Map for Default Method
Ending Map for Default Method
Next slide runs the animation
Starting Map for Le. RB Method
Ending Map for Le. RB Method
Next slide runs the animation
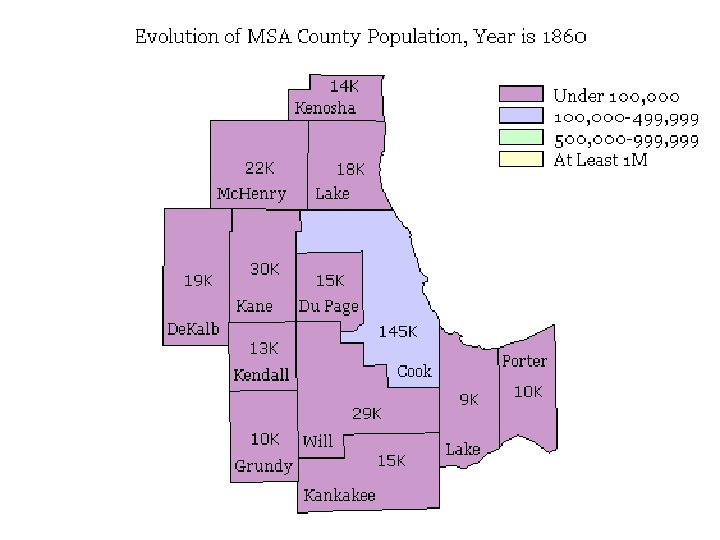
Next, run one of my favorite animations Pop. Change in Chicago Area – made 2001
Conclusion More code detail is in the paper, and any demonstration or discussion thereof not included in this presentation. You can request via email: - a zip file of ALL code - the data used for animated maps - references for static maps
For more about ODS HTML (and other ODS destinations), see Output Delivery System: The Basics and Beyond, by L. E. Haworth, C. L. Zender, and M. M. Burlew published by SAS Institute Inc. in 2009. For later information, - try a Google search - go to support. sas. com, where, among other things, you can find a link to the relevant SAS Institute Inc. documentation.
For Your Requests, Suggestions, Comments, Questions, Solutions Le. Roy Bessler Ph. D Bessler Consulting and Research Visual Data Insights™ Strong Smart Systems™ Mequon, Wisconsin, USA Le_Roy_Bessler@wi. rr. com