Power Xpert Meter 400060008000 2010 Eaton Corporation All








- Slides: 72

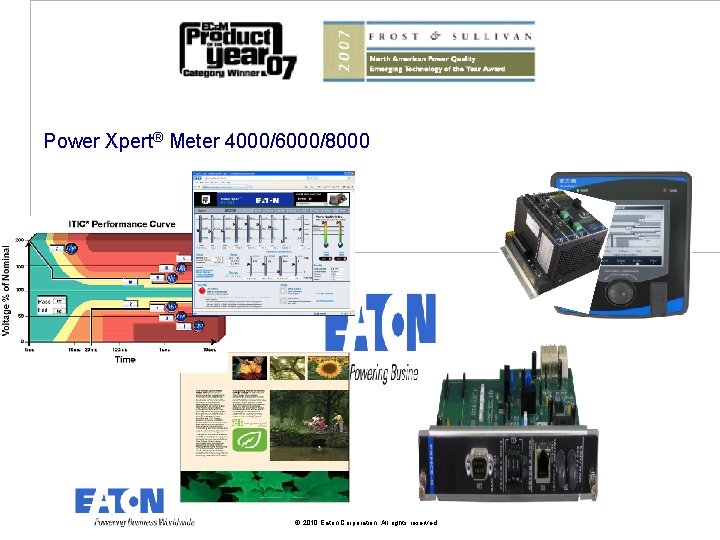
Power Xpert® Meter 4000/6000/8000 © 2010 Eaton Corporation. All rights reserved.

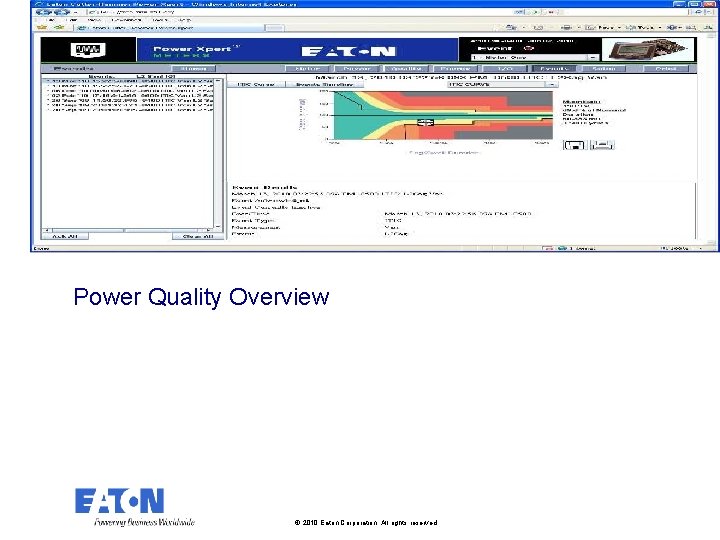
Power Quality Overview © 2010 Eaton Corporation. All rights reserved.

Power Xpert® Meter 4000/6000/8000 w ew n ith la ce p Re © 2010 Eaton Corporation. All rights reserved.

What is Power Quality “Any power problem manifested in voltage, current, or frequency deviations that results in failure or misoperation of (customer) equipment. ” Electrical Power Systems Quality – Roger C. Dugan, Mark F. Mc. Granaghan, Surya Santoso, H. Wayne Beaty 4 4

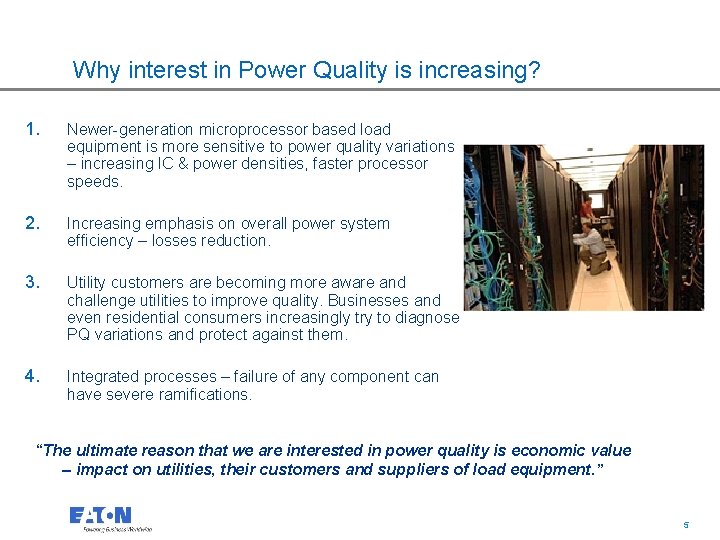
Why interest in Power Quality is increasing? 1. Newer-generation microprocessor based load equipment is more sensitive to power quality variations – increasing IC & power densities, faster processor speeds. 2. Increasing emphasis on overall power system efficiency – losses reduction. 3. Utility customers are becoming more aware and challenge utilities to improve quality. Businesses and even residential consumers increasingly try to diagnose PQ variations and protect against them. 4. Integrated processes – failure of any component can have severe ramifications. “The ultimate reason that we are interested in power quality is economic value – impact on utilities, their customers and suppliers of load equipment. ” 5 5

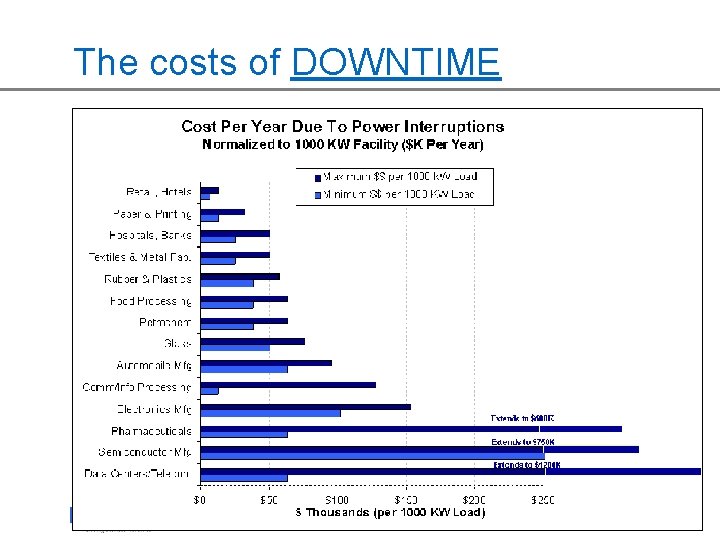
The costs of DOWNTIME 6 6

Typical PQ Problems 7 7

BUT………………. How does one diagnose these PQ problems? “If you cannot measure it, you cannot manage it!” 8 8

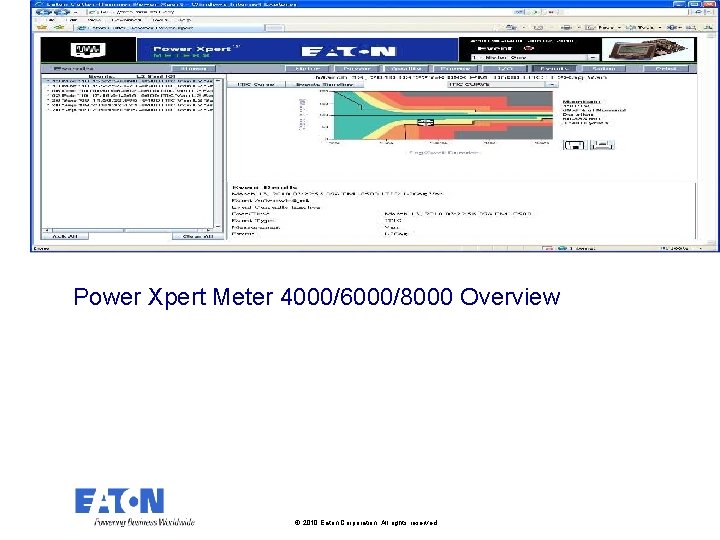
Power Xpert Meter 4000/6000/8000 Overview © 2010 Eaton Corporation. All rights reserved.

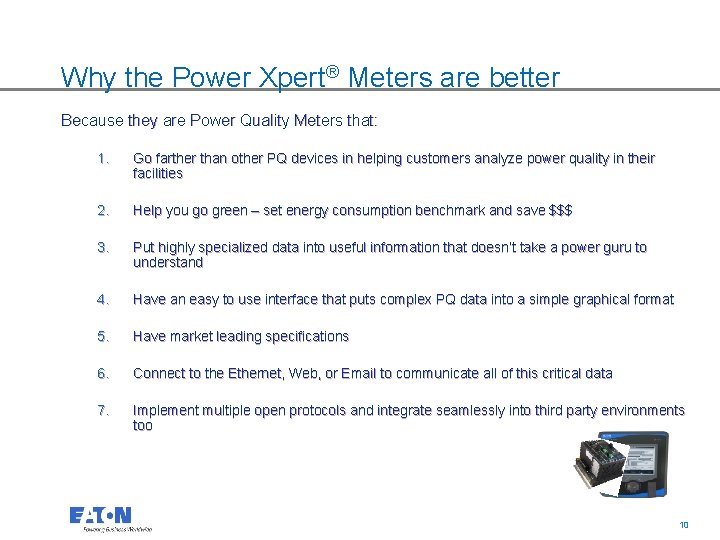
Why the Power Xpert® Meters are better Because they are Power Quality Meters that: 1. Go farther than other PQ devices in helping customers analyze power quality in their facilities 2. Help you go green – set energy consumption benchmark and save $$$ 3. Put highly specialized data into useful information that doesn’t take a power guru to understand 4. Have an easy to use interface that puts complex PQ data into a simple graphical format 5. Have market leading specifications 6. Connect to the Ethernet, Web, or Email to communicate all of this critical data 7. Implement multiple open protocols and integrate seamlessly into third party environments too 10 10

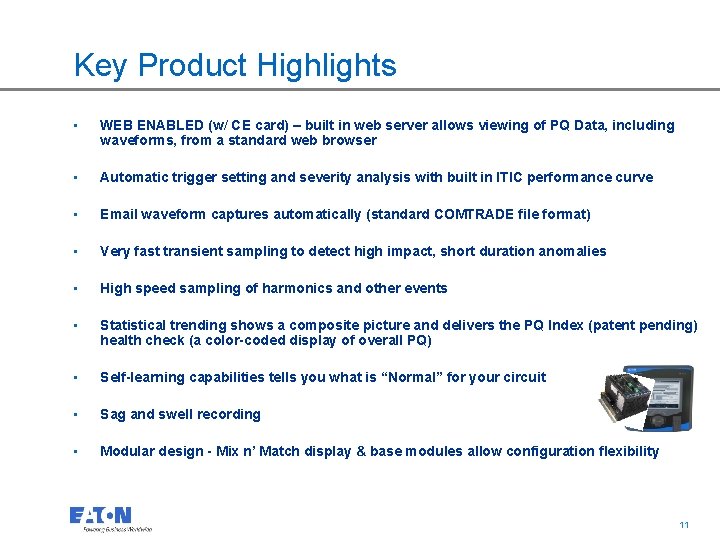
Key Product Highlights • WEB ENABLED (w/ CE card) – built in web server allows viewing of PQ Data, including waveforms, from a standard web browser • Automatic trigger setting and severity analysis with built in ITIC performance curve • Email waveform captures automatically (standard COMTRADE file format) • Very fast transient sampling to detect high impact, short duration anomalies • High speed sampling of harmonics and other events • Statistical trending shows a composite picture and delivers the PQ Index (patent pending) health check (a color-coded display of overall PQ) • Self-learning capabilities tells you what is “Normal” for your circuit • Sag and swell recording • Modular design - Mix n’ Match display & base modules allow configuration flexibility 11 11

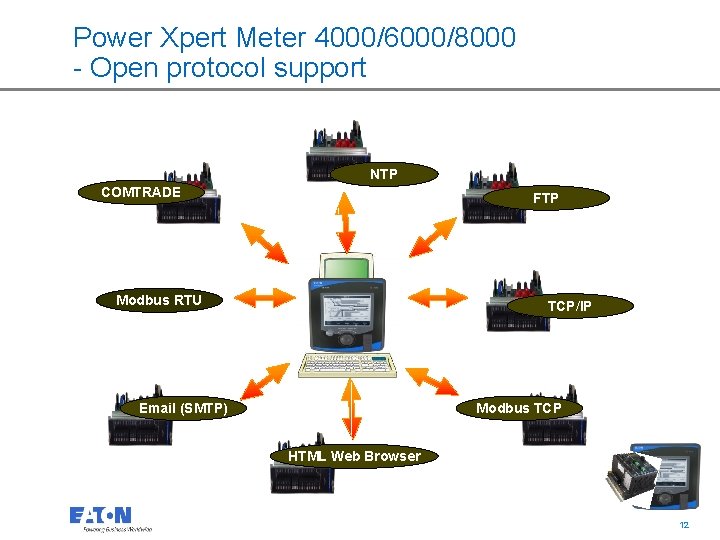
Power Xpert Meter 4000/6000/8000 - Open protocol support NTP COMTRADE FTP Modbus RTU TCP/IP Email (SMTP) Modbus TCP HTML Web Browser 12 12

Key Applications • Manage Energy Utilization – Cost reduction • Reduce peak demand charges and power factor penalties • Identify excessive energy consumption • Monitor Circuit Loading • Avoid overloads and nuisance tripping to prevent downtime • Maximize equipment utilization for operational efficiency • Manage emergency overloads • ID critical power quality problems that can • • • Damage motors Interrupt critical processes Overheat transformers and conductors Blow capacitor bank fuses Detect and record high speed transients • Avoid equipment damage and prevent downtime • ID equipment malfunction to assist in troubleshooting 13 13

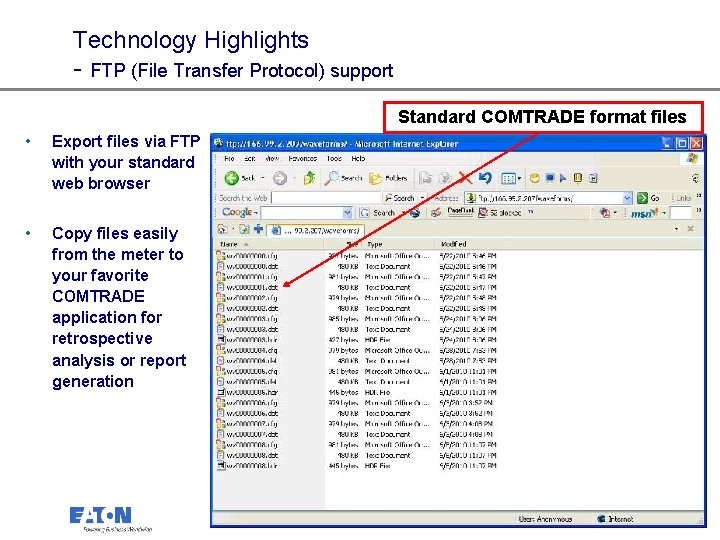
Technology Highlights - FTP (File Transfer Protocol) support Standard COMTRADE format files • Export files via FTP with your standard web browser • Copy files easily from the meter to your favorite COMTRADE application for retrospective analysis or report generation 14 14

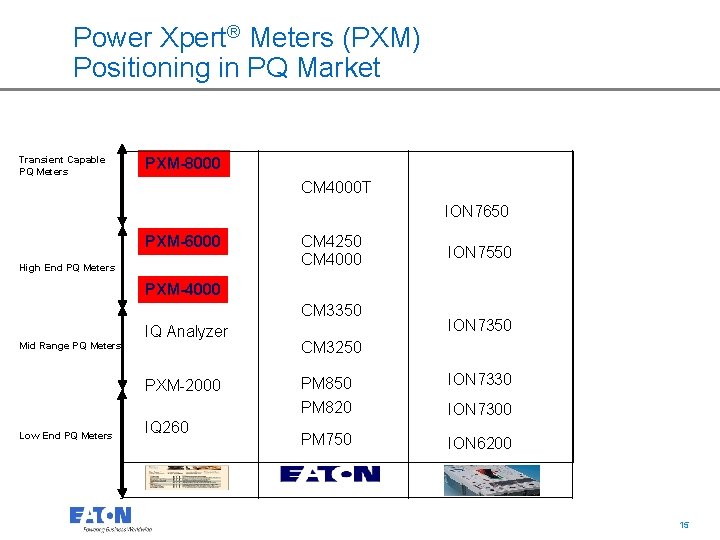
Power Xpert® Meters (PXM) Positioning in PQ Market Transient Capable PQ Meters PXM-8000 CM 4000 T ION 7650 PXM-6000 High End PQ Meters CM 4250 CM 4000 ION 7550 PXM-4000 CM 3350 Mid Range PQ Meters IQ Analyzer PXM-2000 Low End PQ Meters IQ 260 ION 7350 CM 3250 PM 820 ION 7330 PM 750 ION 6200 ION 7300 15 15

“Superior features over Sq. D and how to take advantage of them!” © 2010 Eaton Corporation. All rights reserved. Company Confidential

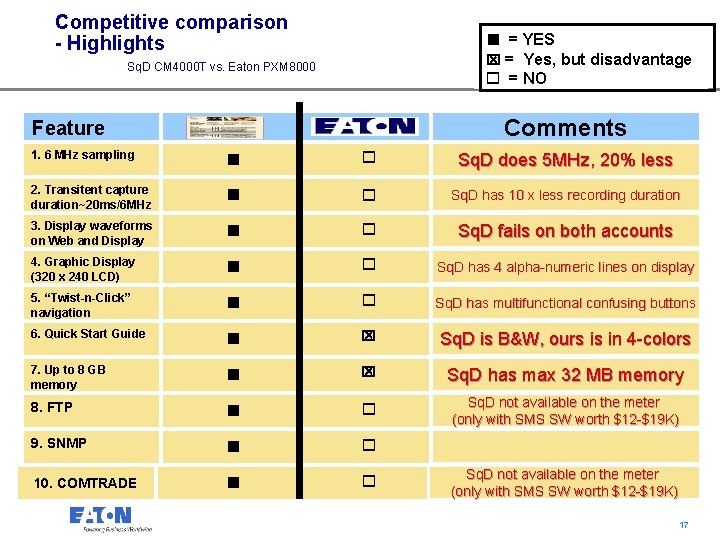
Competitive comparison - Highlights n = YES x = Yes, but disadvantage Sq. D CM 4000 T vs. Eaton PXM 8000 o = NO Comments Feature 1. 6 MHz sampling n o Sq. D does 5 MHz, 20% less 2. Transitent capture duration~20 ms/6 MHz n o Sq. D has 10 x less recording duration 3. Display waveforms on Web and Display n o Sq. D fails on both accounts 4. Graphic Display (320 x 240 LCD) n o Sq. D has 4 alpha-numeric lines on display 5. “Twist-n-Click” navigation n o Sq. D has multifunctional confusing buttons 6. Quick Start Guide n x Sq. D is B&W, ours is in 4 -colors 7. Up to 8 GB memory n x Sq. D has max 32 MB memory 8. FTP n o Sq. D not available on the meter (only with SMS SW worth $12 -$19 K) 9. SNMP n o 10. COMTRADE n o Sq. D not available on the meter (only with SMS SW worth $12 -$19 K) 17 17

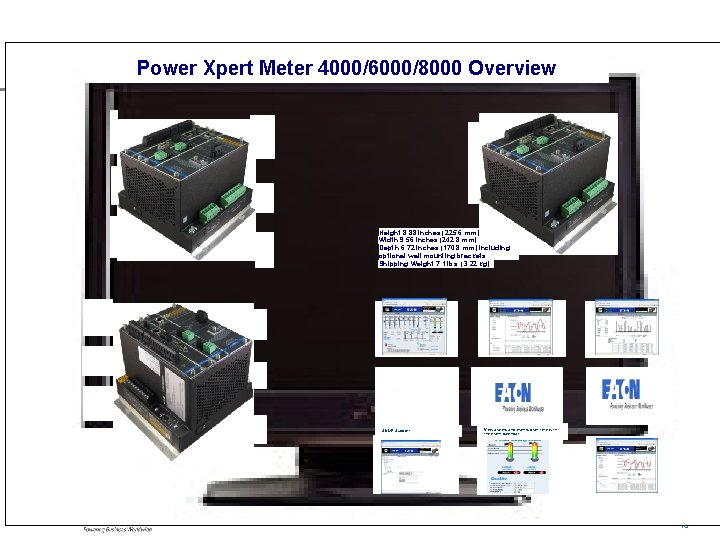
Power Xpert Meter 4000/6000/8000 Overview COMTRADE file format Height 8. 88 inches (225. 6 mm) Width 9. 56 inches (242. 8 mm) Depth 6. 72 inches (170. 8 mm) including optional wall mounting brackets Shipping Weight 7. 1 lbs. (3. 22 kg) SNMP Support View alarms and events over time with the event calendar. 18 18

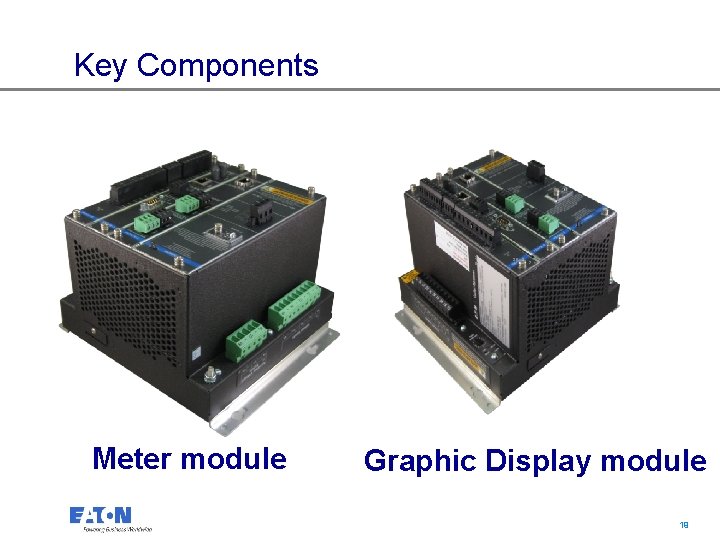
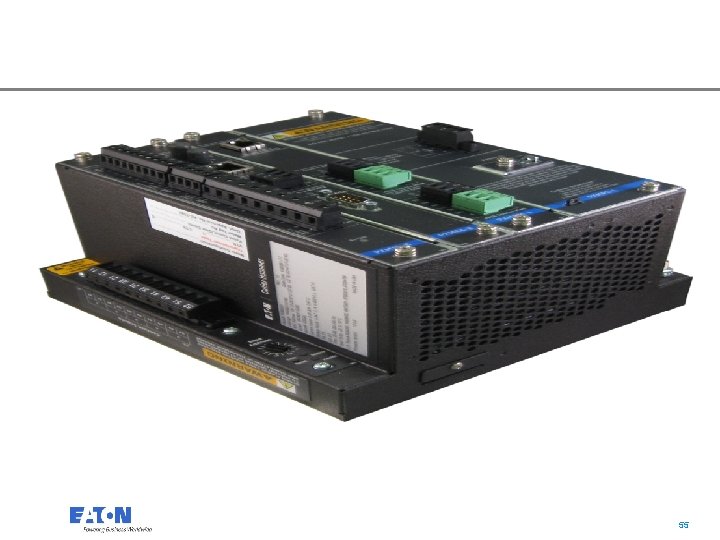
Key Components 1 3 6 30 2 2 1 Meter module Graphic Display module 19 19

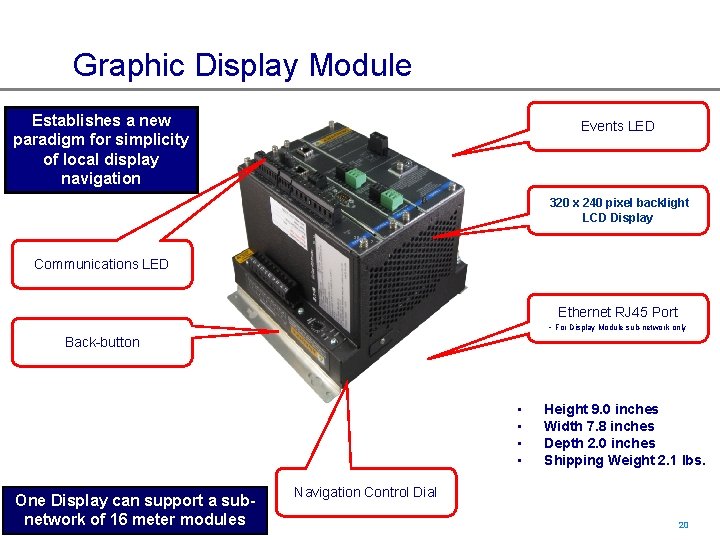
Graphic Display Module Establishes a new paradigm for simplicity of local display navigation Events LED 320 x 240 pixel backlight LCD Display 1 3 6 30 2 2 Communications LED 1 Ethernet RJ 45 Port - For Display Module sub-network only Back-button • • One Display can support a subnetwork of 16 meter modules Height 9. 0 inches Width 7. 8 inches Depth 2. 0 inches Shipping Weight 2. 1 lbs. Navigation Control Dial 20 20

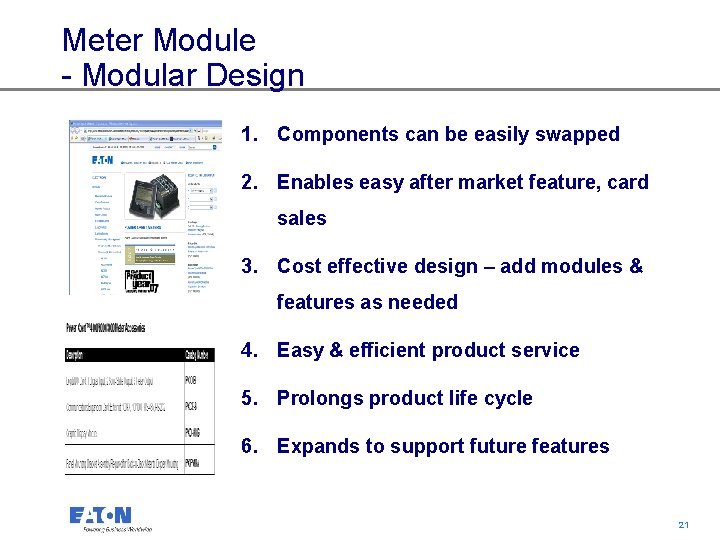
Meter Module - Modular Design 1. Components can be easily swapped 2. Enables easy after market feature, card sales 3. Cost effective design – add modules & features as needed 4. Easy & efficient product service 5. Prolongs product life cycle 6. Expands to support future features 21 21

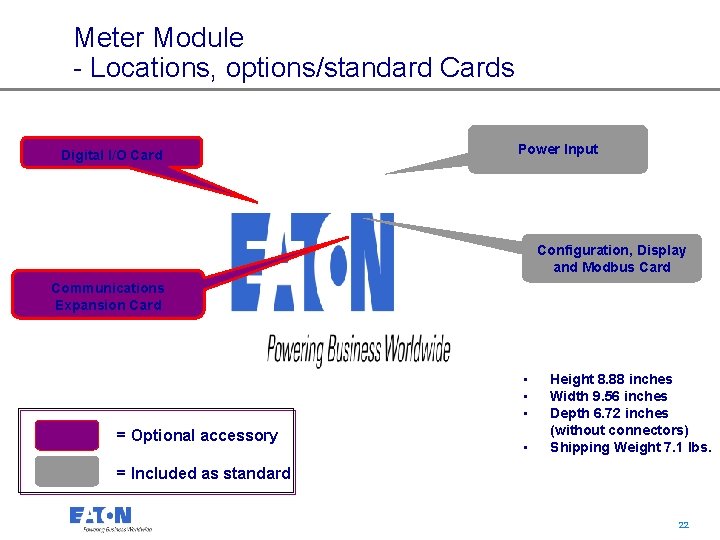
Meter Module - Locations, options/standard Cards Digital I/O Card Power Input Configuration, Display and Modbus Card Communications Expansion Card • • • = Optional accessory • Height 8. 88 inches Width 9. 56 inches Depth 6. 72 inches (without connectors) Shipping Weight 7. 1 lbs. = Included as standard 22 22

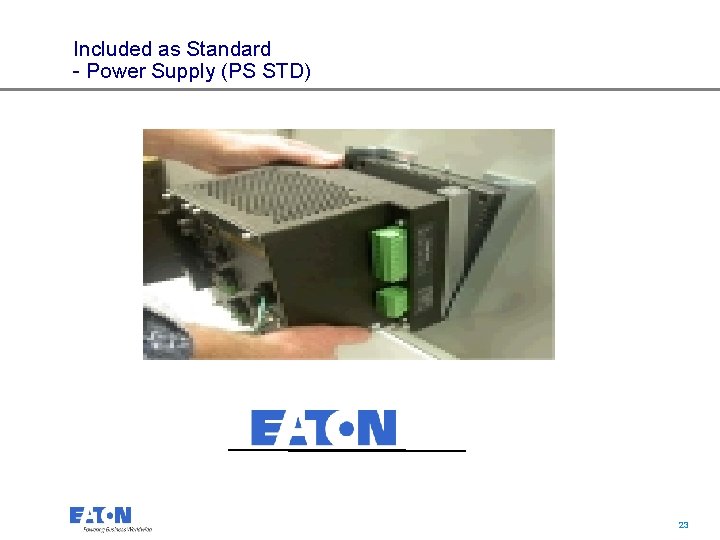
Included as Standard - Power Supply (PS STD) 23 23

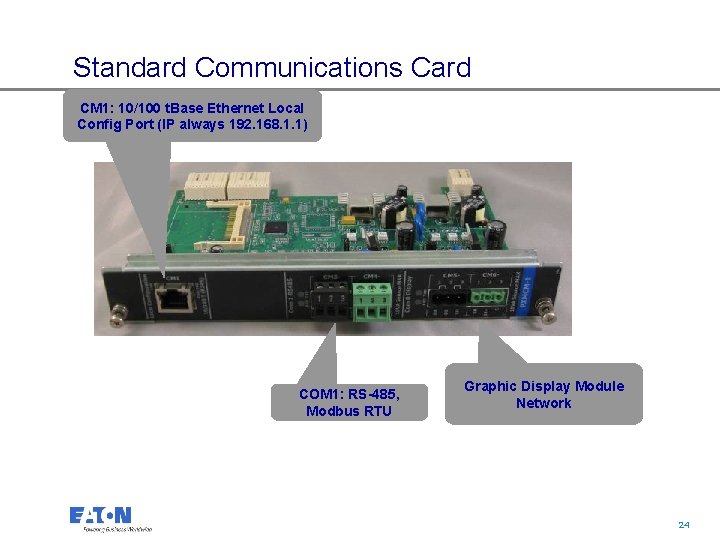
Standard Communications Card CM 1: 10/100 t. Base Ethernet Local Config Port (IP always 192. 168. 1. 1) COM 1: RS-485, Modbus RTU Graphic Display Module Network 24 24

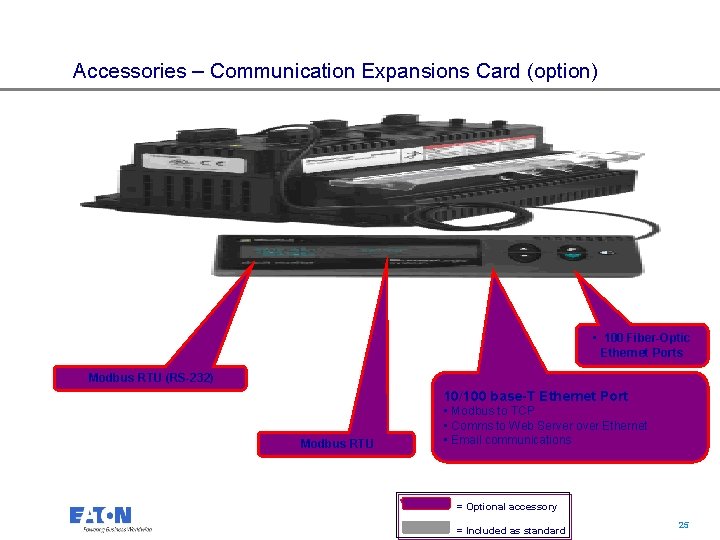
Accessories – Communication Expansions Card (option) • 100 Fiber-Optic Ethernet Ports Modbus RTU (RS-232) 10/100 base-T Ethernet Port Modbus RTU • Modbus to TCP • Comms to Web Server over Ethernet • Email communications = Optional accessory 25 = Included as standard 25

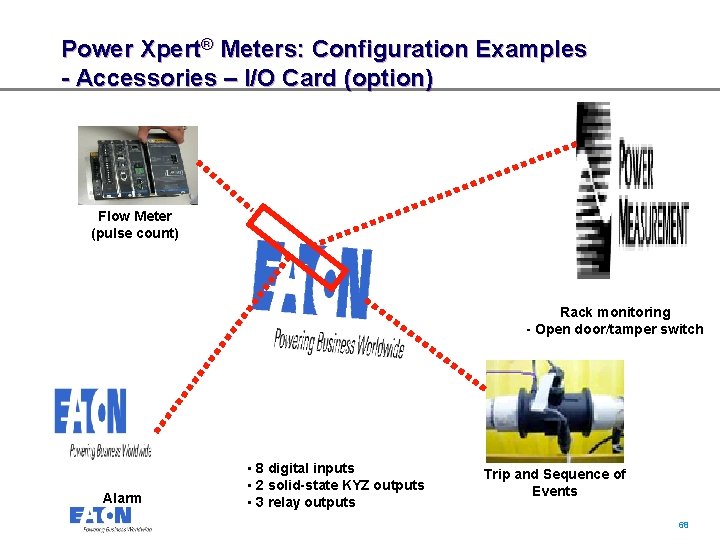
Accessories – I/O Card (option) Digital I/O Card • 8 Digital Inputs • 2 Solid State Outputs • 3 Relay Outputs 26 26

Power Xpert Meter 4000/6000/8000 Web views © 2010 Eaton Corporation. All rights reserved.

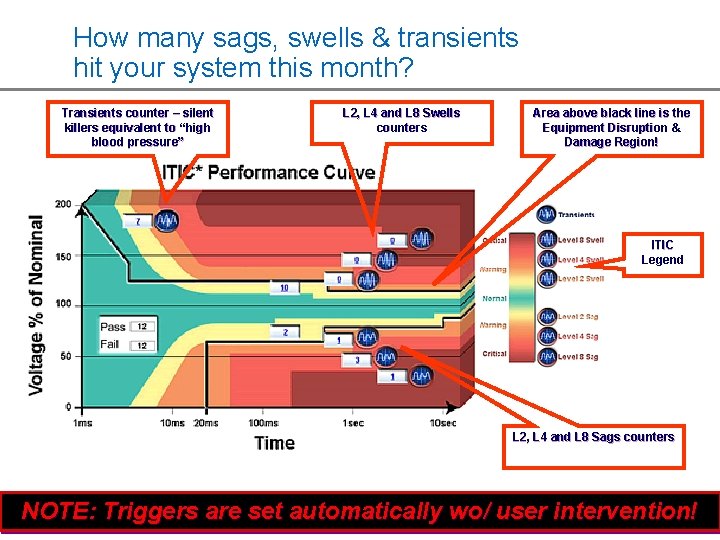
How many sags, swells & transients hit your system this month? Just surf to a Power Xpert Meter and check the ITIC performance curve counters What is ITIC? (2000 -) • Information Technology Industry Council • Developed in collaboration with EPRI's Power Electronics Application Center (PEAC) • More accurately reflects the performance of IT equipment • ITIC curve is generally applicable to other equipment containing solid-state devices 28 28

How many sags, swells & transients hit your system this month? Transients counter – silent killers equivalent to “high blood pressure” L 2, L 4 and L 8 Swells counters Area above black line is the Equipment Disruption & Damage Region! ITIC Legend L 2, L 4 and L 8 Sags counters NOTE: Triggers are set automatically wo/ user 29 intervention! 29

ITIC-view is now available for a single event - Eaton exclusive Pinpoint cross-haired single event on the ITIC performance curve View magnitude and duration on the same screen with the ITIC!!! 30 30

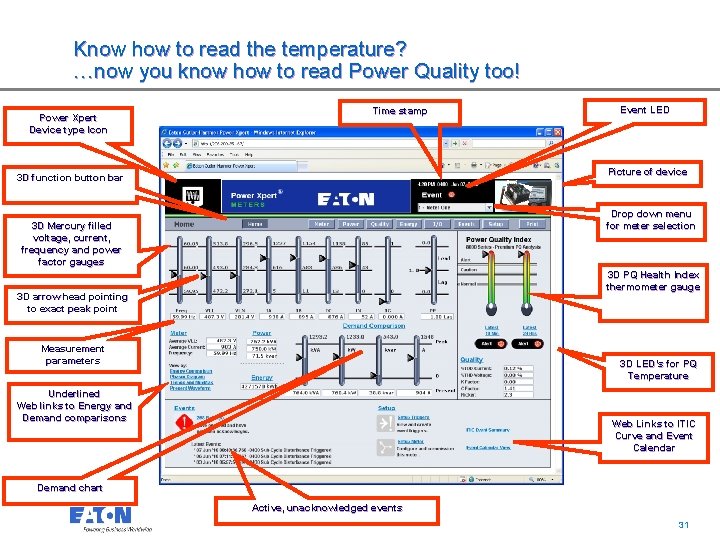
Know how to read the temperature? …now you know how to read Power Quality too! Power Xpert Device type Icon Event LED Time stamp Picture of device 3 D function button bar Drop down menu for meter selection 3 D Mercury filled voltage, current, frequency and power factor gauges 3 D PQ Health Index thermometer gauge 3 D arrow head pointing to exact peak point Measurement parameters 3 D LED’s for PQ Temperature Underlined Web links to Energy and Demand comparisons Web Links to ITIC Curve and Event Calendar Demand chart Active, unacknowledged events 31 31

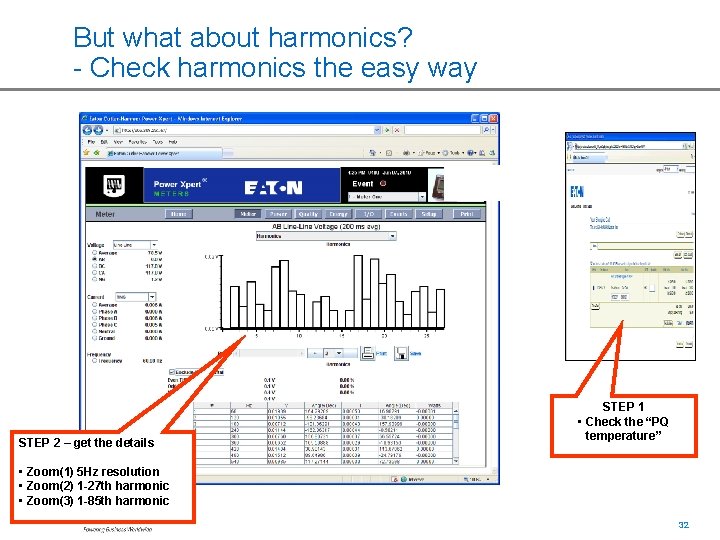
But what about harmonics? - Check harmonics the easy way STEP 1 • Check the “PQ temperature” STEP 2 – get the details • Zoom(1) 5 Hz resolution • Zoom(2) 1 -27 th harmonic • Zoom(3) 1 -85 th harmonic 32 32

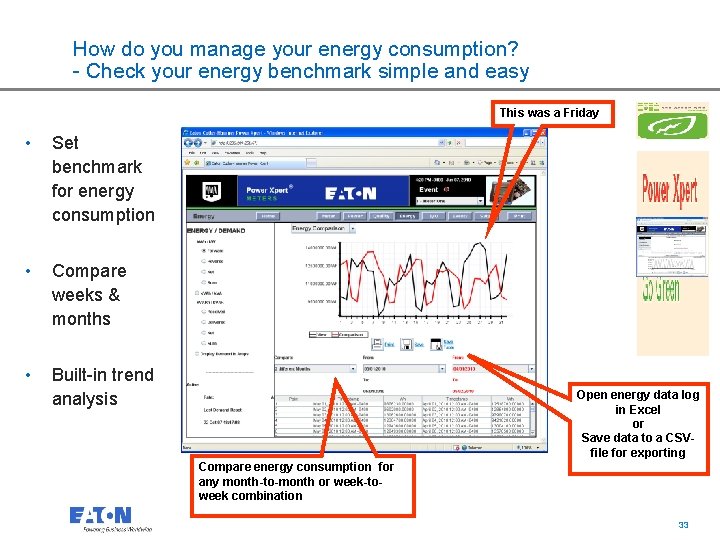
How do you manage your energy consumption? - Check your energy benchmark simple and easy This was a Friday • Set benchmark for energy consumption • Compare weeks & months • Built-in trend analysis Open energy data log in Excel or Save data to a CSVfile for exporting Compare energy consumption for any month-to-month or week-toweek combination 33 33

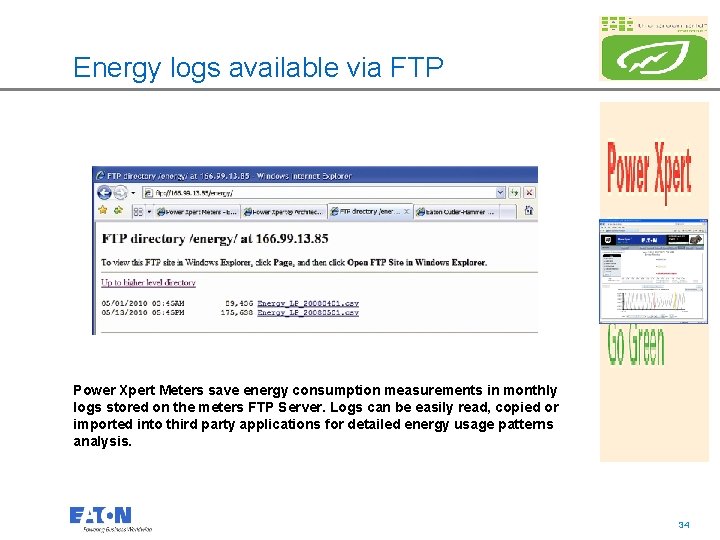
Energy logs available via FTP Power Xpert Meters save energy consumption measurements in monthly logs stored on the meters FTP Server. Logs can be easily read, copied or imported into third party applications for detailed energy usage patterns analysis. 34 34

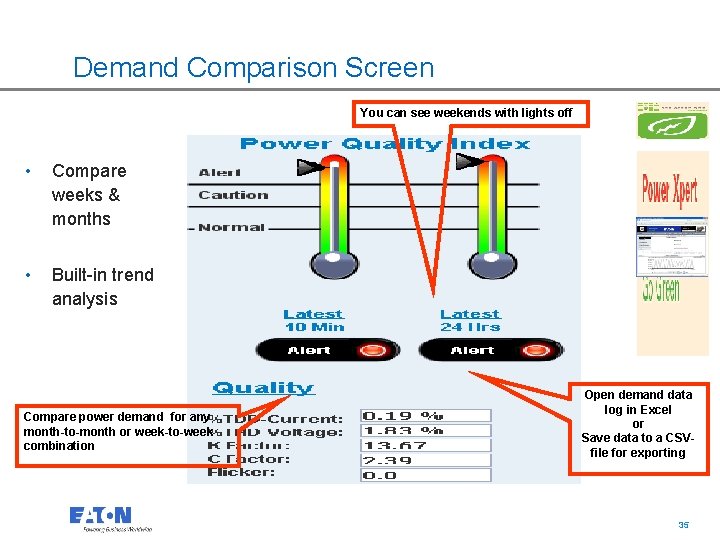
Demand Comparison Screen You can see weekends with lights off • Compare weeks & months • Built-in trend analysis Open demand data log in Excel or Save data to a CSVfile for exporting Compare power demand for any month-to-month or week-to-week combination 35 35

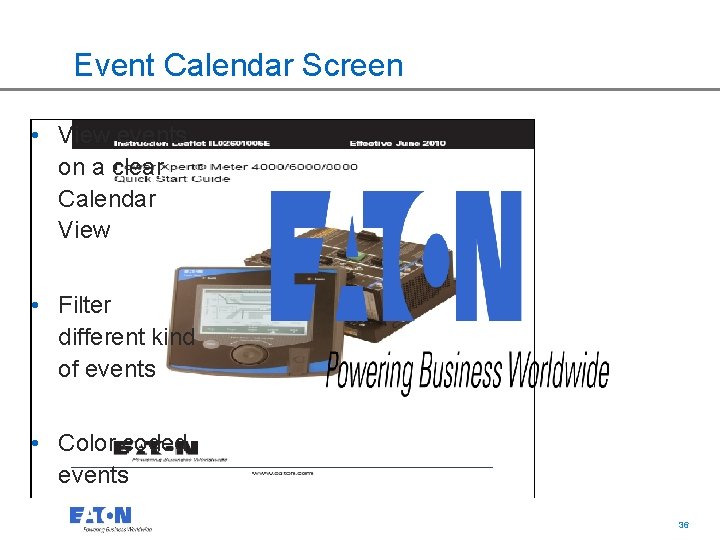
Event Calendar Screen • View events on a clear Calendar View • Filter different kind of events • Color coded events 36 36

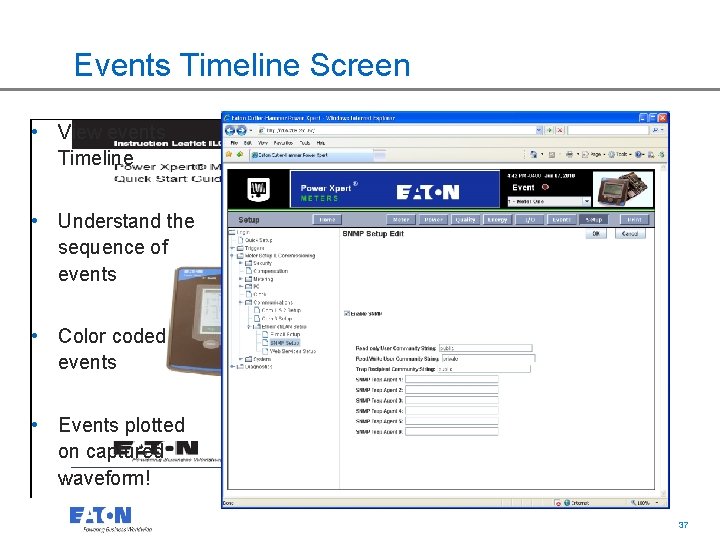
Events Timeline Screen • View events Timeline • Understand the sequence of events • Color coded events • Events plotted on captured waveform! 37 37

Full featured SNMP support • MIB Support • MIB-II • Entity MIB • Entity State MIB • Power Chain Device MIB • Meter MIB 38 38

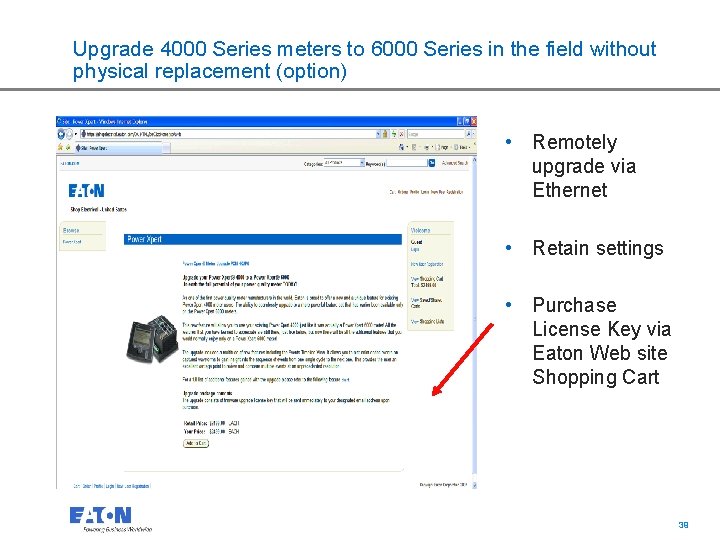
Upgrade 4000 Series meters to 6000 Series in the field without physical replacement (option) • Remotely upgrade via Ethernet • Retain settings • Purchase License Key via Eaton Web site Shopping Cart 39 39

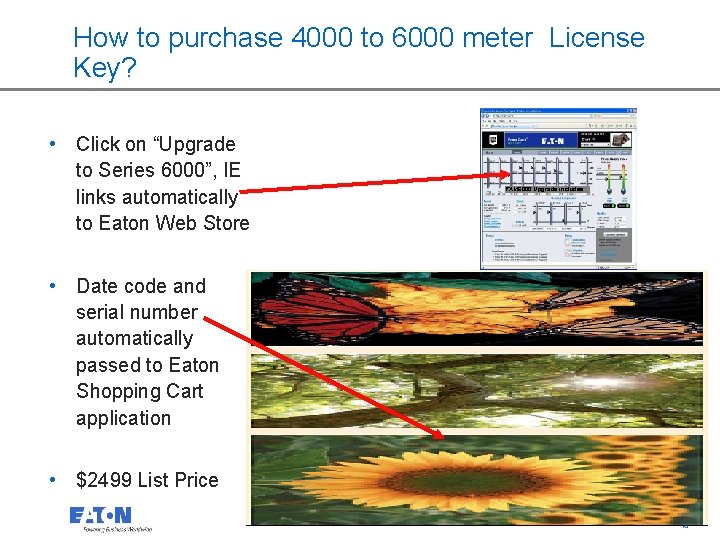
How to purchase 4000 to 6000 meter License Key? • Click on “Upgrade to Series 6000”, IE links automatically to Eaton Web Store PXM 6000 Upgrade includes: • Date code and serial number automatically passed to Eaton Shopping Cart application • $2499 List Price 40 40

Add License Key to shopping cart and receive key via email immediately 41 41

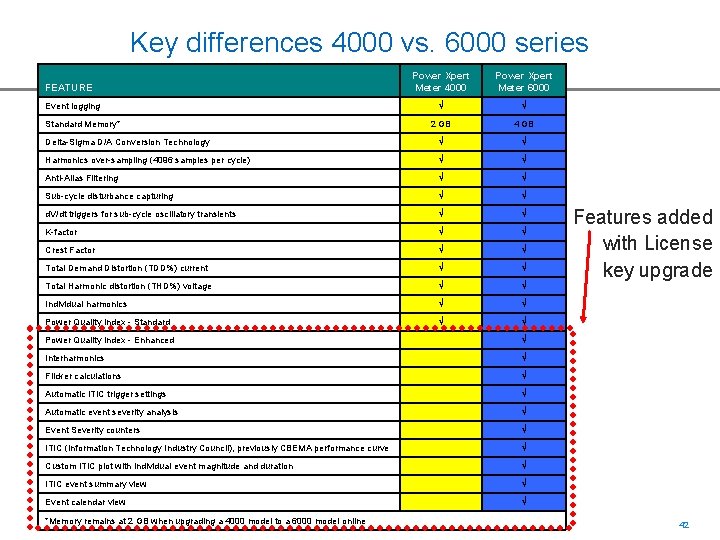
Key differences 4000 vs. 6000 series Power Xpert Meter 4000 Power Xpert Meter 6000 Ö Ö 2 GB 4 GB Delta-Sigma D/A Conversion Technology Ö Ö Harmonics over-sampling (4096 samples per cycle) Ö Ö Anti-Alias Filtering Ö Ö Sub-cycle disturbance capturing Ö Ö d. V/dt triggers for sub-cycle oscillatory transients Ö Ö K-factor Ö Ö Crest Factor Ö Ö Total Demand Distortion (TDD%) current Ö Ö Total Harmonic distortion (THD%) voltage Ö Ö Individual harmonics Ö Ö Power Quality Index - Standard Ö Ö FEATURE Event logging Standard Memory* Power Quality Index - Enhanced Ö Interharmonics Ö Flicker calculations Ö Automatic ITIC trigger settings Ö Automatic event severity analysis Ö Event Severity counters Ö ITIC (Information Technology Industry Council), previously CBEMA performance curve Ö Custom ITIC plot with individual event magnitude and duration Ö ITIC event summary view Ö Event calendar view Ö *Memory remains at 2 GB when upgrading a 4000 model to a 6000 model online Features added with License key upgrade 42 42

Power Xpert Meter 4000/6000/8000 Technology Highlights © 2010 Eaton Corporation. All rights reserved.

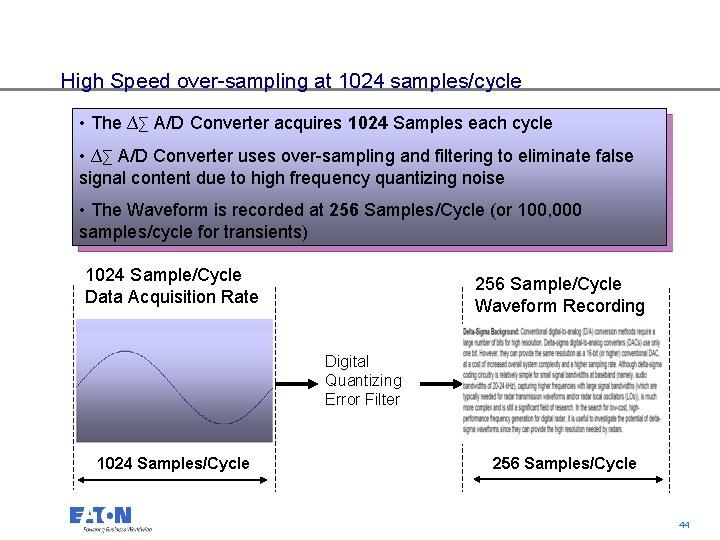
High Speed over-sampling at 1024 samples/cycle • The ∆∑ A/D Converter acquires 1024 Samples each cycle • ∆∑ A/D Converter uses over-sampling and filtering to eliminate false signal content due to high frequency quantizing noise • The Waveform is recorded at 256 Samples/Cycle (or 100, 000 samples/cycle for transients) 1024 Sample/Cycle Data Acquisition Rate 256 Sample/Cycle Waveform Recording Digital Quantizing Error Filter 1024 Samples/Cycle 256 Samples/Cycle 44 44

Anti-Aliasing built-in all Power Xpert Meters 45 45

Delta-Sigma Background 46 46

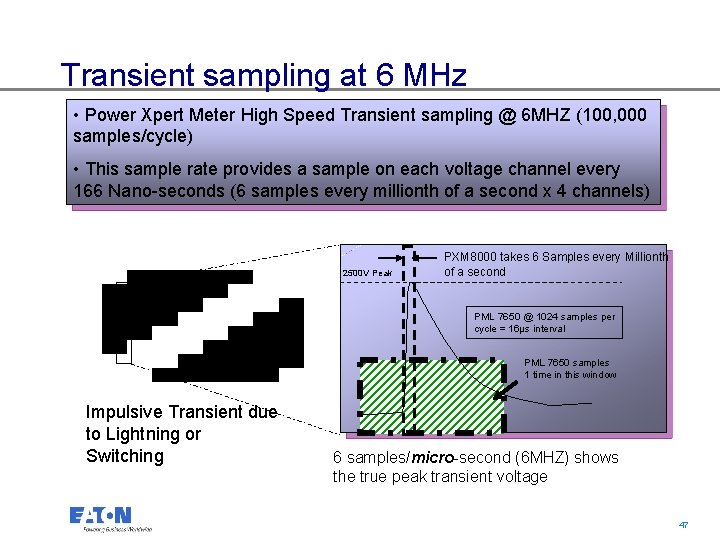
Transient sampling at 6 MHz • Power Xpert Meter High Speed Transient sampling @ 6 MHZ (100, 000 samples/cycle) • This sample rate provides a sample on each voltage channel every 166 Nano-seconds (6 samples every millionth of a second x 4 channels) 2500 V Peak PXM 8000 takes 6 Samples every Millionth of a second PML 7650 @ 1024 samples per cycle = 16μs interval 480 V RMS PML 7650 samples 1 time in this window Impulsive Transient due to Lightning or Switching 6 samples/micro-second (6 MHZ) shows the true peak transient voltage 47 47

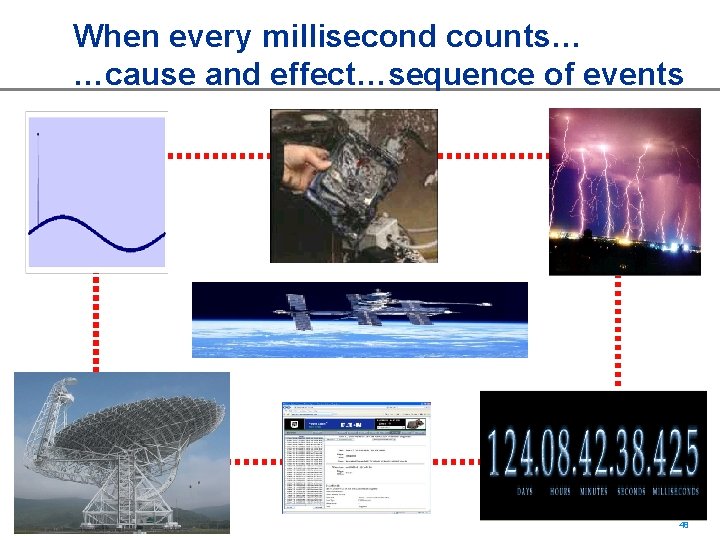
When every millisecond counts… …cause and effect…sequence of events 48 48

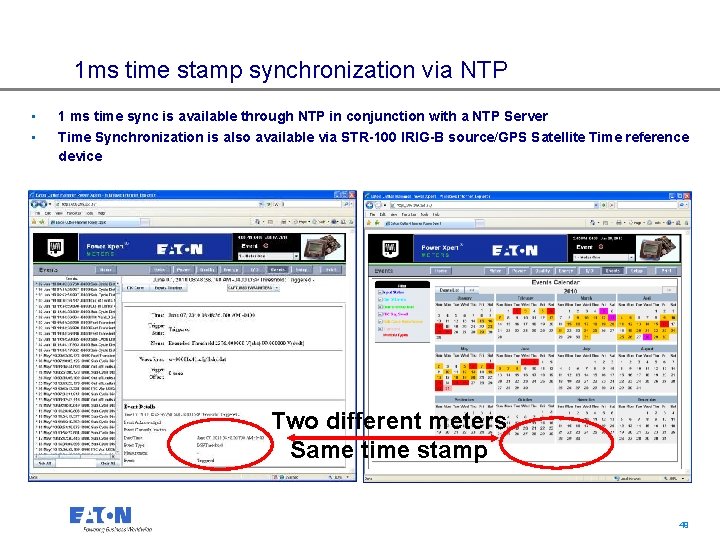
1 ms time stamp synchronization via NTP • 1 ms time sync is available through NTP in conjunction with a NTP Server • Time Synchronization is also available via STR-100 IRIG-B source/GPS Satellite Time reference device Two different meters Same time stamp 49 49

Power Xpert Meter 4000/6000/8000 Features & Benefits © 2010 Eaton Corporation. All rights reserved.

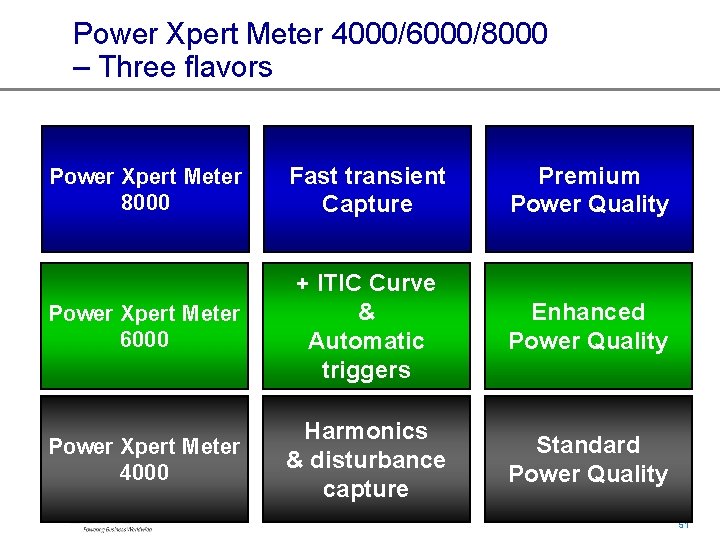
Power Xpert Meter 4000/6000/8000 – Three flavors Power Xpert Meter 8000 Fast transient Capture Premium Power Quality Power Xpert Meter 6000 + ITIC Curve & Automatic triggers Enhanced Power Quality Power Xpert Meter 4000 Harmonics & disturbance capture Standard Power Quality 51 51

Feature Highlights 52 52

53 53

54 54

55 55

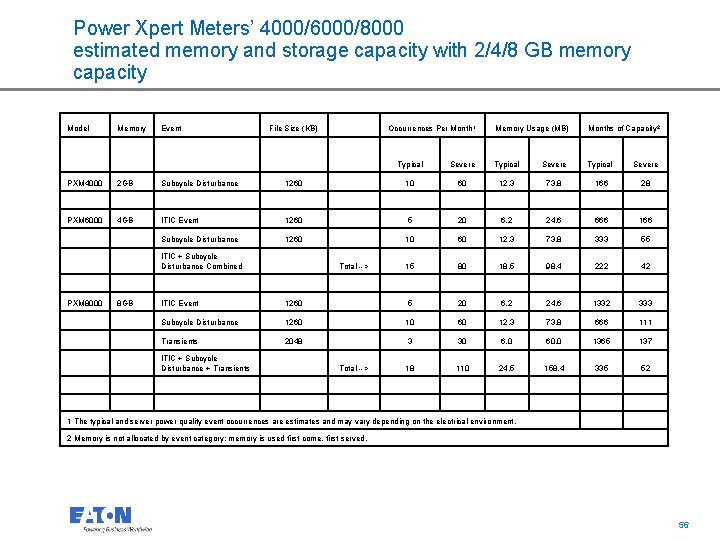
Power Xpert Meters’ 4000/6000/8000 estimated memory and storage capacity with 2/4/8 GB memory capacity Model Memory Event File Size (KB) Occurrences Per Month 1 Memory Usage (MB) Months of Capacity 2 Typical Severe PXM 4000 2 GB Subcycle Disturbance 1260 10 60 12. 3 73. 8 166 28 PXM 6000 4 GB ITIC Event 1260 5 20 6. 2 24. 6 666 166 Subcycle Disturbance 1260 10 60 12. 3 73. 8 333 55 15 80 18. 5 98. 4 222 42 ITIC + Subcycle Disturbance Combined PXM 8000 8 GB Total --> ITIC Event 1260 5 20 6. 2 24. 6 1332 333 Subcycle Disturbance 1260 10 60 12. 3 73. 8 666 111 Transients 2048 3 30 6. 0 60. 0 1365 137 18 110 24. 5 158. 4 335 52 ITIC + Subcycle Disturbance + Transients Total --> 1 The typical and server power quality event occurrences are estimates and may vary depending on the electrical environment. 2 Memory is not allocated by event category; memory is used first come, first served. 56 56

Power Xpert Meter 4000/6000/8000 What you get © 2010 Eaton Corporation. All rights reserved.

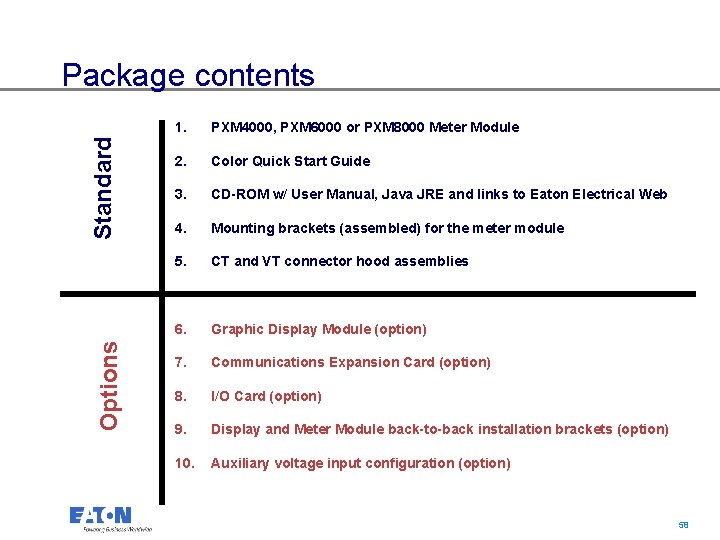
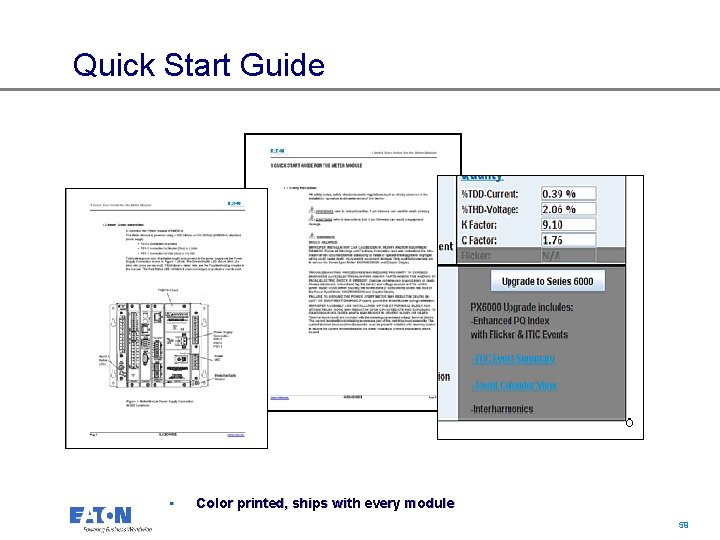
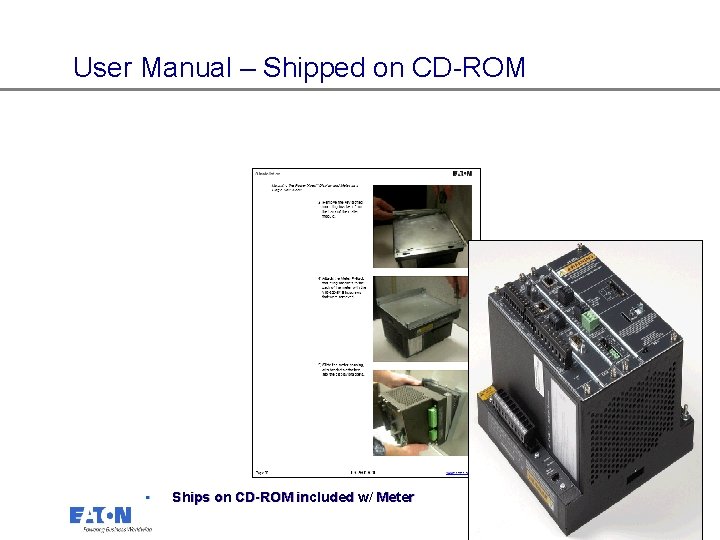
Options Standard Package contents 1. PXM 4000, PXM 6000 or PXM 8000 Meter Module 2. Color Quick Start Guide 3. CD-ROM w/ User Manual, Java JRE and links to Eaton Electrical Web 4. Mounting brackets (assembled) for the meter module 5. CT and VT connector hood assemblies 6. Graphic Display Module (option) 7. Communications Expansion Card (option) 8. I/O Card (option) 9. Display and Meter Module back-to-back installation brackets (option) 10. Auxiliary voltage input configuration (option) 58 58

Quick Start Guide • Color printed, ships with every module 59 59

User Manual – Shipped on CD-ROM • Ships on CD-ROM included w/ Meter 60 60

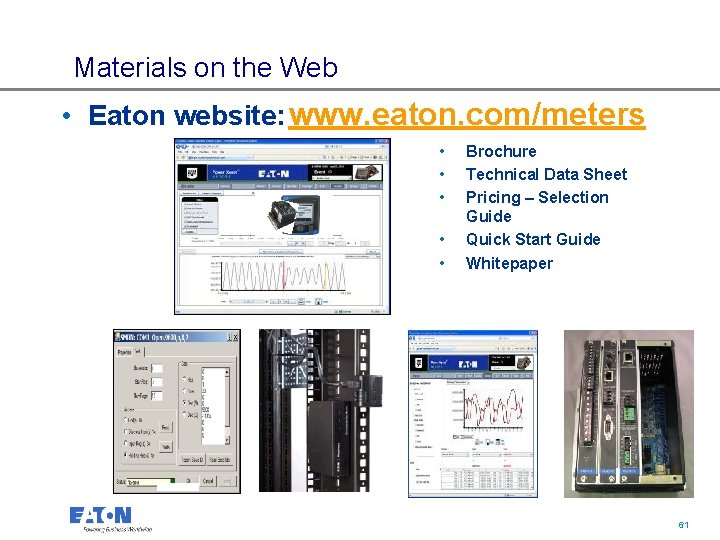
Materials on the Web • Eaton website: www. eaton. com/meters • • • Brochure Technical Data Sheet Pricing – Selection Guide Quick Start Guide Whitepaper 61 61

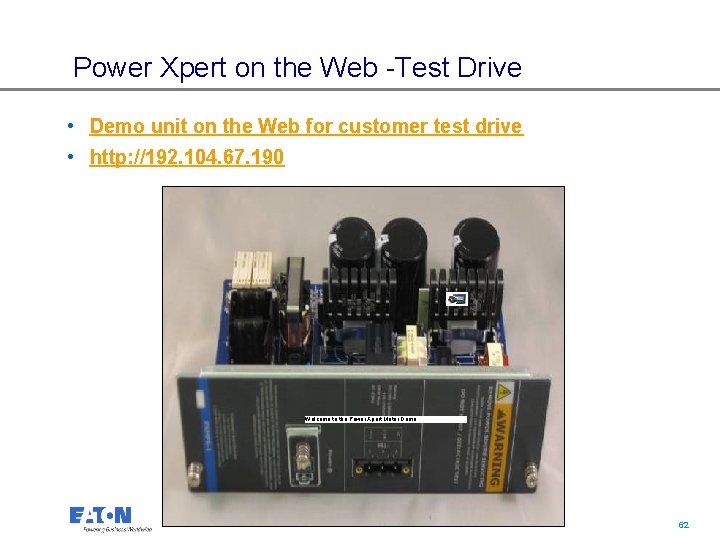
Power Xpert on the Web -Test Drive • Demo unit on the Web for customer test drive • http: //192. 104. 67. 190 Welcome to the Power Xpert Meter Demo 62 62

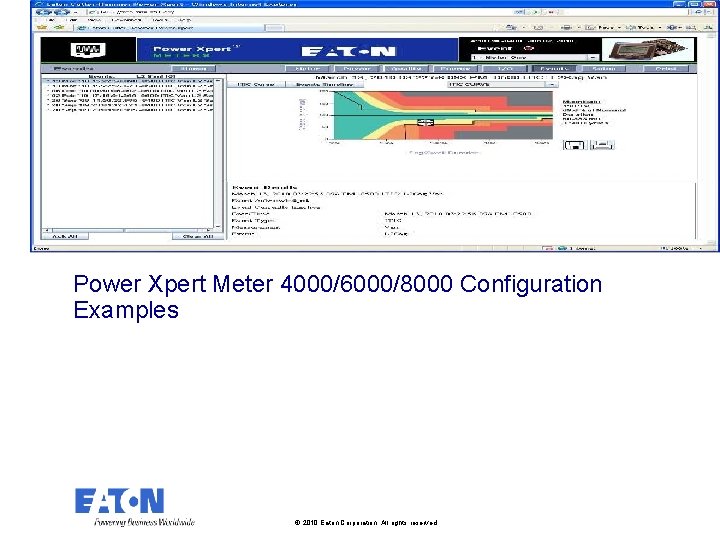
Power Xpert Meter 4000/6000/8000 Configuration Examples © 2010 Eaton Corporation. All rights reserved.

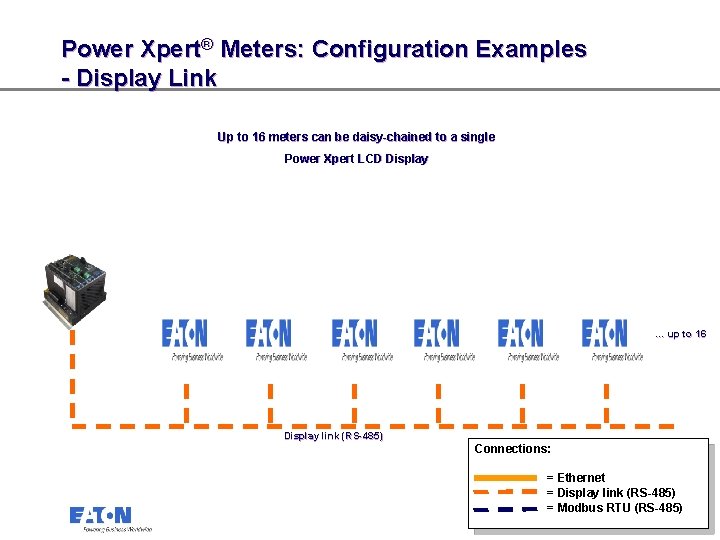
Power Xpert® Meters: Configuration Examples - Display Link Up to 16 meters can be daisy-chained to a single Power Xpert LCD Display … up to 16 Display link (RS-485) Connections: = Ethernet = Display link (RS-485) = Modbus RTU (RS-485) 64 64

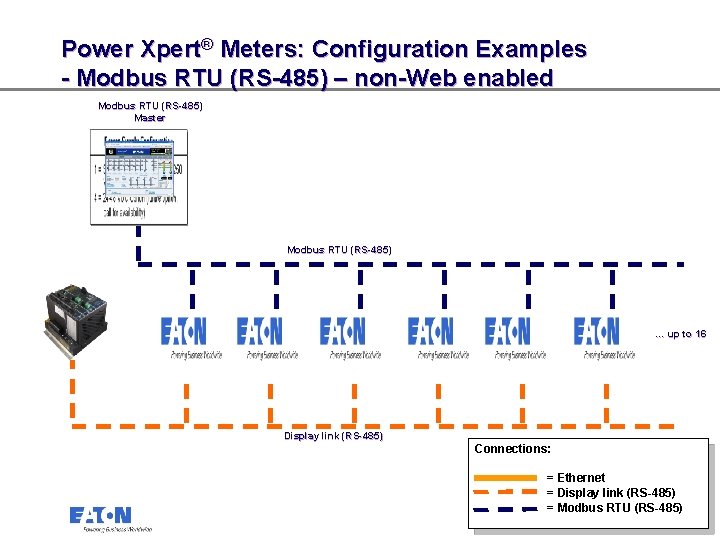
Power Xpert® Meters: Configuration Examples - Modbus RTU (RS-485) – non-Web enabled Modbus RTU (RS-485) Master Modbus RTU (RS-485) … up to 16 Display link (RS-485) Connections: = Ethernet = Display link (RS-485) = Modbus RTU (RS-485) 65 65

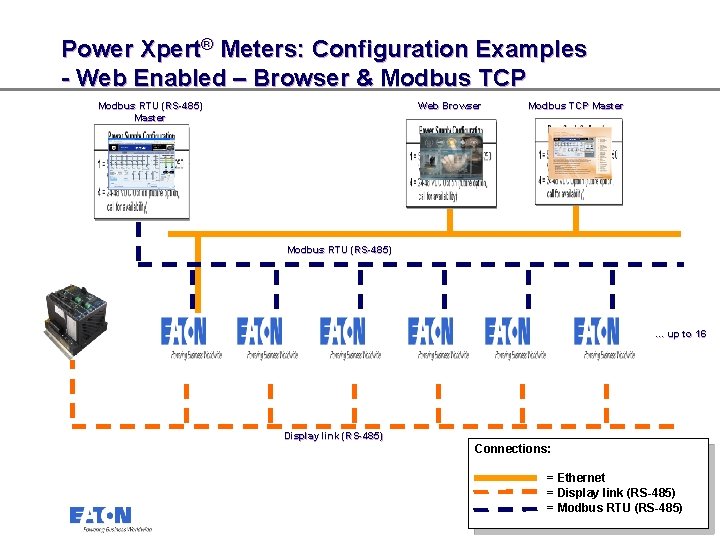
Power Xpert® Meters: Configuration Examples - Web Enabled – Browser & Modbus TCP Modbus RTU (RS-485) Master Web Browser Modbus TCP Master Modbus RTU (RS-485) … up to 16 Display link (RS-485) Connections: = Ethernet = Display link (RS-485) = Modbus RTU (RS-485) 66 66

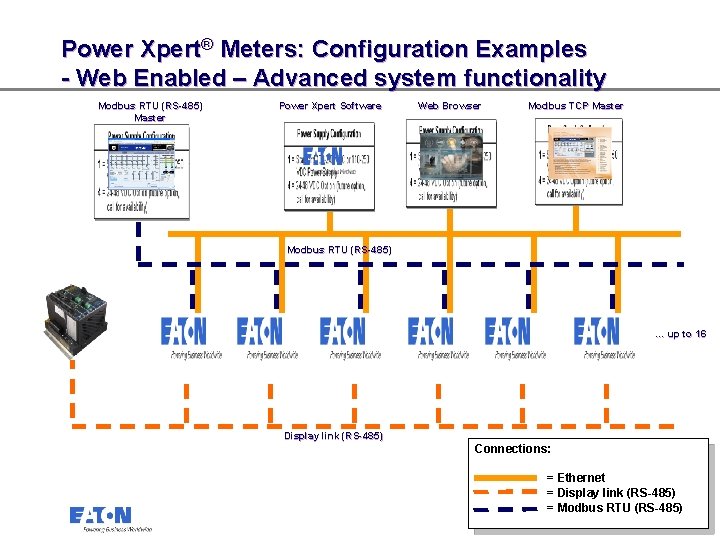
Power Xpert® Meters: Configuration Examples - Web Enabled – Advanced system functionality Modbus RTU (RS-485) Master Power Xpert Software Web Browser Modbus TCP Master Modbus RTU (RS-485) … up to 16 Display link (RS-485) Connections: = Ethernet = Display link (RS-485) = Modbus RTU (RS-485) 67 67

Power Xpert® Meters: Configuration Examples - Accessories – I/O Card (option) Flow Meter (pulse count) Rack monitoring - Open door/tamper switch Alarm • 8 digital inputs • 2 solid-state KYZ outputs • 3 relay outputs Trip and Sequence of Events 68 68

Ordering a Power Xpert Meter 4000/6000/8000 © 2010 Eaton Corporation. All rights reserved.

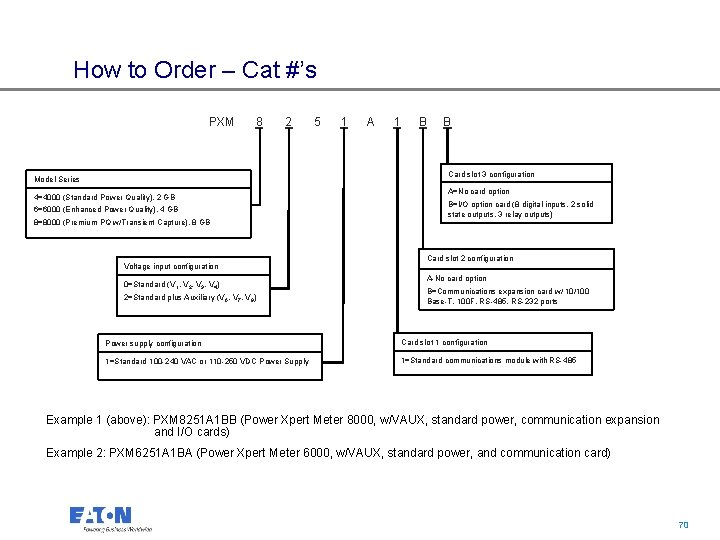
How to Order – Cat #’s PXM 8 2 5 1 A 1 B B Card slot 3 configuration Model Series 4=4000 (Standard Power Quality), 2 GB 6=6000 (Enhanced Power Quality), 4 GB 8=8000 (Premium PQ w/Transient Capture), 8 GB Voltage input configuration 0=Standard (V 1, V 2, V 3, V 4) 2=Standard plus Auxiliary (V 6, V 7, V 8) A=No card option B=I/O option card (8 digital inputs, 2 solid state outputs, 3 relay outputs) Card slot 2 configuration A-No card option B=Communications expansion card w/ 10/100 Base-T, 100 F, RS-485, RS-232 ports Power supply configuration Card slot 1 configuration 1=Standard 100 -240 VAC or 110 -250 VDC Power Supply 1=Standard communications module with RS-485 Example 1 (above): PXM 8251 A 1 BB (Power Xpert Meter 8000, w/VAUX, standard power, communication expansion and I/O cards) Example 2: PXM 6251 A 1 BA (Power Xpert Meter 6000, w/VAUX, standard power, and communication card) 70 70

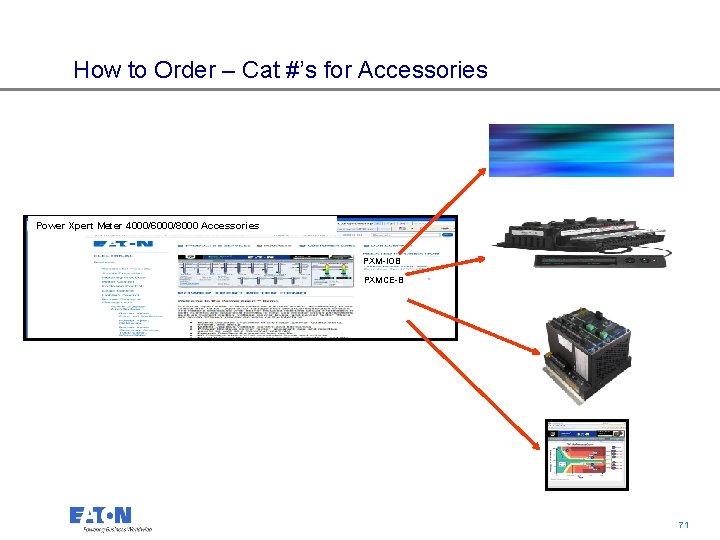
How to Order – Cat #’s for Accessories Power Xpert Meter 4000/6000/8000 Accessories PXM-IOB PXMCE-B 71 71

72 72