
Power Iteration Clustering Frank Lin and William W




- Slides: 123
Power Iteration Clustering Frank Lin and William W. Cohen School of Computer Science, Carnegie Mellon University ICML 2010 -06 -23, Haifa, Israel
Overview • Preview • Motivation • Power Iteration Clustering – Power Iteration – Stopping • Results • Related Work
Overview • Preview • Motivation • Power Iteration Clustering – Power Iteration – Stopping • Results • Related Work
Preview • Spectral clustering methods are nice
Preview • Spectral clustering methods are nice • But they are rather expensive (slow)
Preview • Spectral clustering methods are nice • But they are rather expensive (slow) Power iteration clustering can provide a similar solution at a very low cost (fast)
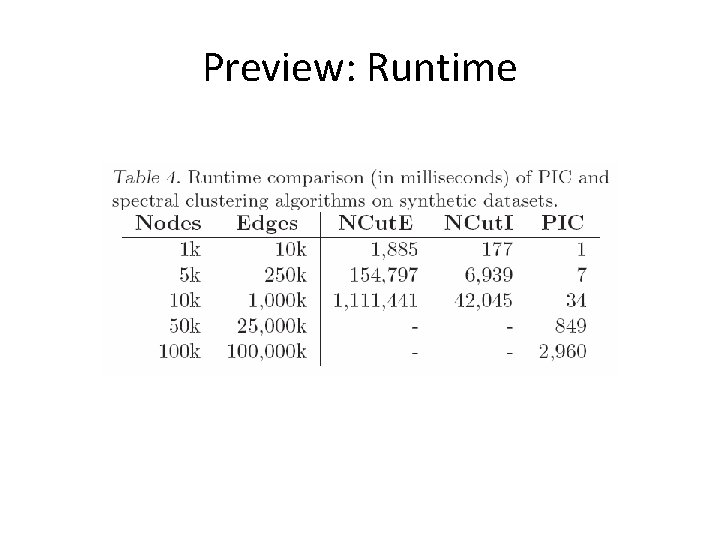
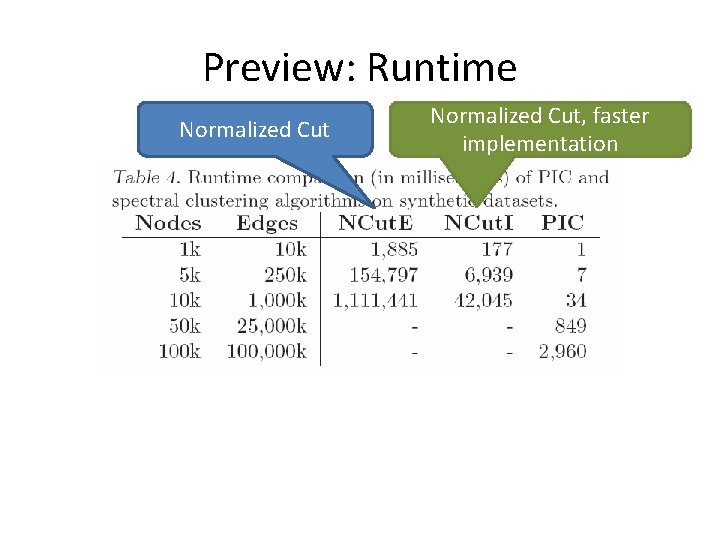
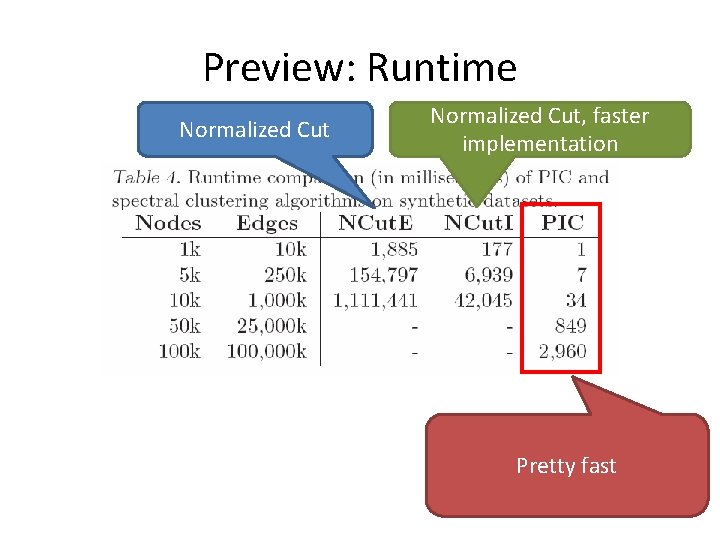
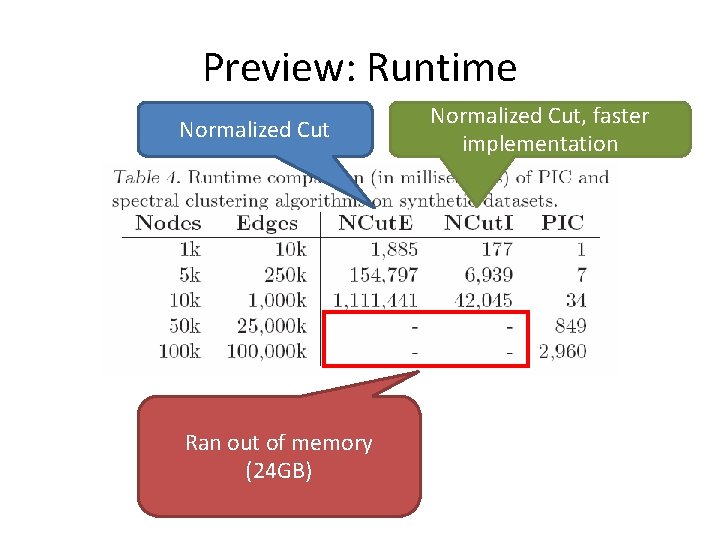
Preview: Runtime
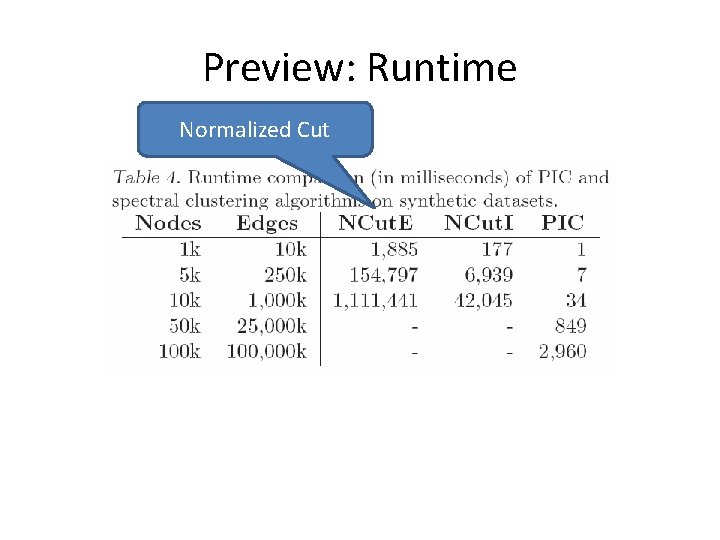
Preview: Runtime Normalized Cut
Preview: Runtime Normalized Cut, faster implementation
Preview: Runtime Normalized Cut, faster implementation Pretty fast
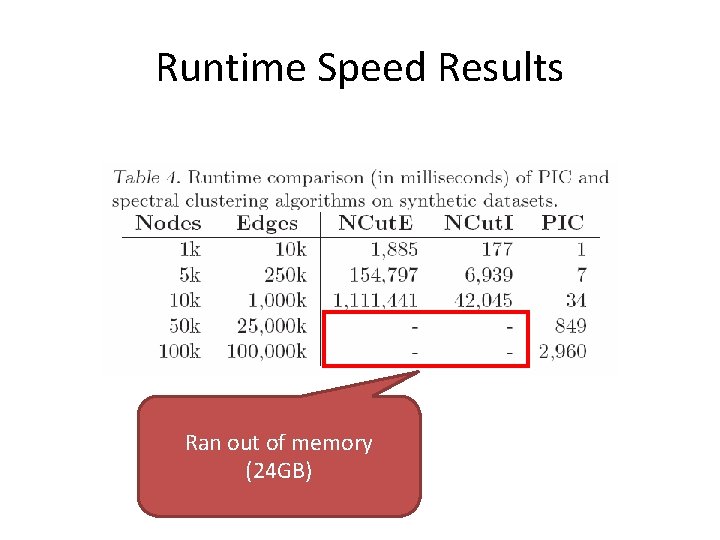
Preview: Runtime Normalized Cut Ran out of memory (24 GB) Normalized Cut, faster implementation
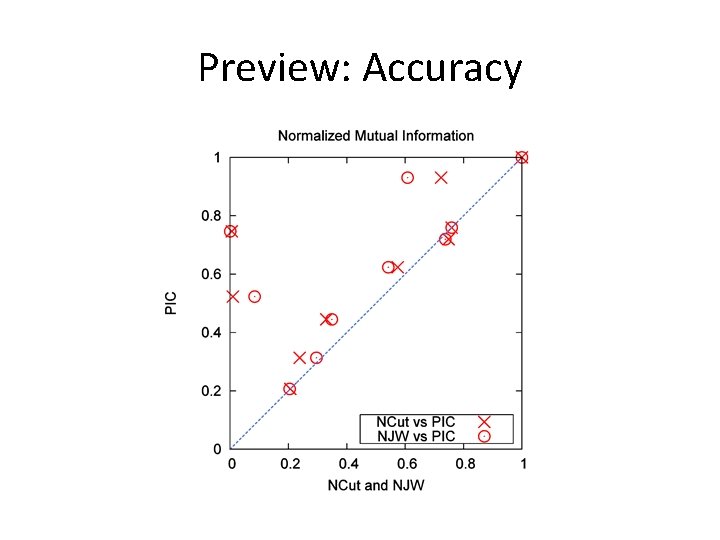
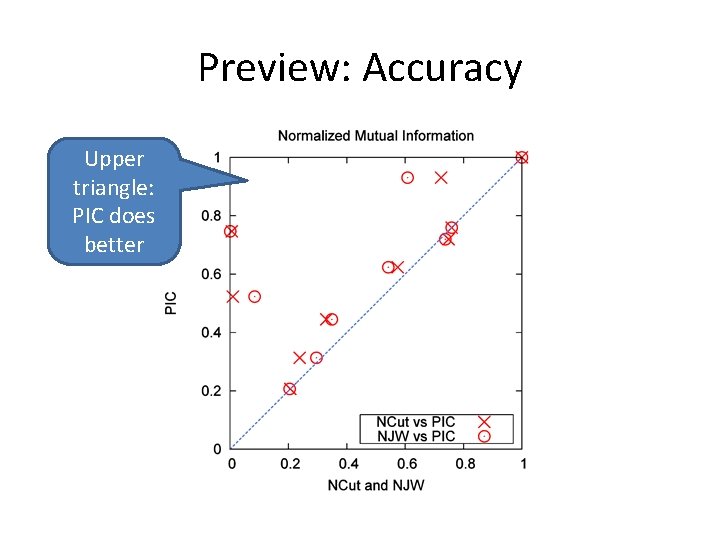
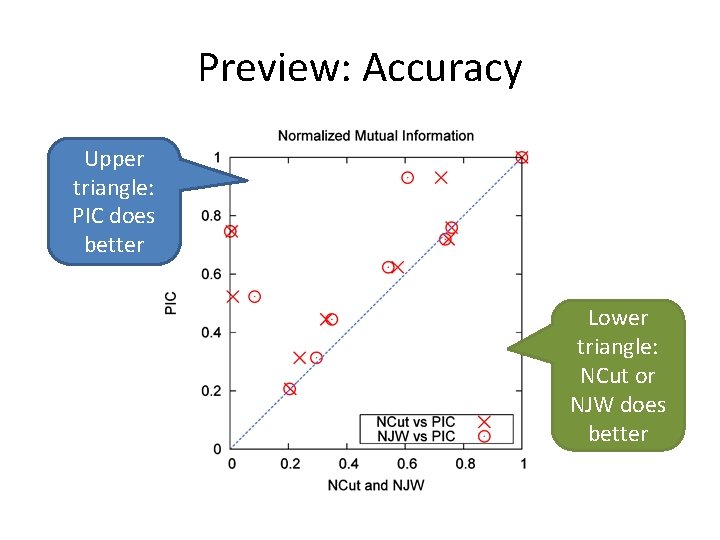
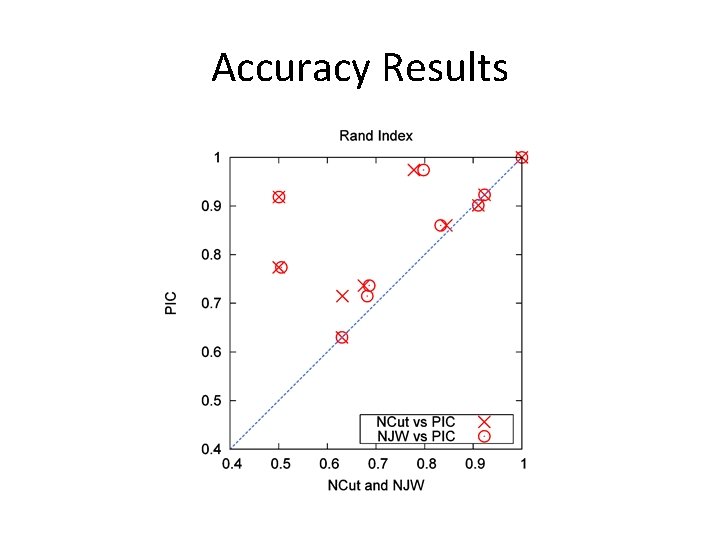
Preview: Accuracy
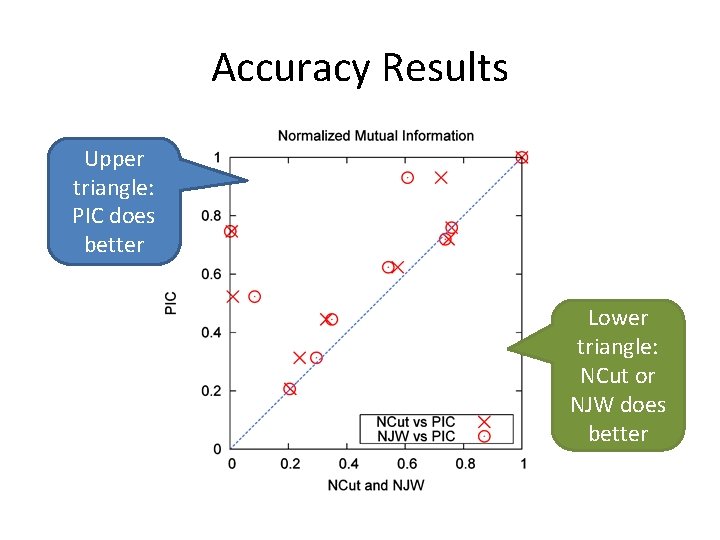
Preview: Accuracy Upper triangle: PIC does better
Preview: Accuracy Upper triangle: PIC does better Lower triangle: NCut or NJW does better
Overview • Preview • Motivation • Power Iteration Clustering – Power Iteration – Stopping • Results • Related Work
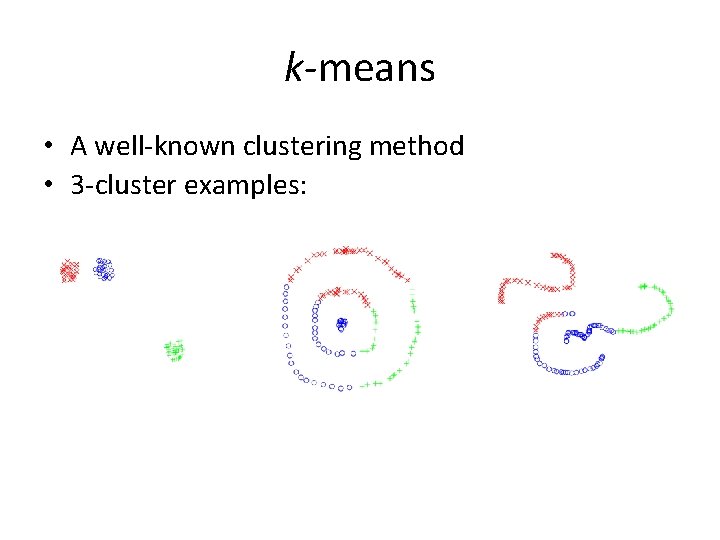
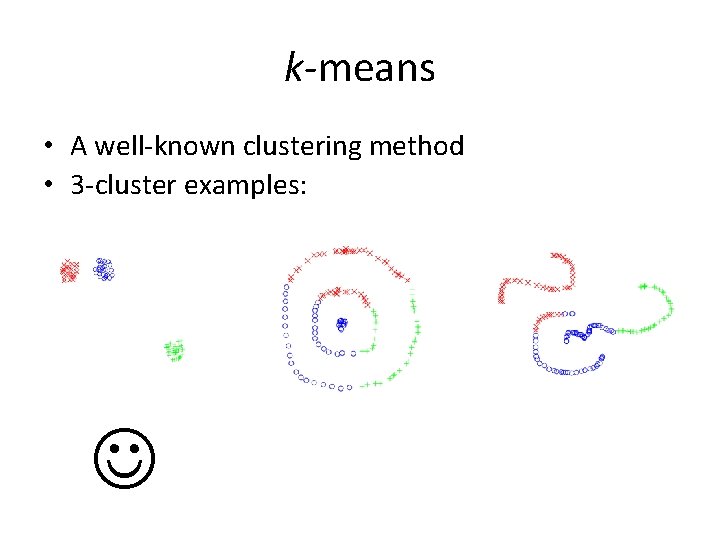
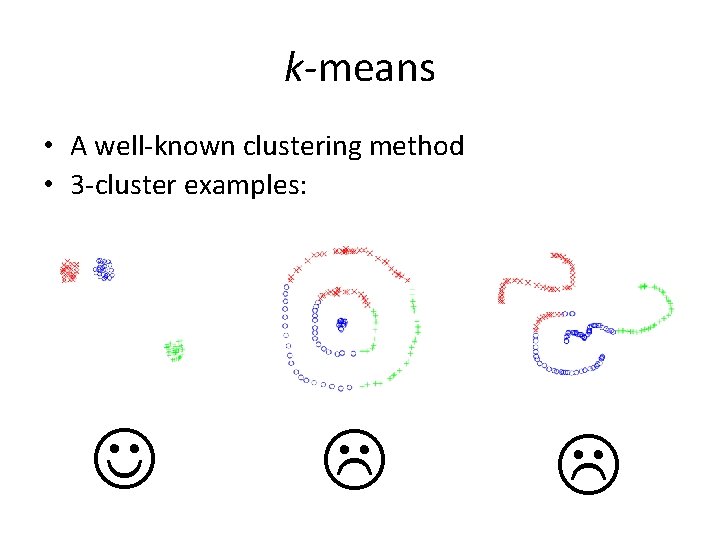
k-means • A well-known clustering method
k-means • A well-known clustering method • 3 -cluster examples:
k-means • A well-known clustering method • 3 -cluster examples:
k-means • A well-known clustering method • 3 -cluster examples:
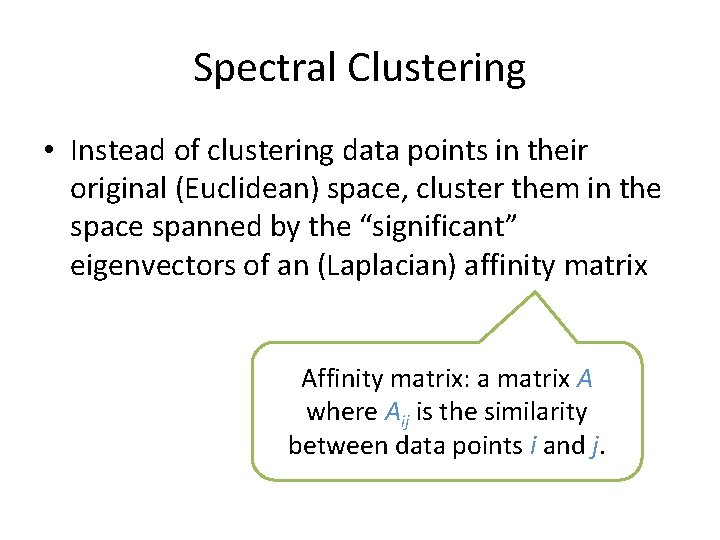
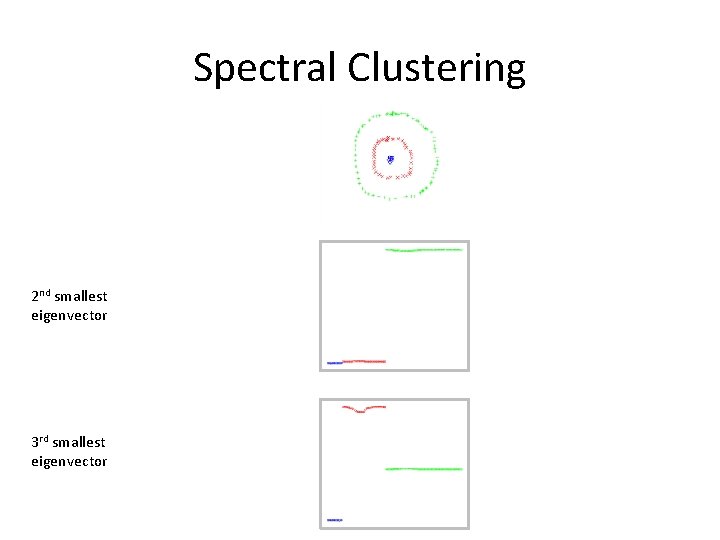
Spectral Clustering • Instead of clustering data points in their original (Euclidean) space, cluster them in the space spanned by the “significant” eigenvectors of an (Laplacian) affinity matrix
Spectral Clustering • Instead of clustering data points in their original (Euclidean) space, cluster them in the space spanned by the “significant” eigenvectors of an (Laplacian) affinity matrix Affinity matrix: a matrix A where Aij is the similarity between data points i and j.
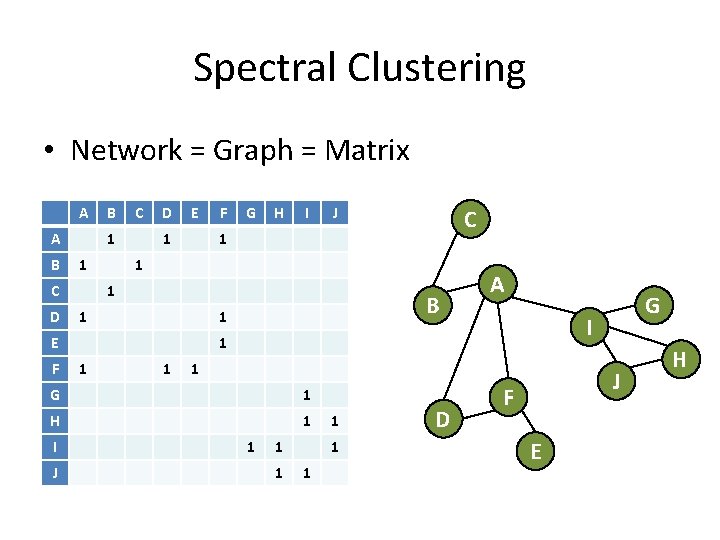
Spectral Clustering • Network = Graph = Matrix A A B C 1 1 C D B D E 1 G H I 1 1 B 1 A 1 1 1 H 1 1 1 1 D G I 1 1 J C 1 G I J 1 E F F J F E H
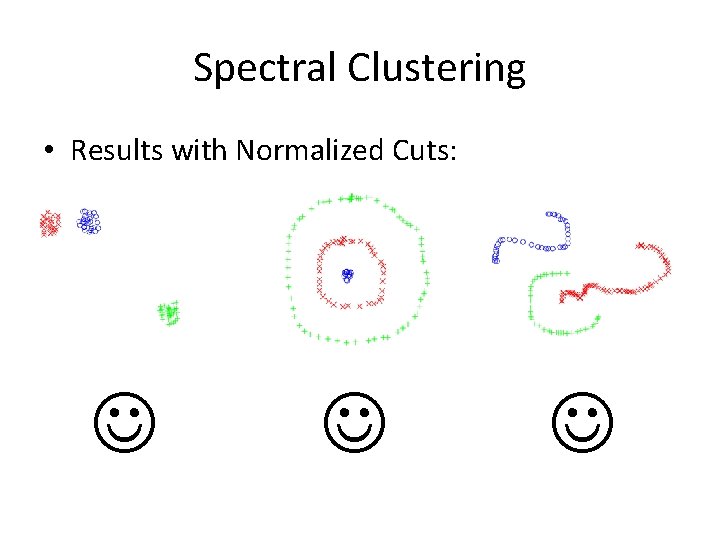
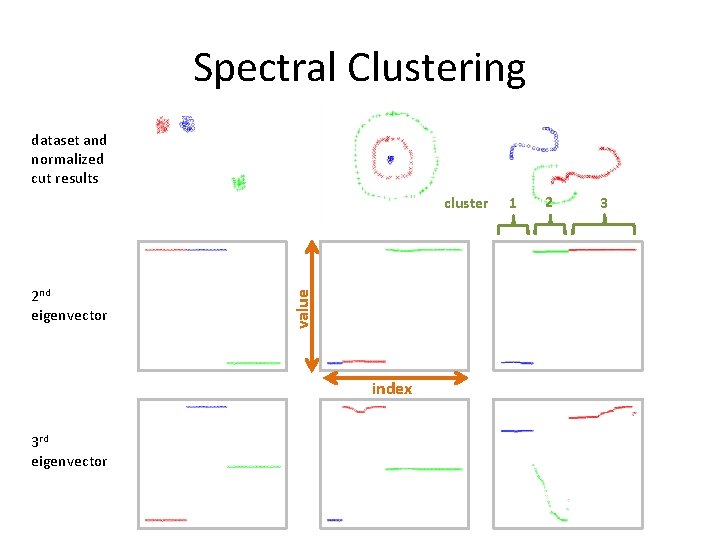
Spectral Clustering • Results with Normalized Cuts:
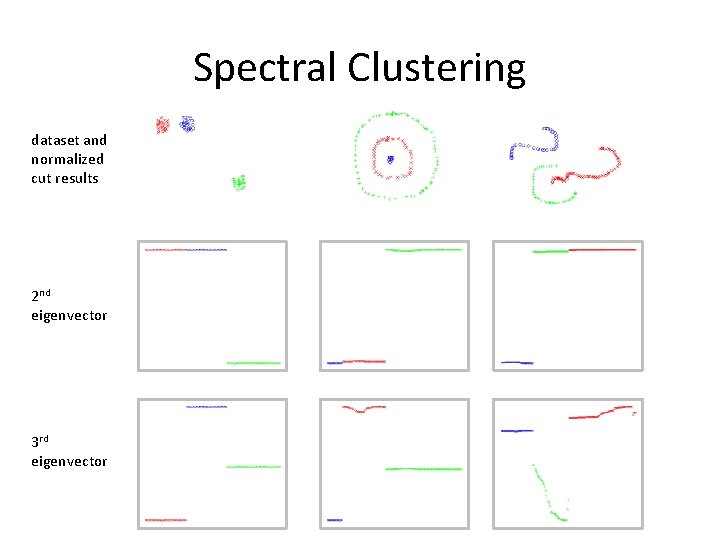
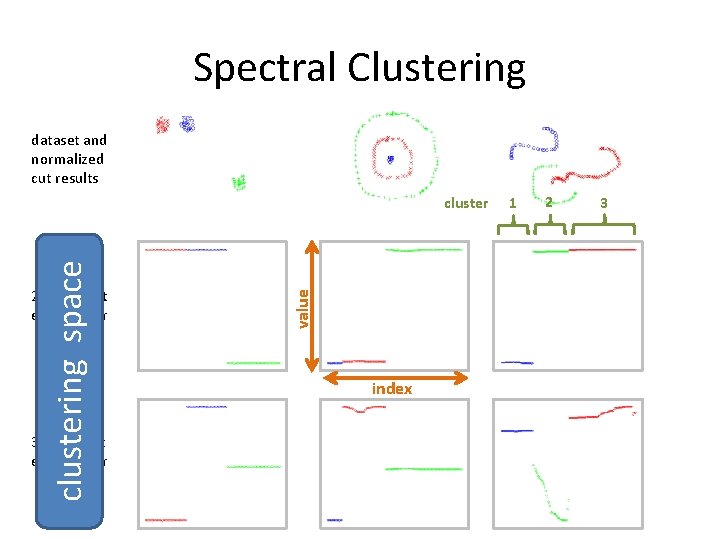
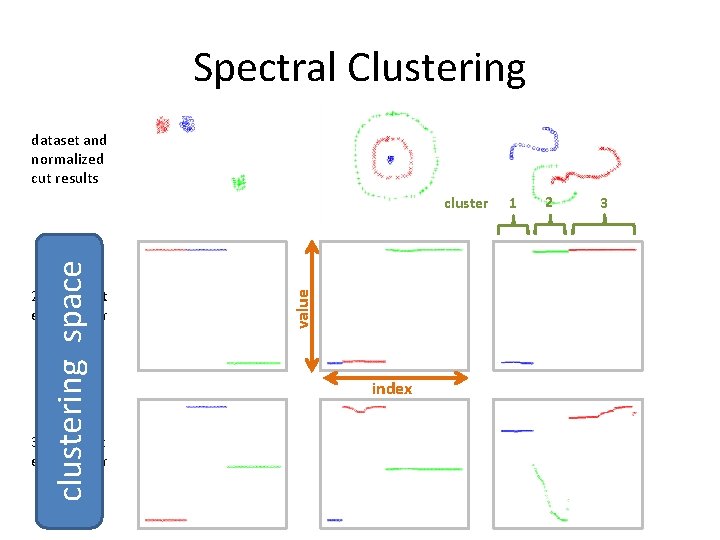
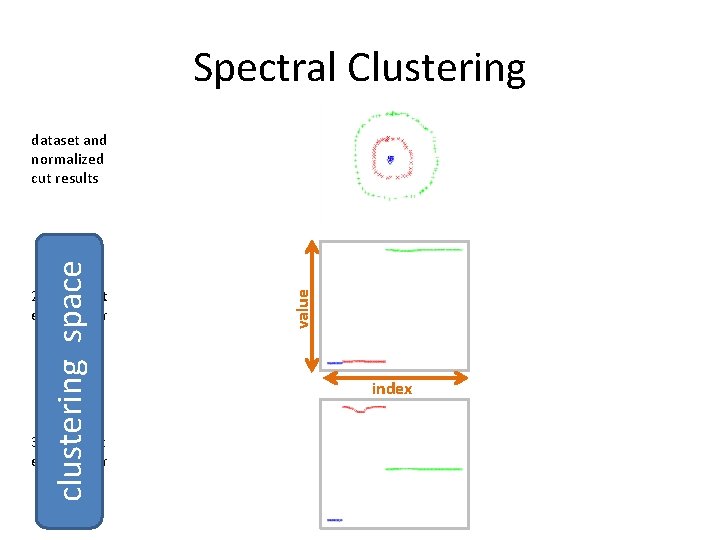
Spectral Clustering dataset and normalized cut results 2 nd eigenvector 3 rd eigenvector
Spectral Clustering dataset and normalized cut results 2 nd eigenvector value cluster index 3 rd eigenvector 1 2 3
Spectral Clustering dataset and normalized cut results 2 nd smallest eigenvector 3 rd smallest eigenvector value clustering space cluster index 1 2 3
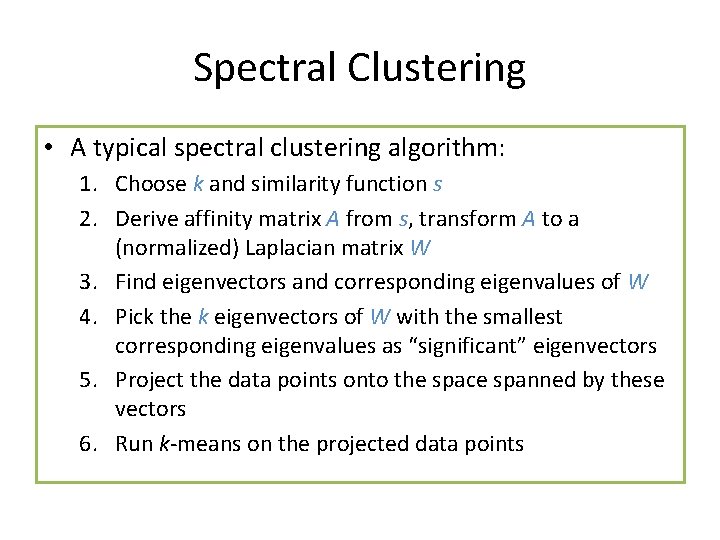
Spectral Clustering • A typical spectral clustering algorithm: 1. Choose k and similarity function s 2. Derive affinity matrix A from s, transform A to a (normalized) Laplacian matrix W 3. Find eigenvectors and corresponding eigenvalues of W 4. Pick the k eigenvectors of W with the smallest corresponding eigenvalues as “significant” eigenvectors 5. Project the data points onto the space spanned by these vectors 6. Run k-means on the projected data points
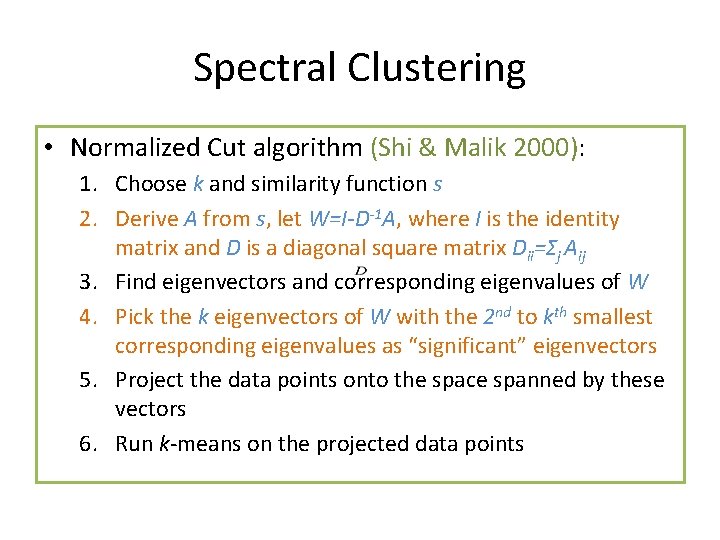
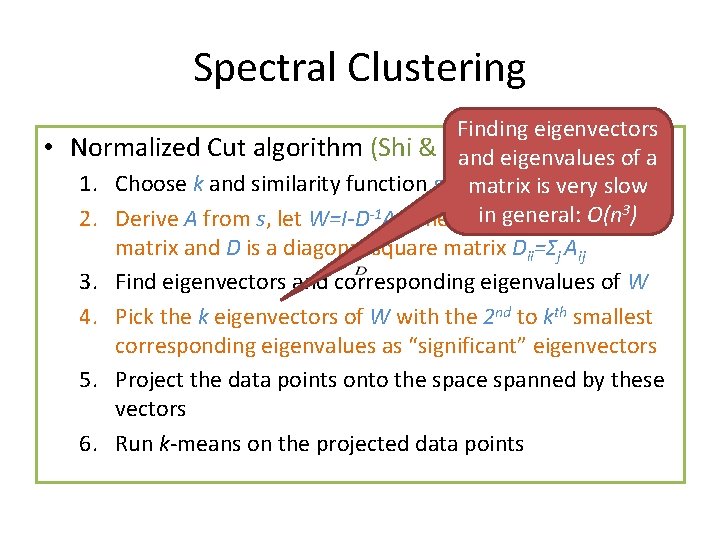
Spectral Clustering • Normalized Cut algorithm (Shi & Malik 2000): 1. Choose k and similarity function s 2. Derive A from s, let W=I-D-1 A, where I is the identity matrix and D is a diagonal square matrix Dii=Σj Aij 3. Find eigenvectors and corresponding eigenvalues of W 4. Pick the k eigenvectors of W with the 2 nd to kth smallest corresponding eigenvalues as “significant” eigenvectors 5. Project the data points onto the space spanned by these vectors 6. Run k-means on the projected data points
Spectral Clustering Finding eigenvectors • Normalized Cut algorithm (Shi & Malik 2000): of a and eigenvalues 1. Choose k and similarity function s matrix is very slow O(n 3) 2. Derive A from s, let W=I-D-1 A, where Iinisgeneral: the identity matrix and D is a diagonal square matrix Dii=Σj Aij 3. Find eigenvectors and corresponding eigenvalues of W 4. Pick the k eigenvectors of W with the 2 nd to kth smallest corresponding eigenvalues as “significant” eigenvectors 5. Project the data points onto the space spanned by these vectors 6. Run k-means on the projected data points
Hmm… • Can we find a low-dimensional embedding for clustering, as spectral clustering, but without calculating these eigenvectors?
Overview • Preview • Motivation • Power Iteration Clustering – Power Iteration – Stopping • Results • Related Work
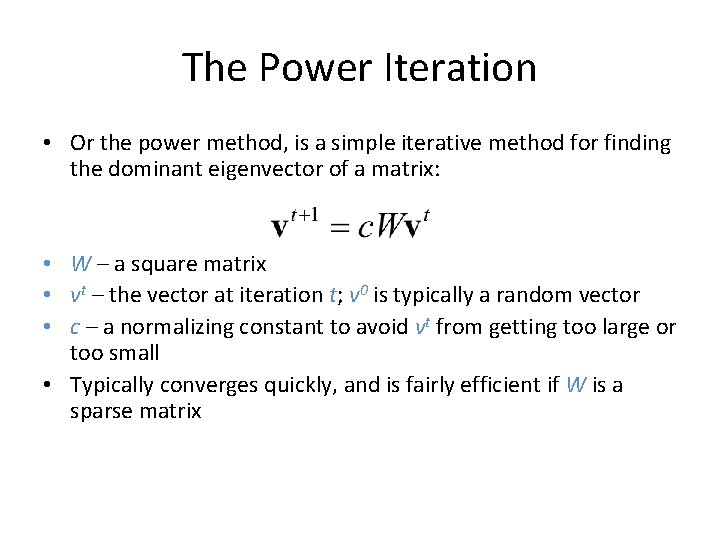
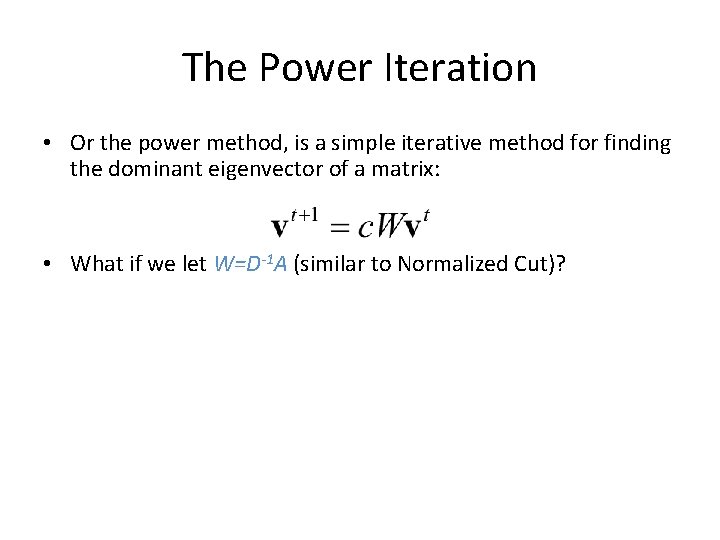
The Power Iteration • Or the power method, is a simple iterative method for finding the dominant eigenvector of a matrix: • W – a square matrix • vt – the vector at iteration t; v 0 is typically a random vector • c – a normalizing constant to avoid vt from getting too large or too small • Typically converges quickly, and is fairly efficient if W is a sparse matrix
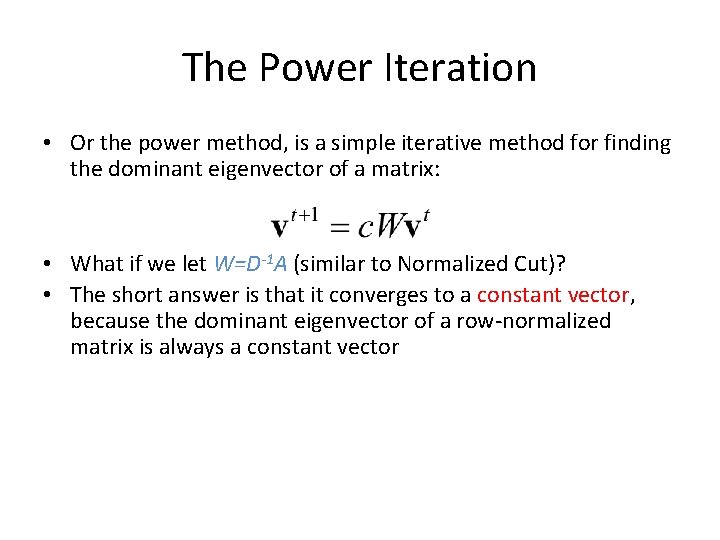
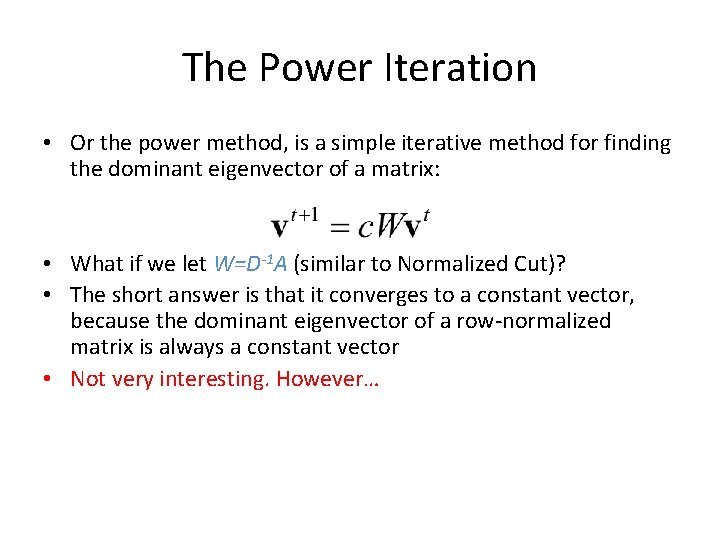
The Power Iteration • Or the power method, is a simple iterative method for finding the dominant eigenvector of a matrix: • What if we let W=D-1 A (similar to Normalized Cut)?
The Power Iteration • Or the power method, is a simple iterative method for finding the dominant eigenvector of a matrix: • What if we let W=D-1 A (similar to Normalized Cut)? • The short answer is that it converges to a constant vector, because the dominant eigenvector of a row-normalized matrix is always a constant vector
The Power Iteration • Or the power method, is a simple iterative method for finding the dominant eigenvector of a matrix: • What if we let W=D-1 A (similar to Normalized Cut)? • The short answer is that it converges to a constant vector, because the dominant eigenvector of a row-normalized matrix is always a constant vector • Not very interesting. However…
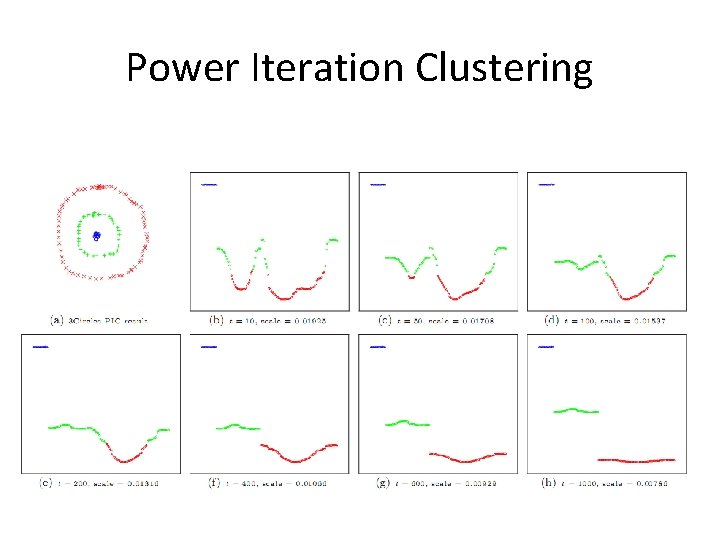
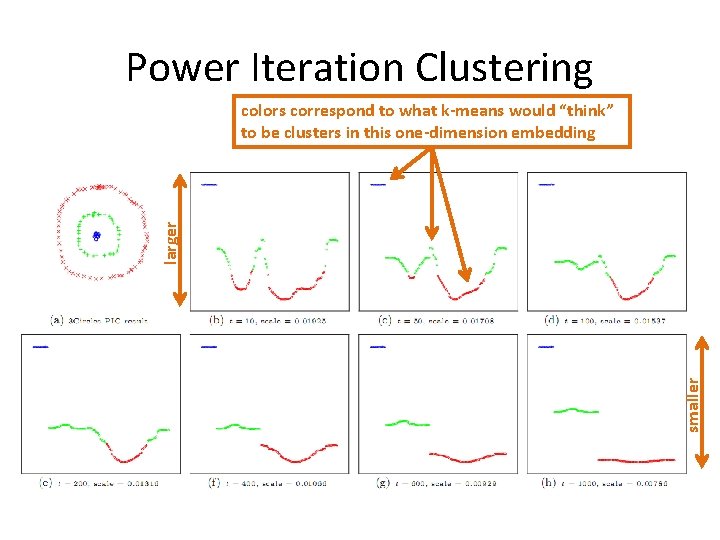
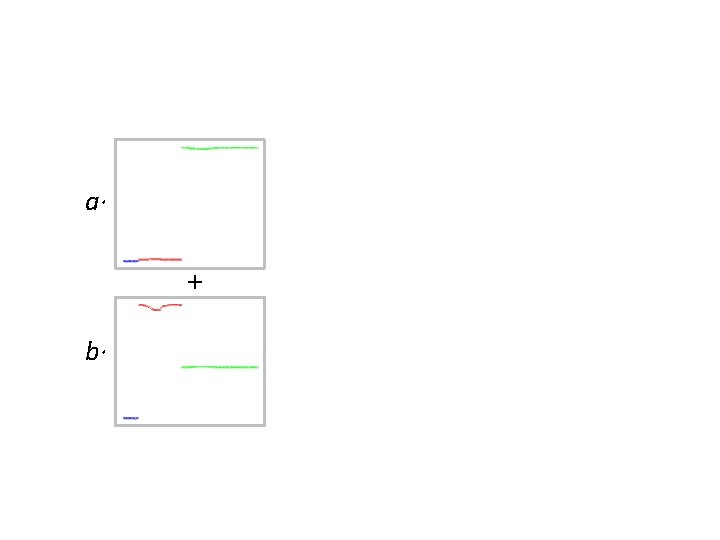
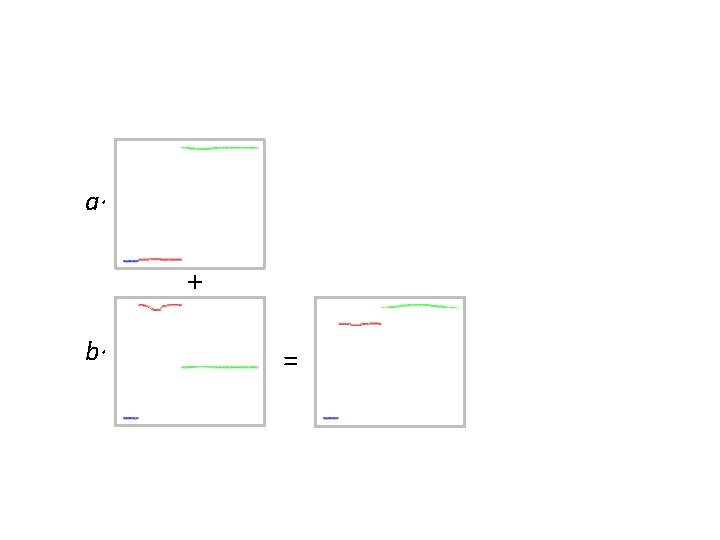
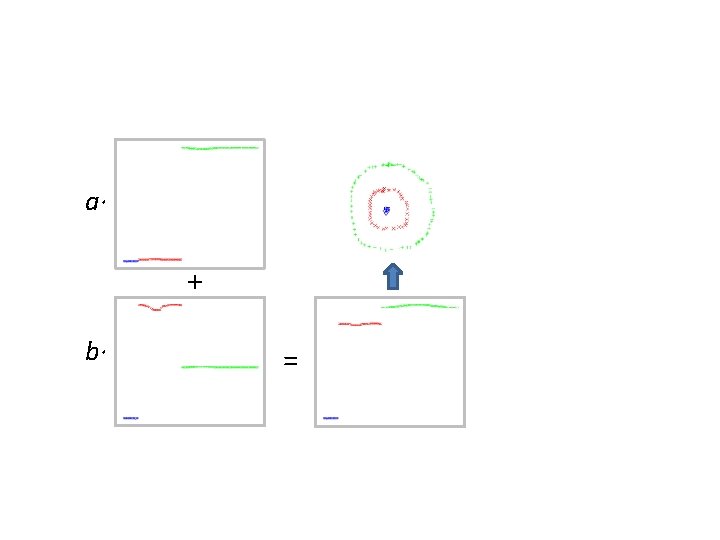
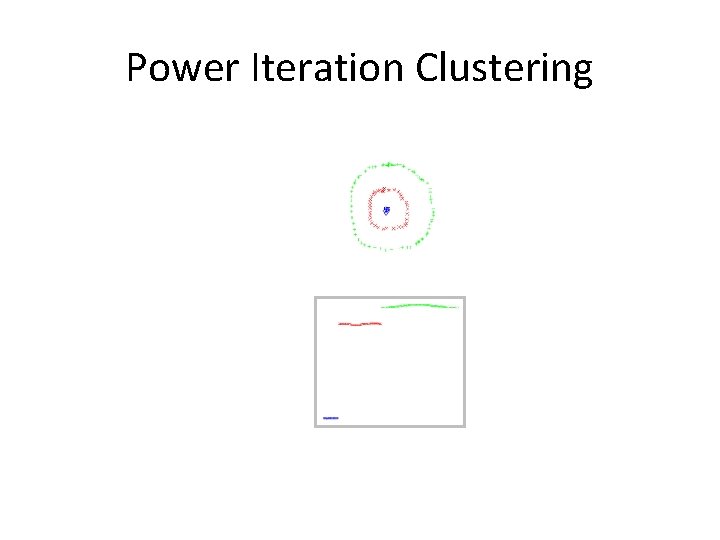
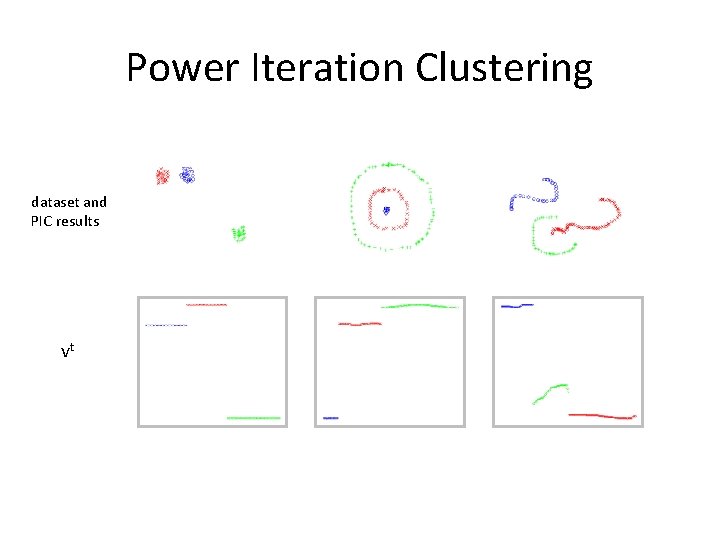
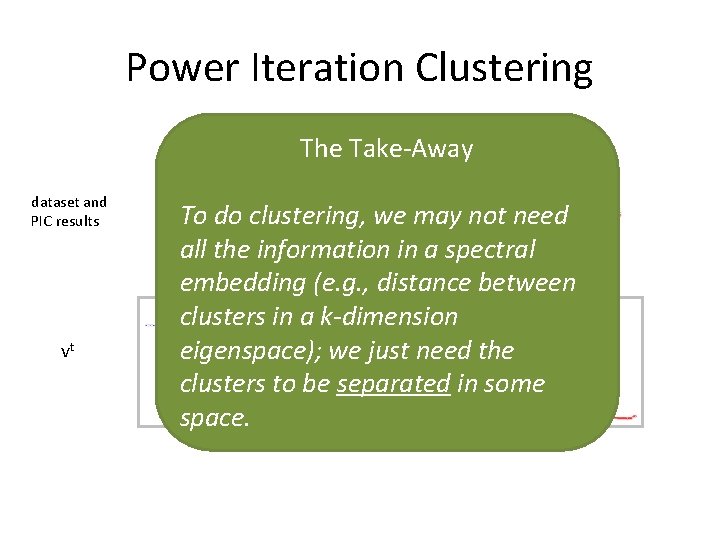
Power Iteration Clustering • It turns out that, if there is some underlying cluster in the data, PI will quickly converge locally within clusters then slowly converge globally to a constant vector. • The locally converged vector, which is a linear combination of the top eigenvectors, will be nearly piece-wise constant with each piece corresponding to a cluster
Power Iteration Clustering
Power Iteration Clustering smaller larger colors correspond to what k-means would “think” to be clusters in this one-dimension embedding
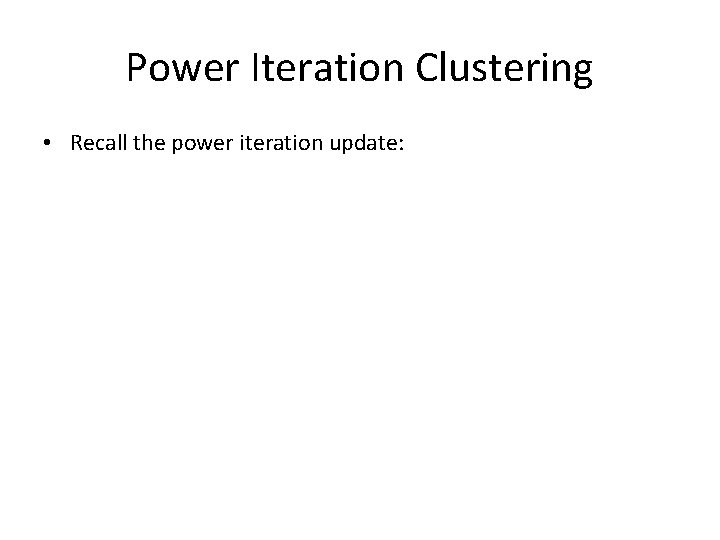
Power Iteration Clustering • Recall the power iteration update:
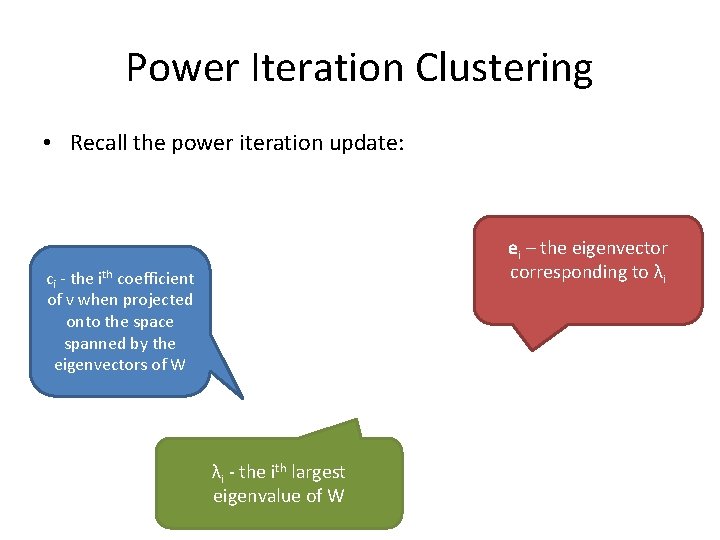
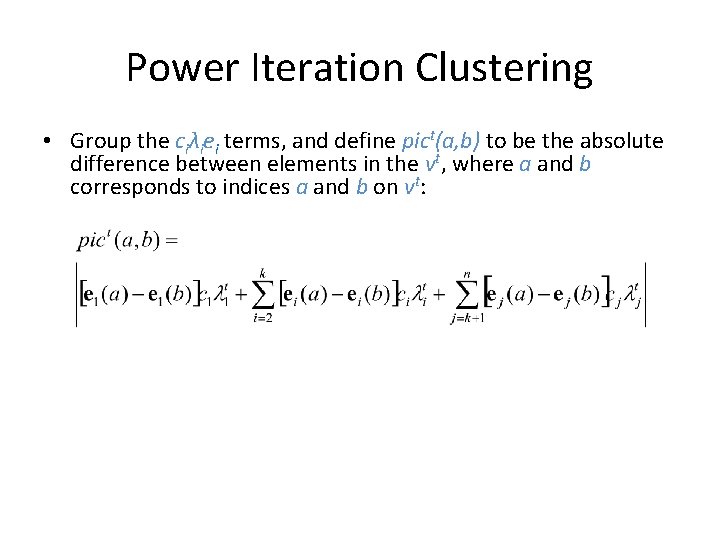
Power Iteration Clustering • Recall the power iteration update: ei – the eigenvector corresponding to λi ci - the ith coefficient of v when projected onto the space spanned by the eigenvectors of W λi - the ith largest eigenvalue of W
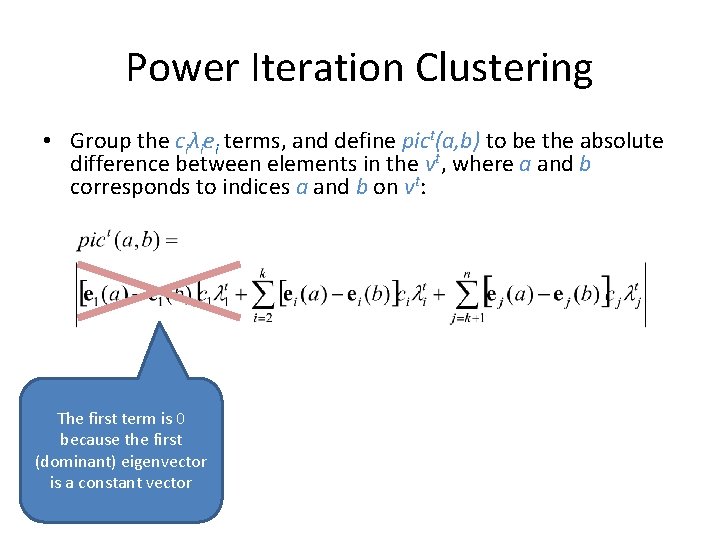
Power Iteration Clustering • Group the ciλiei terms, and define pict(a, b) to be the absolute difference between elements in the vt, where a and b corresponds to indices a and b on vt:
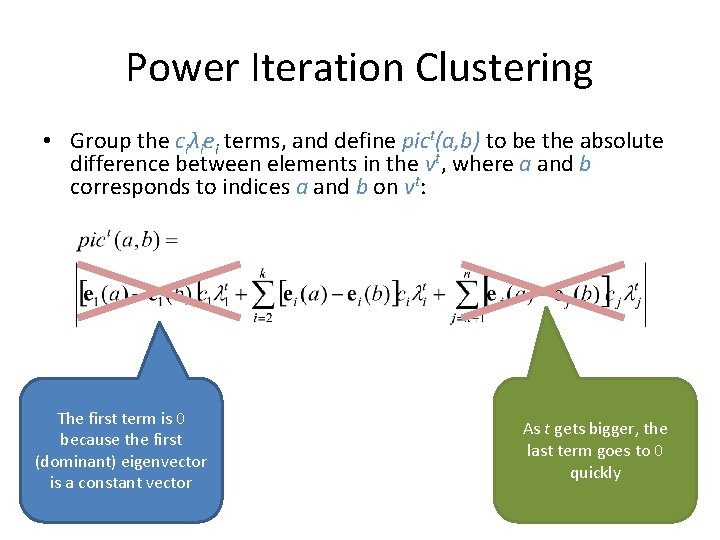
Power Iteration Clustering • Group the ciλiei terms, and define pict(a, b) to be the absolute difference between elements in the vt, where a and b corresponds to indices a and b on vt: The first term is 0 because the first (dominant) eigenvector is a constant vector
Power Iteration Clustering • Group the ciλiei terms, and define pict(a, b) to be the absolute difference between elements in the vt, where a and b corresponds to indices a and b on vt: The first term is 0 because the first (dominant) eigenvector is a constant vector As t gets bigger, the last term goes to 0 quickly
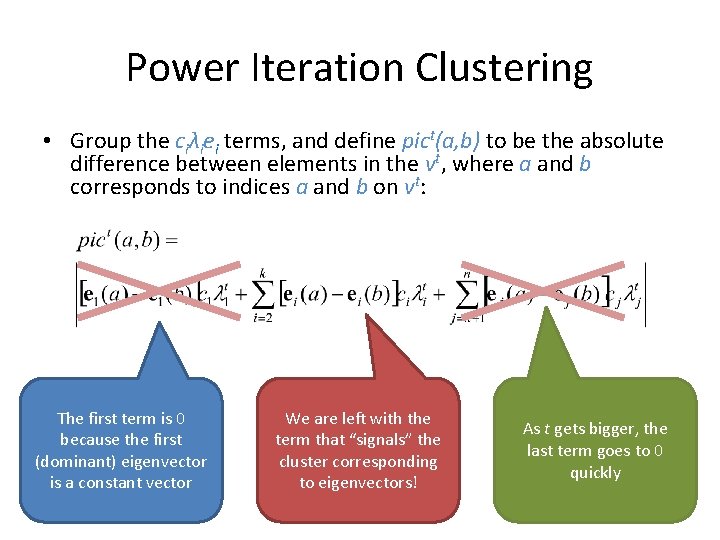
Power Iteration Clustering • Group the ciλiei terms, and define pict(a, b) to be the absolute difference between elements in the vt, where a and b corresponds to indices a and b on vt: The first term is 0 because the first (dominant) eigenvector is a constant vector We are left with the term that “signals” the cluster corresponding to eigenvectors! As t gets bigger, the last term goes to 0 quickly
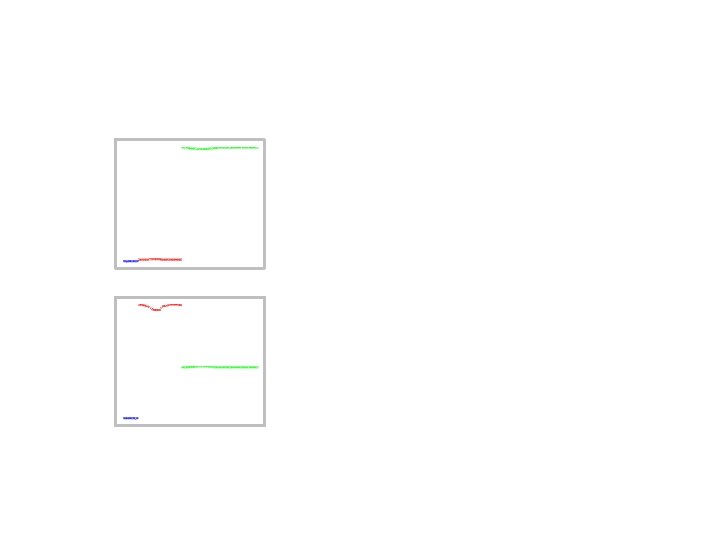
Power Iteration Clustering • The 2 nd to kth eigenvectors of W=D-1 A are roughly piece-wise constant with respect to the underlying clusters, each separating a cluster from the rest of the data (Meila & Shi 2001)
Power Iteration Clustering • The 2 nd to kth eigenvectors of W=D-1 A are roughly piece-wise constant with respect to the underlying clusters, each separating a cluster from the rest of the data (Meila & Shi 2001) • The linear combination of piece-wise constant vectors is also piece-wise constant!
Spectral Clustering dataset and normalized cut results 2 nd smallest eigenvector 3 rd smallest eigenvector value clustering space cluster index 1 2 3
Spectral Clustering 2 nd smallest eigenvector 3 rd smallest eigenvector value clustering space dataset and normalized cut results index
Spectral Clustering 2 nd smallest eigenvector 3 rd smallest eigenvector
Power Iteration Clustering
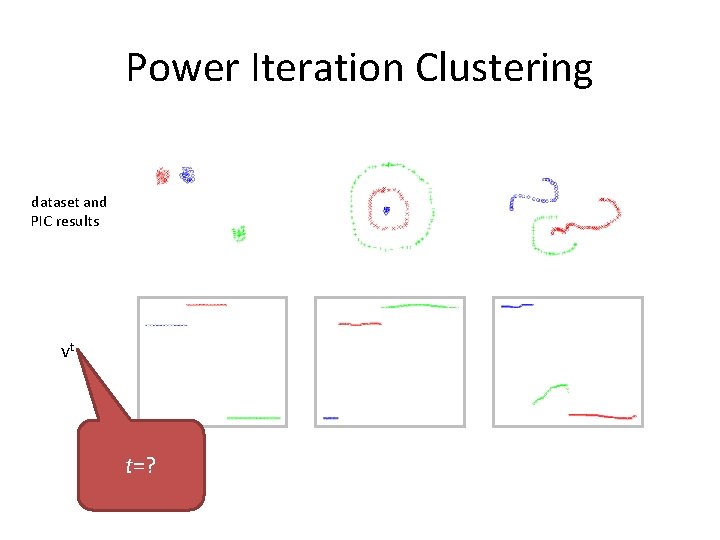
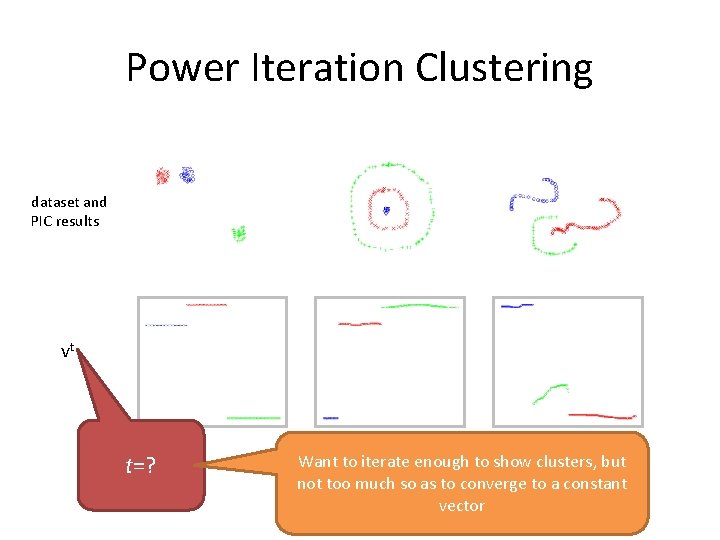
Power Iteration Clustering dataset and PIC results vt
Power Iteration Clustering The Take-Away dataset and PIC results vt To do clustering, we may not need all the information in a spectral embedding (e. g. , distance between clusters in a k-dimension eigenspace); we just need the clusters to be separated in some space.
Power Iteration Clustering dataset and PIC results vt t=?
Power Iteration Clustering dataset and PIC results vt t=? Want to iterate enough to show clusters, but not too much so as to converge to a constant vector
Overview • Preview • Motivation • Power Iteration Clustering – Power Iteration – Stopping • Results • Related Work
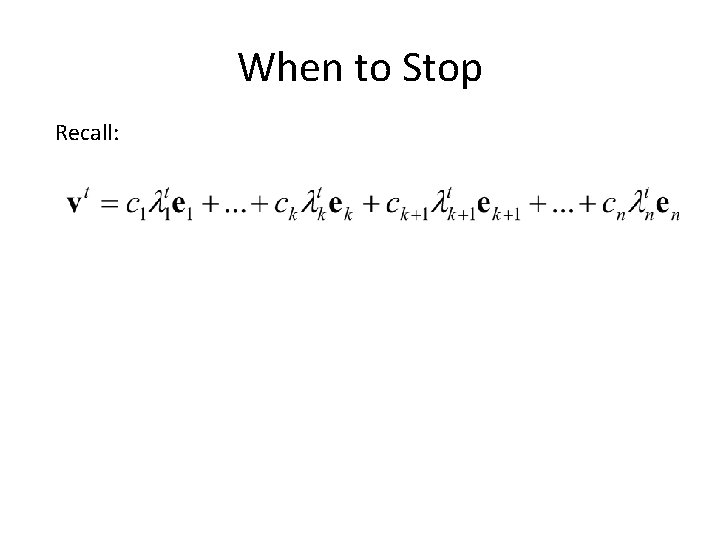
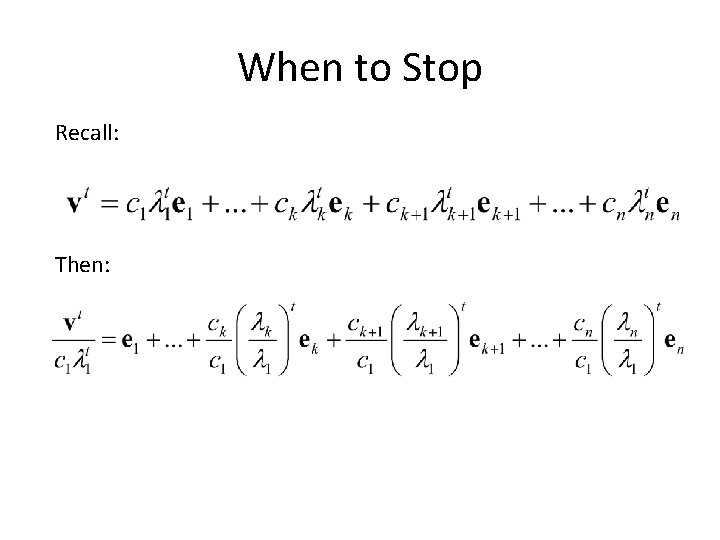
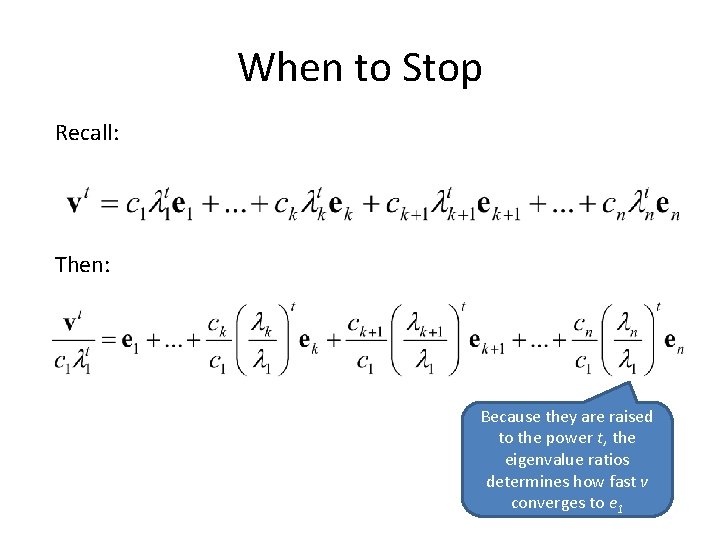
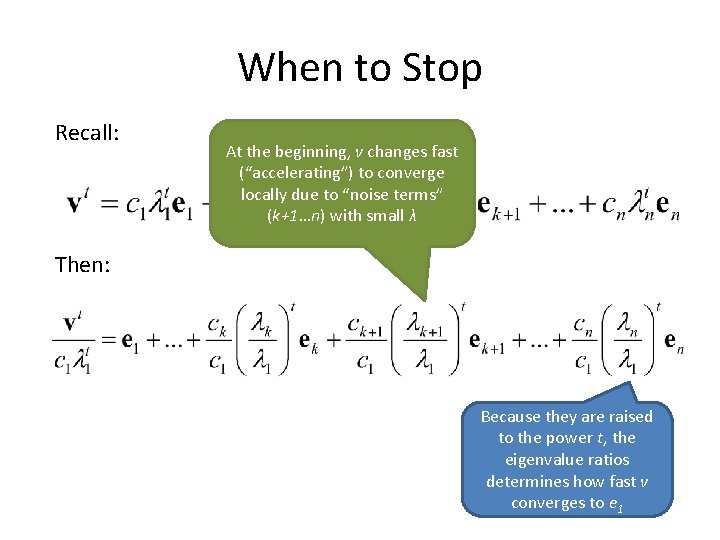
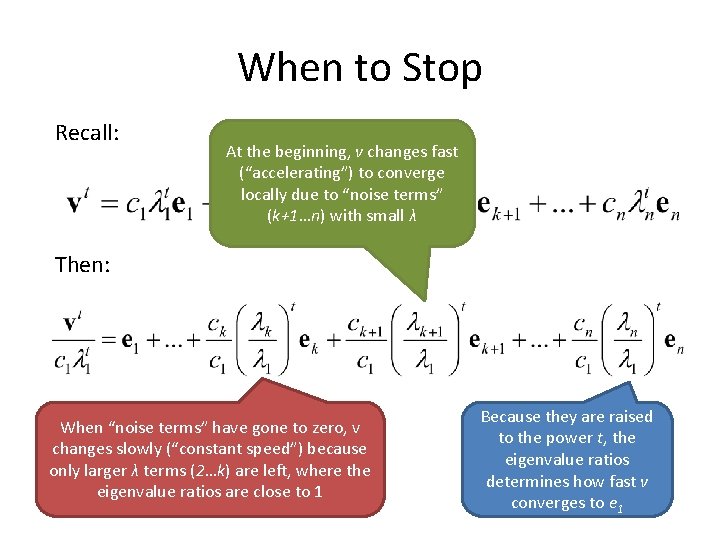
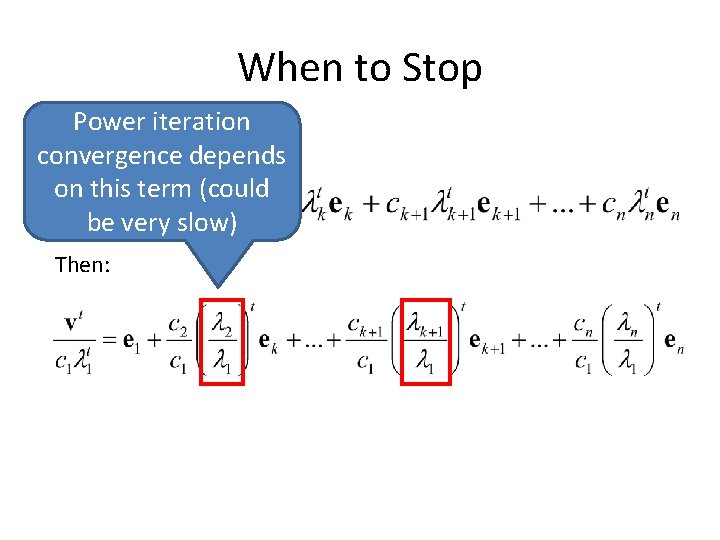
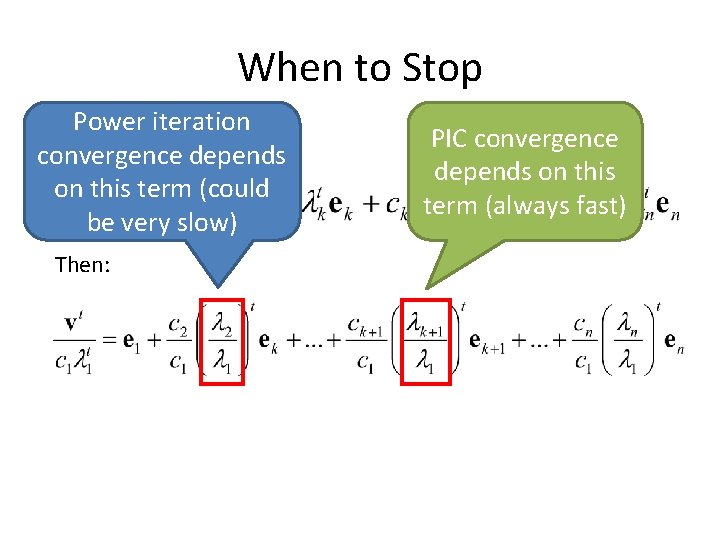
When to Stop Recall:
When to Stop Recall: Then:
When to Stop Recall: Then: Because they are raised to the power t, the eigenvalue ratios determines how fast v converges to e 1
When to Stop Recall: At the beginning, v changes fast (“accelerating”) to converge locally due to “noise terms” (k+1…n) with small λ Then: Because they are raised to the power t, the eigenvalue ratios determines how fast v converges to e 1
When to Stop Recall: At the beginning, v changes fast (“accelerating”) to converge locally due to “noise terms” (k+1…n) with small λ Then: When “noise terms” have gone to zero, v changes slowly (“constant speed”) because only larger λ terms (2…k) are left, where the eigenvalue ratios are close to 1 Because they are raised to the power t, the eigenvalue ratios determines how fast v converges to e 1
When to Stop • So we can stop when the “acceleration” is nearly zero.
When to Stop Power iteration Recall: convergence depends on this term (could be very slow) Then:
When to Stop Power iteration Recall: convergence depends on this term (could be very slow) Then: PIC convergence depends on this term (always fast)
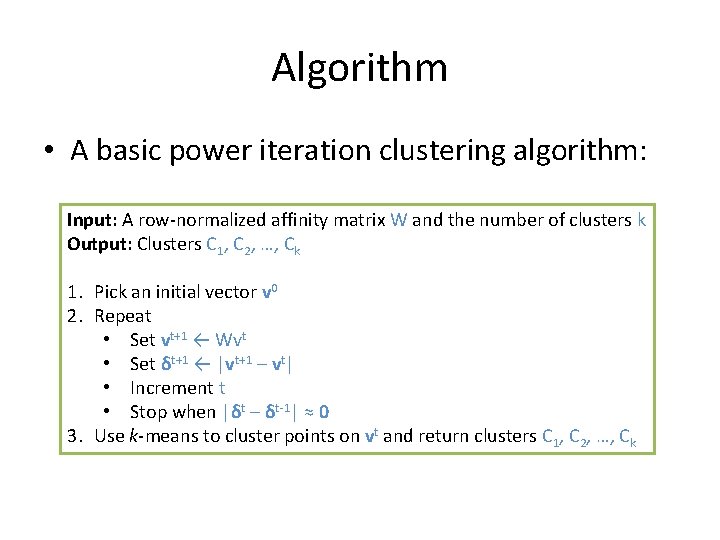
Algorithm • A basic power iteration clustering algorithm: Input: A row-normalized affinity matrix W and the number of clusters k Output: Clusters C 1, C 2, …, Ck 1. Pick an initial vector v 0 2. Repeat • Set vt+1 ← Wvt • Set δt+1 ← |vt+1 – vt| • Increment t • Stop when |δt – δt-1| ≈ 0 3. Use k-means to cluster points on vt and return clusters C 1, C 2, …, Ck
Overview • Preview • Motivation • Power Iteration Clustering – Power Iteration – Stopping • Results • Related Work
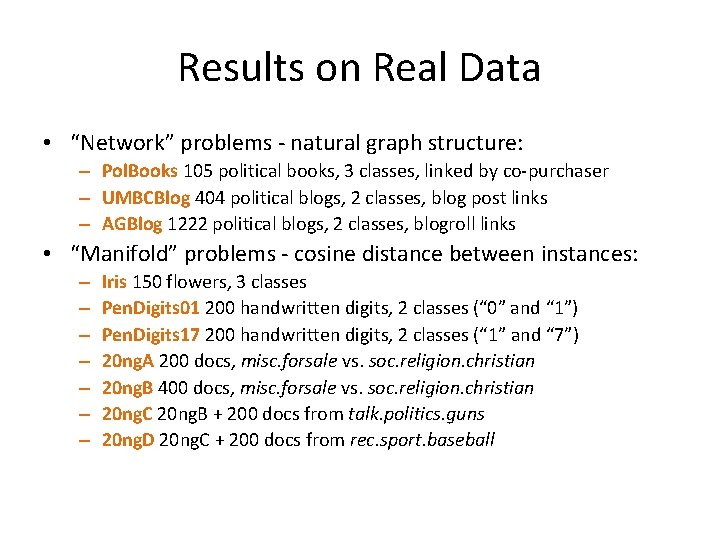
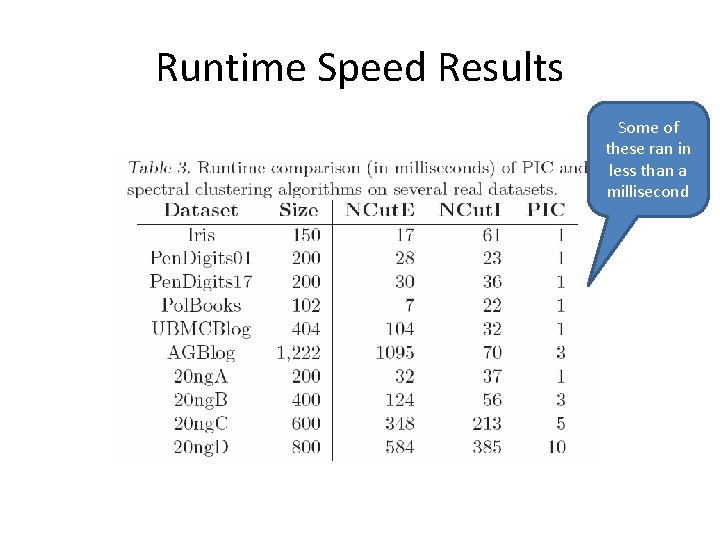
Results on Real Data • “Network” problems - natural graph structure: – Pol. Books 105 political books, 3 classes, linked by co-purchaser – UMBCBlog 404 political blogs, 2 classes, blog post links – AGBlog 1222 political blogs, 2 classes, blogroll links • “Manifold” problems - cosine distance between instances: – – – – Iris 150 flowers, 3 classes Pen. Digits 01 200 handwritten digits, 2 classes (“ 0” and “ 1”) Pen. Digits 17 200 handwritten digits, 2 classes (“ 1” and “ 7”) 20 ng. A 200 docs, misc. forsale vs. soc. religion. christian 20 ng. B 400 docs, misc. forsale vs. soc. religion. christian 20 ng. C 20 ng. B + 200 docs from talk. politics. guns 20 ng. D 20 ng. C + 200 docs from rec. sport. baseball
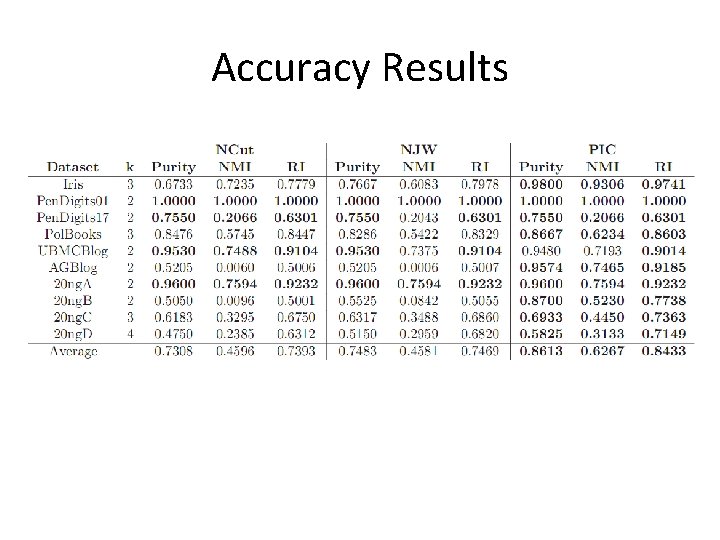
Accuracy Results Upper triangle: PIC does better Lower triangle: NCut or NJW does better
Accuracy Results
Accuracy Results
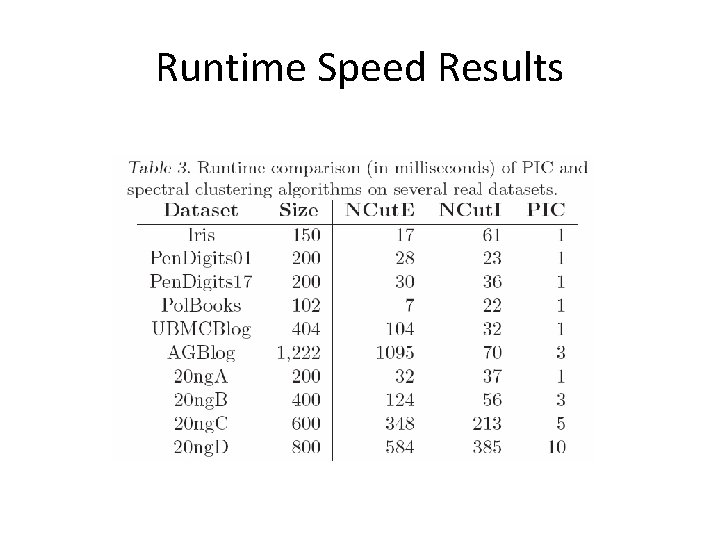
Runtime Speed Results
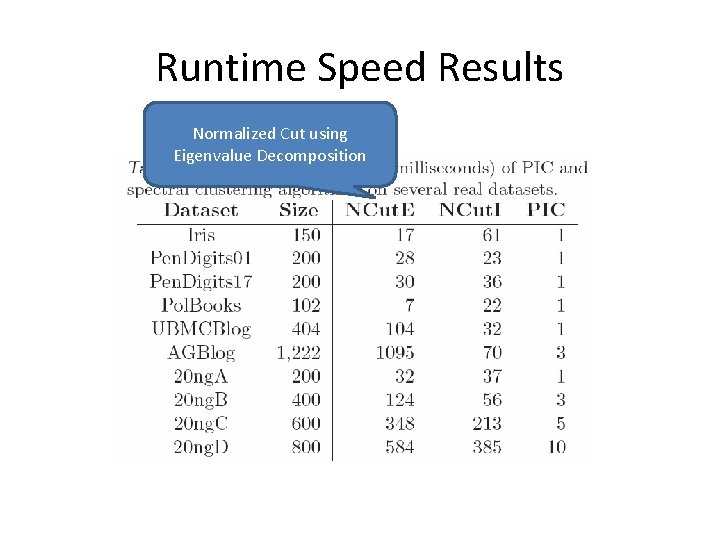
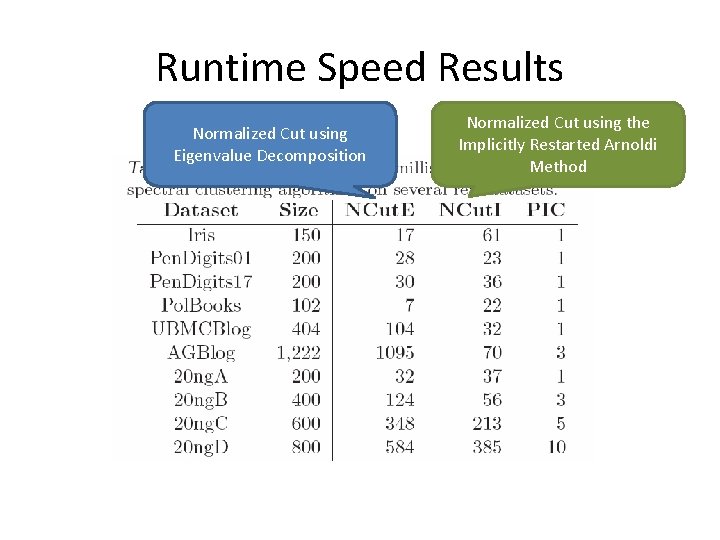
Runtime Speed Results Normalized Cut using Eigenvalue Decomposition
Runtime Speed Results Normalized Cut using Eigenvalue Decomposition Normalized Cut using the Implicitly Restarted Arnoldi Method
Runtime Speed Results Some of these ran in less than a millisecond
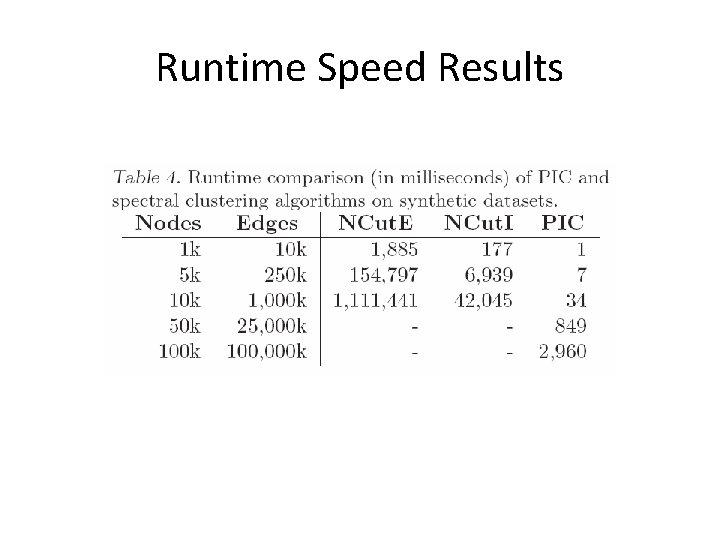
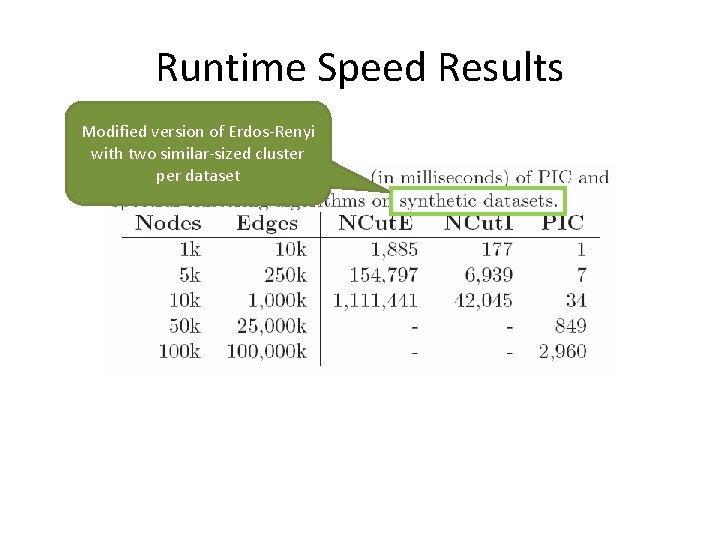
Runtime Speed Results
Runtime Speed Results Modified version of Erdos-Renyi with two similar-sized cluster per dataset
Runtime Speed Results Ran out of memory (24 GB)
Overview • Preview • Motivation • Power Iteration Clustering – Power Iteration – Stopping • Results • Related Work
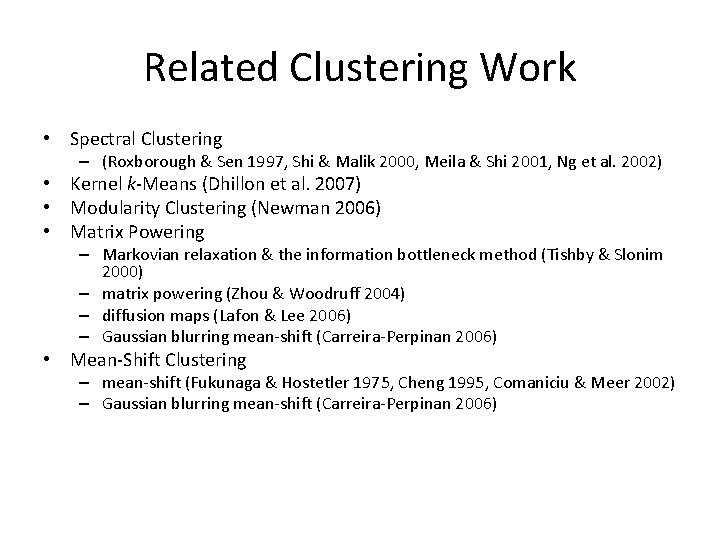
Related Clustering Work • Spectral Clustering – (Roxborough & Sen 1997, Shi & Malik 2000, Meila & Shi 2001, Ng et al. 2002) • Kernel k-Means (Dhillon et al. 2007) • Modularity Clustering (Newman 2006) • Matrix Powering – Markovian relaxation & the information bottleneck method (Tishby & Slonim 2000) – matrix powering (Zhou & Woodruff 2004) – diffusion maps (Lafon & Lee 2006) – Gaussian blurring mean-shift (Carreira-Perpinan 2006) • Mean-Shift Clustering – mean-shift (Fukunaga & Hostetler 1975, Cheng 1995, Comaniciu & Meer 2002) – Gaussian blurring mean-shift (Carreira-Perpinan 2006)
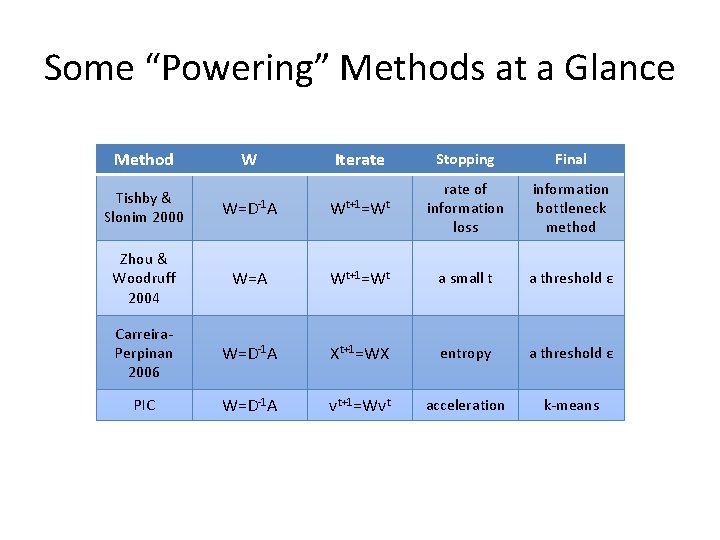
Some “Powering” Methods at a Glance Method W Iterate Stopping Final information bottleneck method Tishby & Slonim 2000 W=D-1 A Wt+1=Wt rate of information loss Zhou & Woodruff 2004 W=A Wt+1=Wt a small t a threshold ε Carreira. Perpinan 2006 W=D-1 A Xt+1=WX entropy a threshold ε PIC W=D-1 A vt+1=Wvt acceleration k-means
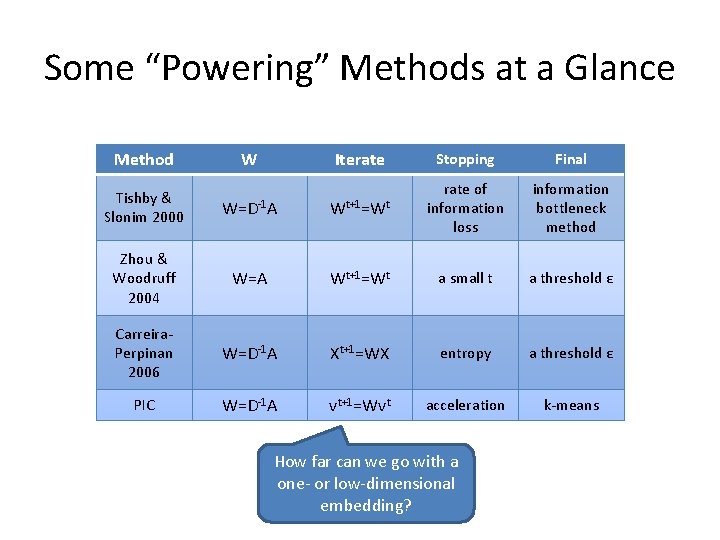
Some “Powering” Methods at a Glance Method W Iterate Stopping Final information bottleneck method Tishby & Slonim 2000 W=D-1 A Wt+1=Wt rate of information loss Zhou & Woodruff 2004 W=A Wt+1=Wt a small t a threshold ε Carreira. Perpinan 2006 W=D-1 A Xt+1=WX entropy a threshold ε PIC W=D-1 A vt+1=Wvt acceleration k-means How far can we go with a one- or low-dimensional embedding?
Conclusion • • Fast Space-efficient Simple parallel/distributed implementation
Conclusion • • Fast Space-efficient Simple parallel/distributed implementation • Plug: extensions for manifold problems with dense similarity matrices, without node/edge sampling (ECAI 2010)
Thanks to… • • NIH/NIGMS NSF Microsoft Live. Labs Google
Questions?
Accuracy Results
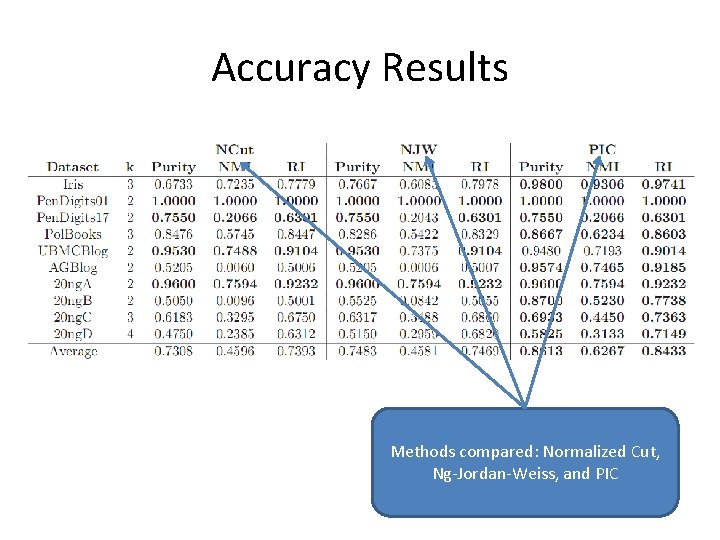
Accuracy Results Methods compared: Normalized Cut, Ng-Jordan-Weiss, and PIC
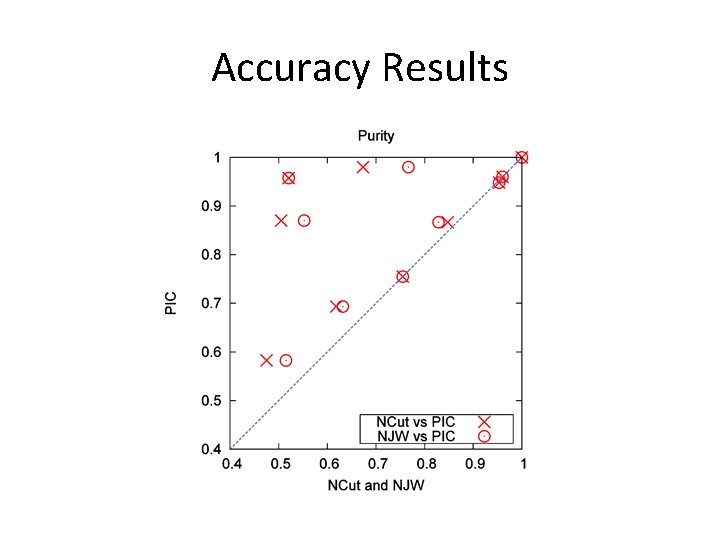
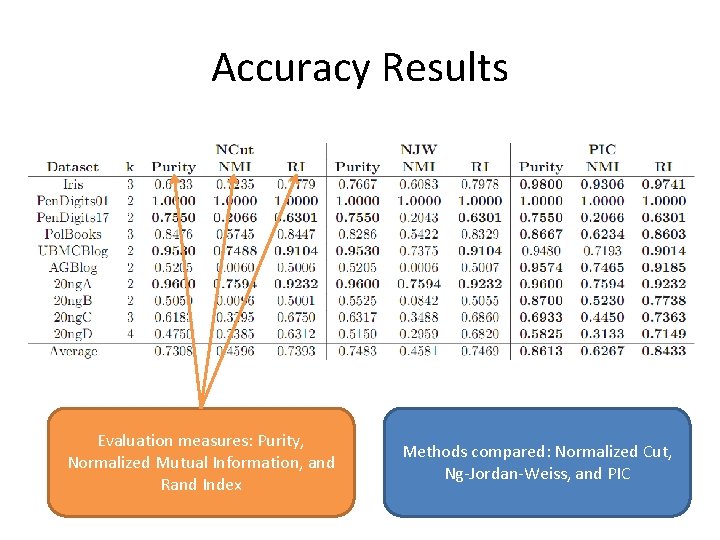
Accuracy Results Evaluation measures: Purity, Normalized Mutual Information, and Rand Index Methods compared: Normalized Cut, Ng-Jordan-Weiss, and PIC
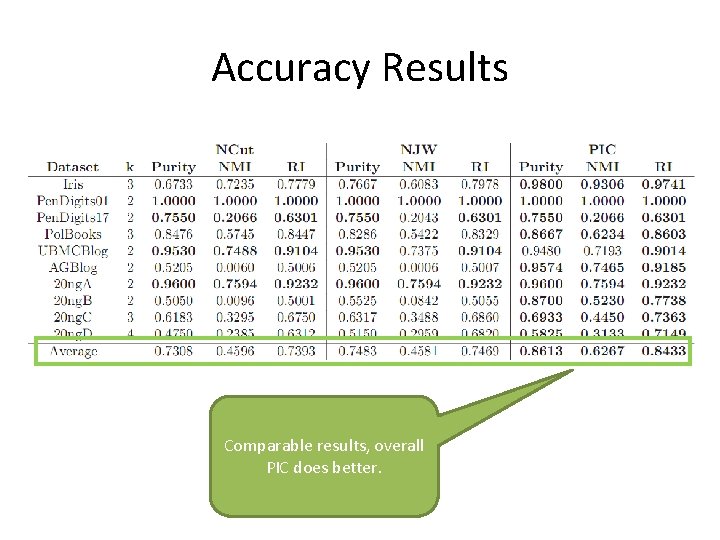
Accuracy Results Comparable results, overall PIC does better.
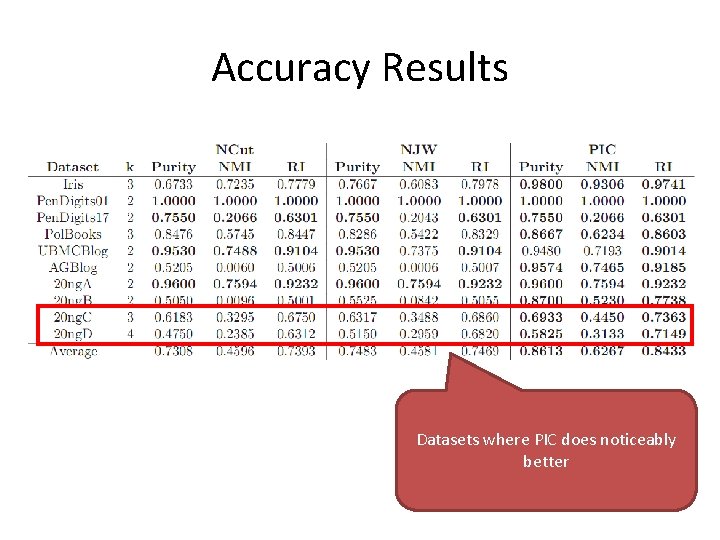
Accuracy Results Datasets where PIC does noticeably better
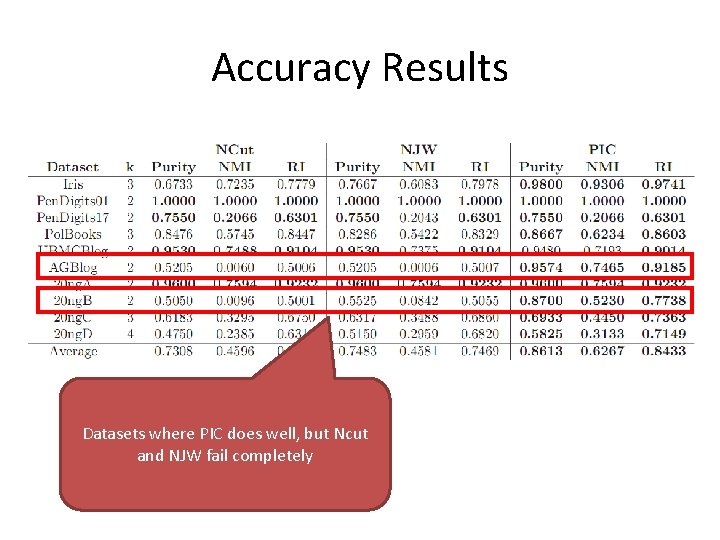
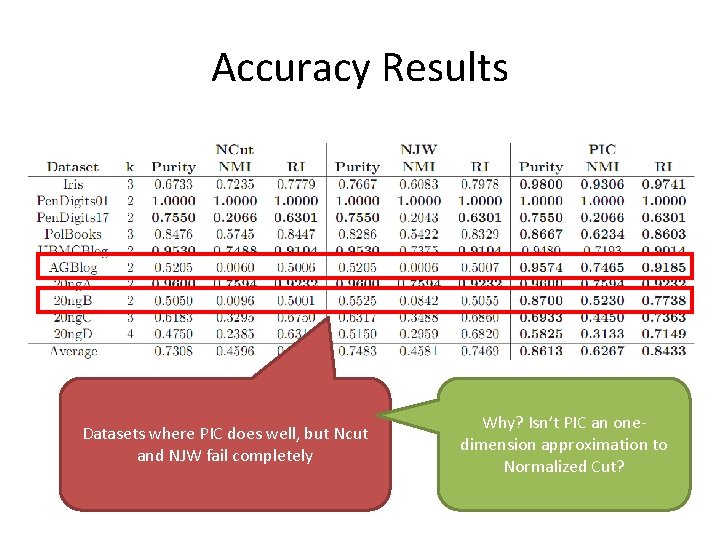
Accuracy Results Datasets where PIC does well, but Ncut and NJW fail completely
Accuracy Results Datasets where PIC does well, but Ncut and NJW fail completely Why? Isn’t PIC an onedimension approximation to Normalized Cut?
Why is PIC sometimes much better? • To be precise, the embedding PIC provides is not just a linear combination of the top k eigenvectors; it is a linear combination of all the eigenvectors weighted exponentially by their respective eigenvalues.
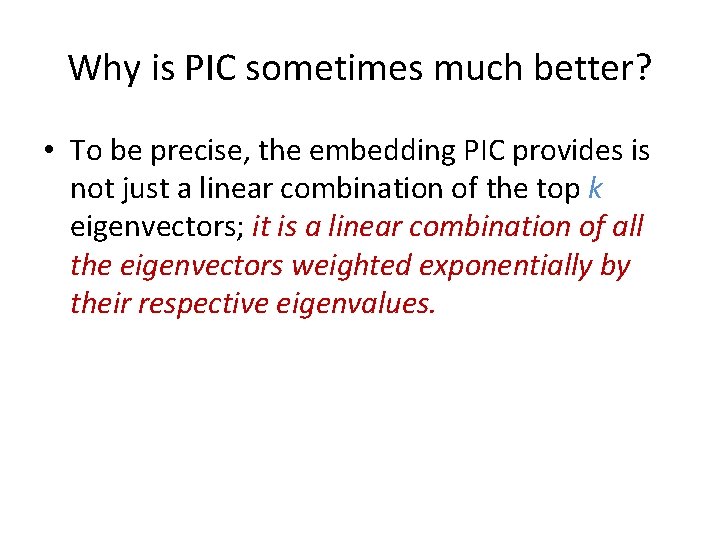
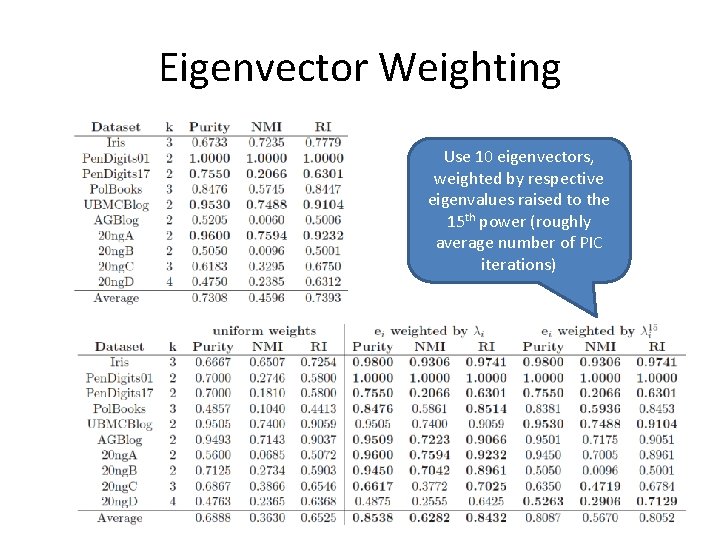
Eigenvector Weighting Original NCut – using k eigenvectors, uniform weights on eigenvectors
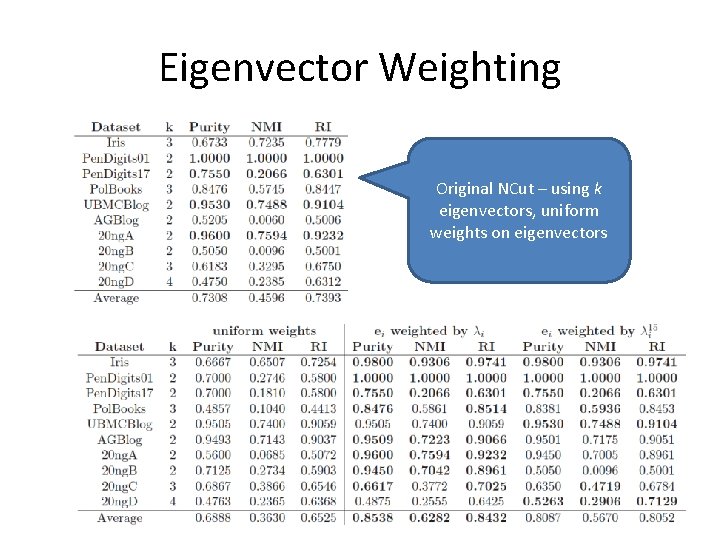
Eigenvector Weighting Use 10 eigenvectors, uniform weights
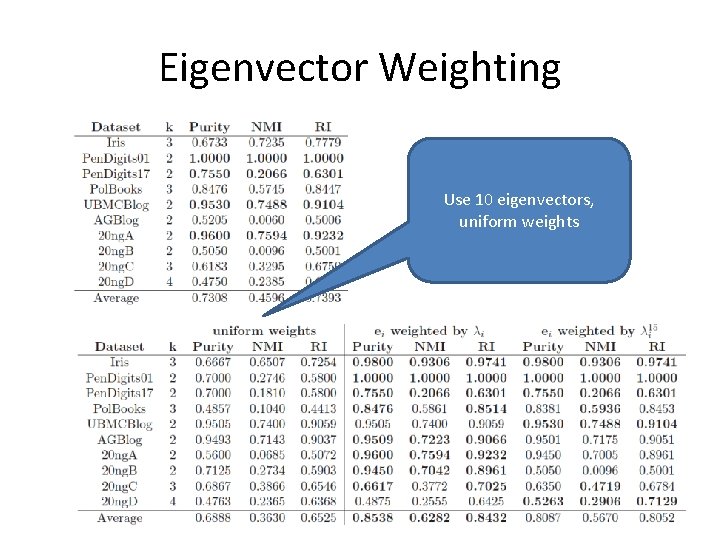
Eigenvector Weighting Use 10 eigenvectors, weighted by respective eigenvalues
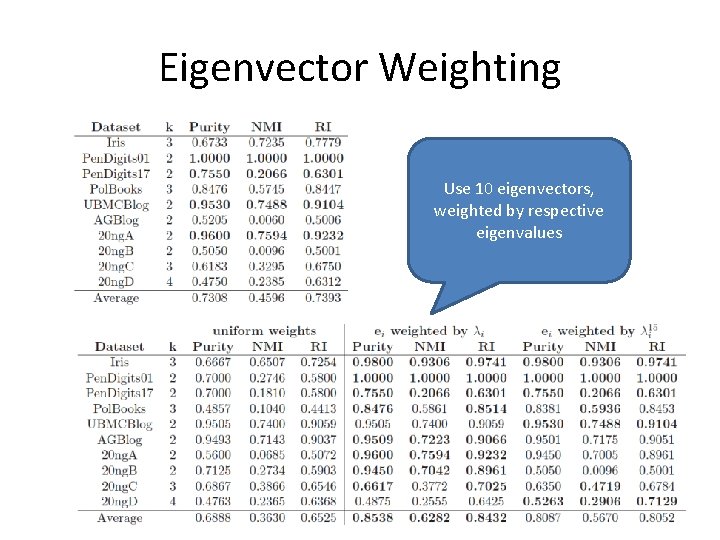
Eigenvector Weighting Use 10 eigenvectors, weighted by respective eigenvalues raised to the 15 th power (roughly average number of PIC iterations)
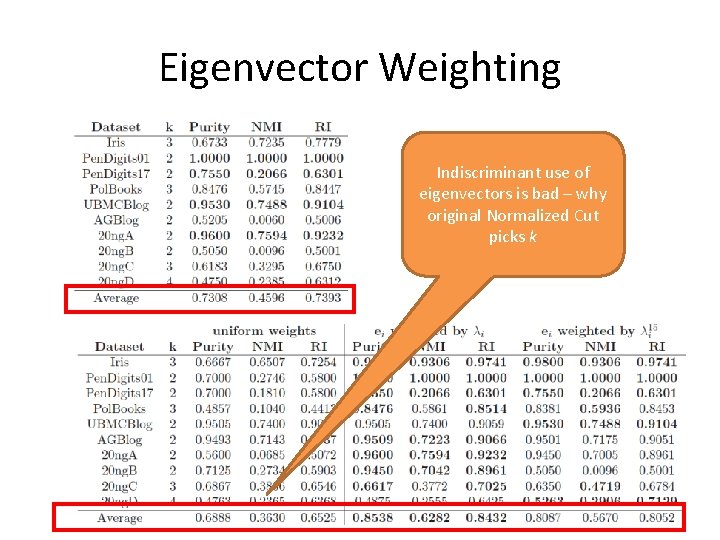
Eigenvector Weighting Indiscriminant use of eigenvectors is bad – why original Normalized Cut picks k
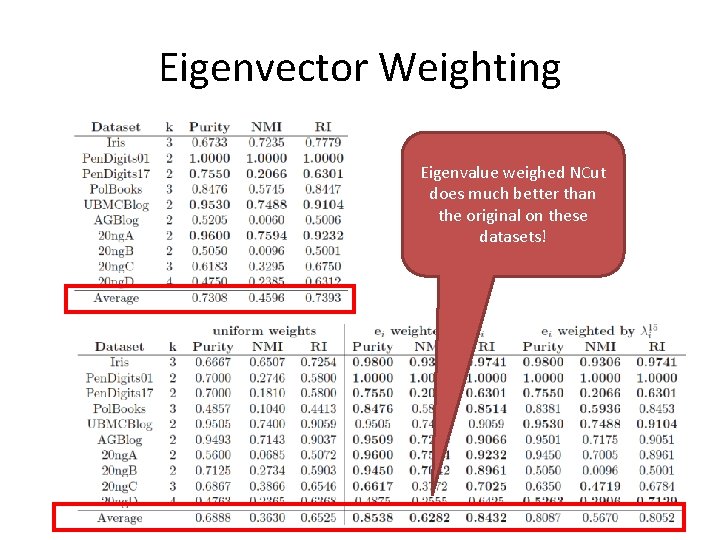
Eigenvector Weighting Eigenvalue weighed NCut does much better than the original on these datasets!
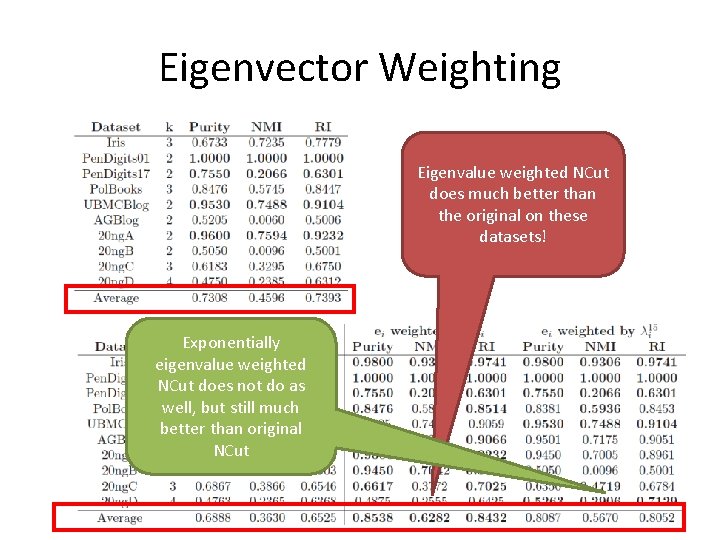
Eigenvector Weighting Eigenvalue weighted NCut does much better than the original on these datasets! Exponentially eigenvalue weighted NCut does not do as well, but still much better than original NCut
Eigenvector Weighting • Eigenvalue weighting seems to improve results! • However, it requires a (possibly much) greater number of eigenvectors and eigenvalues: – More eigenvectors may mean less precise eigenvectors – It often means more computation time is required • Eigenvector selection and weighting for spectral clustering is itself a subject of much recent study and research
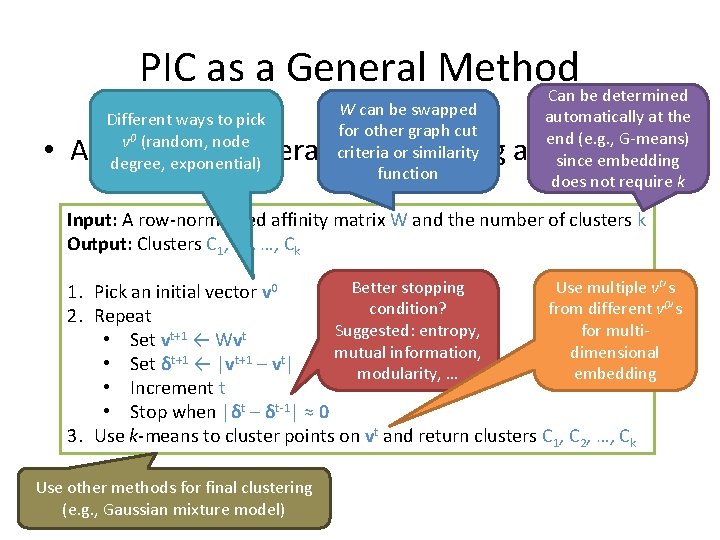
PIC as a General Method
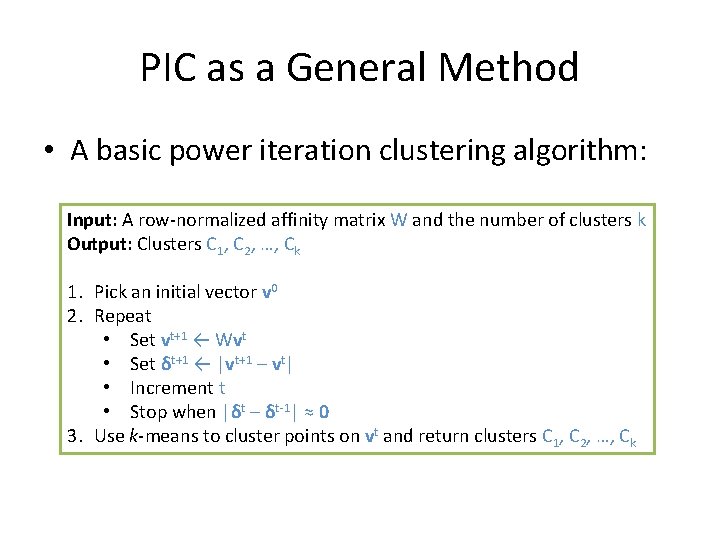
PIC as a General Method • A basic power iteration clustering algorithm: Input: A row-normalized affinity matrix W and the number of clusters k Output: Clusters C 1, C 2, …, Ck 1. Pick an initial vector v 0 2. Repeat • Set vt+1 ← Wvt • Set δt+1 ← |vt+1 – vt| • Increment t • Stop when |δt – δt-1| ≈ 0 3. Use k-means to cluster points on vt and return clusters C 1, C 2, …, Ck
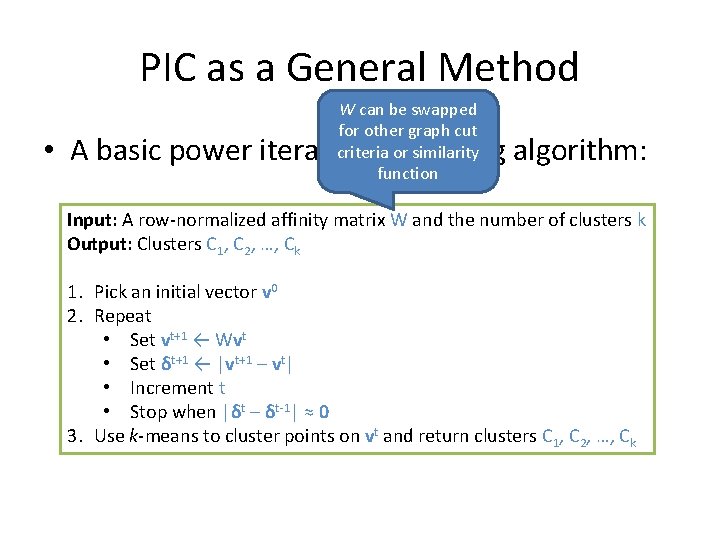
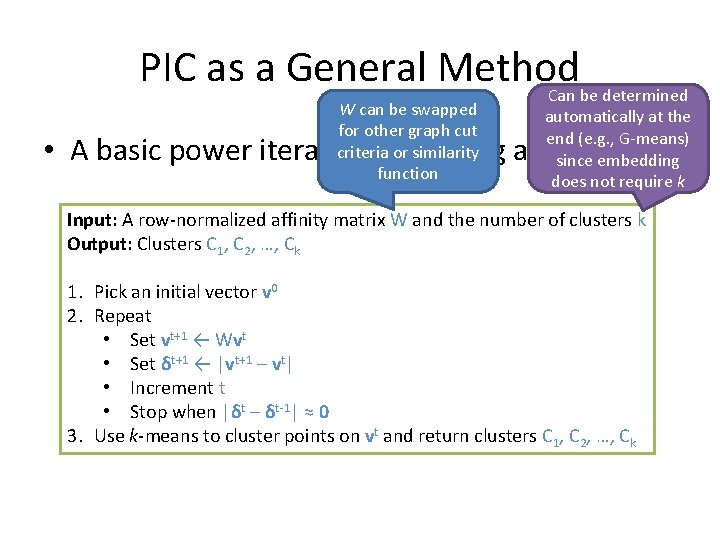
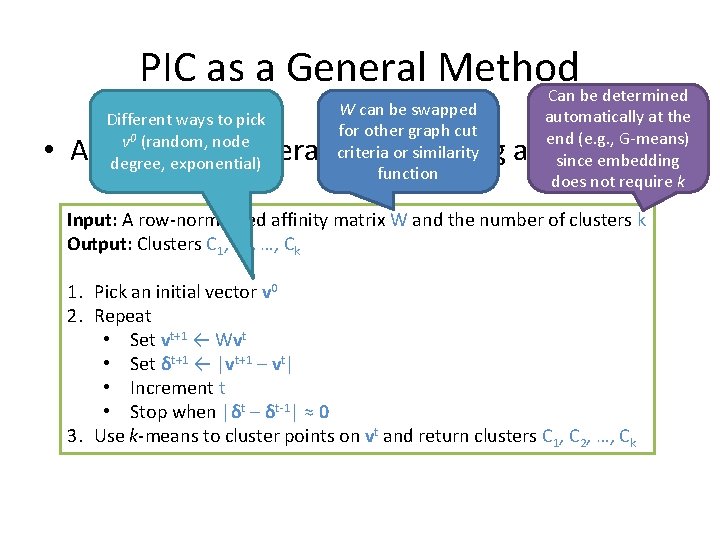
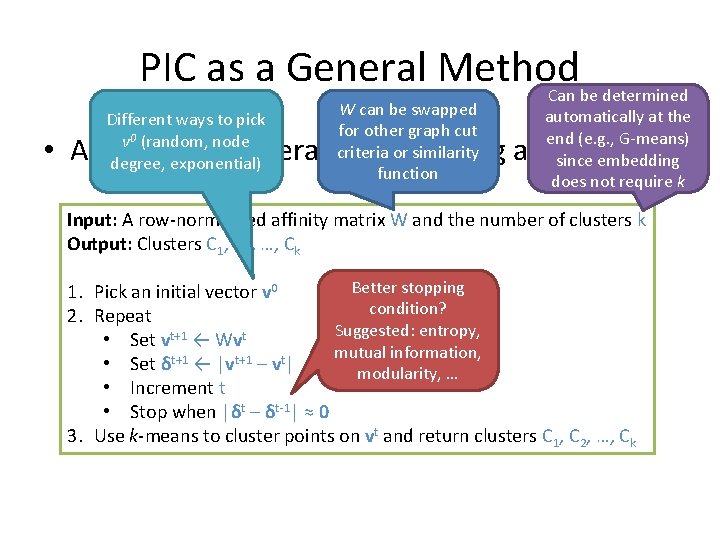
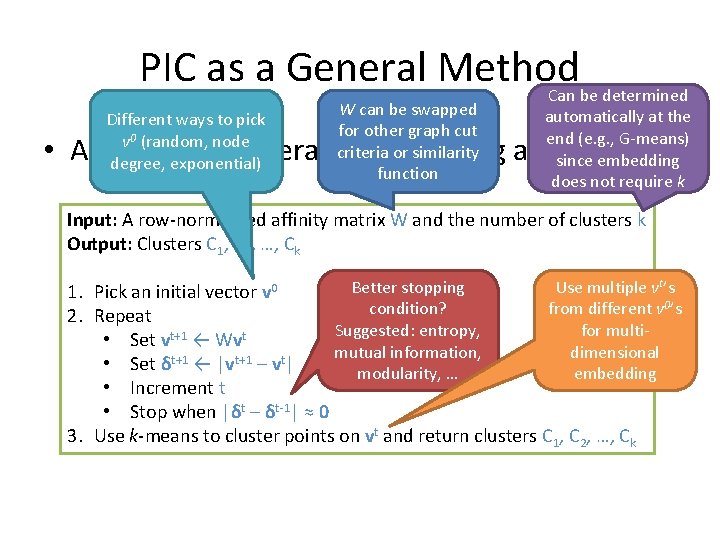
PIC as a General Method W can be swapped for other graph cut criteria or similarity function • A basic power iteration clustering algorithm: Input: A row-normalized affinity matrix W and the number of clusters k Output: Clusters C 1, C 2, …, Ck 1. Pick an initial vector v 0 2. Repeat • Set vt+1 ← Wvt • Set δt+1 ← |vt+1 – vt| • Increment t • Stop when |δt – δt-1| ≈ 0 3. Use k-means to cluster points on vt and return clusters C 1, C 2, …, Ck
PIC as a General Method Can be determined W can be swapped for other graph cut criteria or similarity function automatically at the end (e. g. , G-means) since embedding does not require k • A basic power iteration clustering algorithm: Input: A row-normalized affinity matrix W and the number of clusters k Output: Clusters C 1, C 2, …, Ck 1. Pick an initial vector v 0 2. Repeat • Set vt+1 ← Wvt • Set δt+1 ← |vt+1 – vt| • Increment t • Stop when |δt – δt-1| ≈ 0 3. Use k-means to cluster points on vt and return clusters C 1, C 2, …, Ck
PIC as a General Method Can be determined Different ways to pick v 0 (random, node degree, exponential) W can be swapped for other graph cut criteria or similarity function automatically at the end (e. g. , G-means) since embedding does not require k • A basic power iteration clustering algorithm: Input: A row-normalized affinity matrix W and the number of clusters k Output: Clusters C 1, C 2, …, Ck 1. Pick an initial vector v 0 2. Repeat • Set vt+1 ← Wvt • Set δt+1 ← |vt+1 – vt| • Increment t • Stop when |δt – δt-1| ≈ 0 3. Use k-means to cluster points on vt and return clusters C 1, C 2, …, Ck
PIC as a General Method Can be determined Different ways to pick v 0 (random, node degree, exponential) W can be swapped for other graph cut criteria or similarity function automatically at the end (e. g. , G-means) since embedding does not require k • A basic power iteration clustering algorithm: Input: A row-normalized affinity matrix W and the number of clusters k Output: Clusters C 1, C 2, …, Ck Better stopping 1. Pick an initial vector v 0 condition? 2. Repeat Suggested: entropy, • Set vt+1 ← Wvt mutual information, • Set δt+1 ← |vt+1 – vt| modularity, … • Increment t • Stop when |δt – δt-1| ≈ 0 3. Use k-means to cluster points on vt and return clusters C 1, C 2, …, Ck
PIC as a General Method Can be determined Different ways to pick v 0 (random, node degree, exponential) W can be swapped for other graph cut criteria or similarity function automatically at the end (e. g. , G-means) since embedding does not require k • A basic power iteration clustering algorithm: Input: A row-normalized affinity matrix W and the number of clusters k Output: Clusters C 1, C 2, …, Ck Better stopping Use multiple v ’s 1. Pick an initial vector v 0 condition? from different v 0’s 2. Repeat Suggested: entropy, for multi • Set vt+1 ← Wvt mutual information, dimensional • Set δt+1 ← |vt+1 – vt| modularity, … embedding • Increment t • Stop when |δt – δt-1| ≈ 0 3. Use k-means to cluster points on vt and return clusters C 1, C 2, …, Ck t
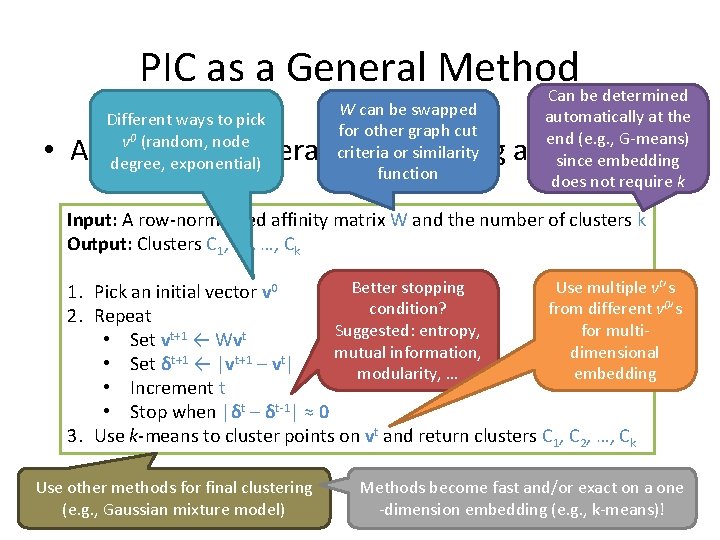
PIC as a General Method Can be determined Different ways to pick v 0 (random, node degree, exponential) W can be swapped for other graph cut criteria or similarity function automatically at the end (e. g. , G-means) since embedding does not require k • A basic power iteration clustering algorithm: Input: A row-normalized affinity matrix W and the number of clusters k Output: Clusters C 1, C 2, …, Ck Better stopping Use multiple v ’s 1. Pick an initial vector v 0 condition? from different v 0’s 2. Repeat Suggested: entropy, for multi • Set vt+1 ← Wvt mutual information, dimensional • Set δt+1 ← |vt+1 – vt| modularity, … embedding • Increment t • Stop when |δt – δt-1| ≈ 0 3. Use k-means to cluster points on vt and return clusters C 1, C 2, …, Ck t Use other methods for final clustering (e. g. , Gaussian mixture model)
PIC as a General Method Can be determined Different ways to pick v 0 (random, node degree, exponential) W can be swapped for other graph cut criteria or similarity function automatically at the end (e. g. , G-means) since embedding does not require k • A basic power iteration clustering algorithm: Input: A row-normalized affinity matrix W and the number of clusters k Output: Clusters C 1, C 2, …, Ck Better stopping Use multiple v ’s 1. Pick an initial vector v 0 condition? from different v 0’s 2. Repeat Suggested: entropy, for multi • Set vt+1 ← Wvt mutual information, dimensional • Set δt+1 ← |vt+1 – vt| modularity, … embedding • Increment t • Stop when |δt – δt-1| ≈ 0 3. Use k-means to cluster points on vt and return clusters C 1, C 2, …, Ck t Use other methods for final clustering (e. g. , Gaussian mixture model) Methods become fast and/or exact on a one -dimension embedding (e. g. , k-means)!
Spectral Clustering • Things to consider: – Choosing a similarity function – Choosing the number of clusters k? – Which eigenvectors should be considered “significant”? • The top or bottom k is not always the best for k clusters, especially on noisy data (Li et al. 2007, Xiang & Gong 2008) – Finding eigenvectors and eigenvalues of a matrix is very slow in general: O(n 3) – Construction and storage of, and operations on a dense similarity matrix could be expensive: O(n 2)
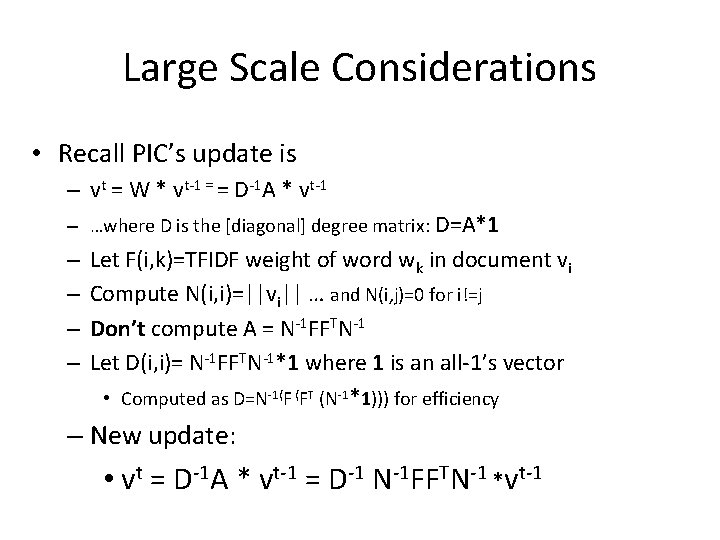
Large Scale Considerations • But…what if the dataset is large and the similarity matrix is dense? For example, a large document collection where each data point is a term vector? • Constructing, storing, and operating on an Nx. N dense matrix is very inefficient in time and space.
Lazy computation of distances and normalizers • Recall PIC’s update is – vt = W*vt-1 = = D-1 A * vt-1 – …where D is the [diagonal] degree matrix: D=A*1 • My favorite distance metric for text is lengthnormalized if-idf: – Def’n: A(i, j)=<vi, vj>/||vi||*||vj|| – Let N(i, i)=||vi|| … and N(i, j)=0 for i!=j – Let F(i, k)=tf-idf weight of word wk in document vi – Then: A = N-1 FFTN-1
Large Scale Considerations • Recall PIC’s update is – vt = W * vt-1 = = D-1 A * vt-1 – …where D is the [diagonal] degree matrix: D=A*1 – – Let F(i, k)=TFIDF weight of word wk in document vi Compute N(i, i)=||vi|| … and N(i, j)=0 for i!=j Don’t compute A = N-1 FFTN-1 Let D(i, i)= N-1 FFTN-1*1 where 1 is an all-1’s vector • Computed as D=N-1(F (FT (N-1*1))) for efficiency – New update: • vt = D-1 A * vt-1 = D-1 N-1 FFTN-1 *vt-1
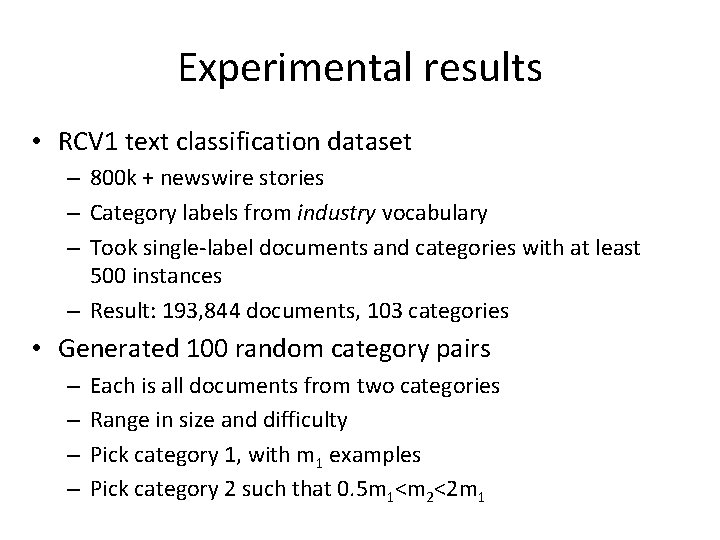
Experimental results • RCV 1 text classification dataset – 800 k + newswire stories – Category labels from industry vocabulary – Took single-label documents and categories with at least 500 instances – Result: 193, 844 documents, 103 categories • Generated 100 random category pairs – – Each is all documents from two categories Range in size and difficulty Pick category 1, with m 1 examples Pick category 2 such that 0. 5 m 1<m 2<2 m 1
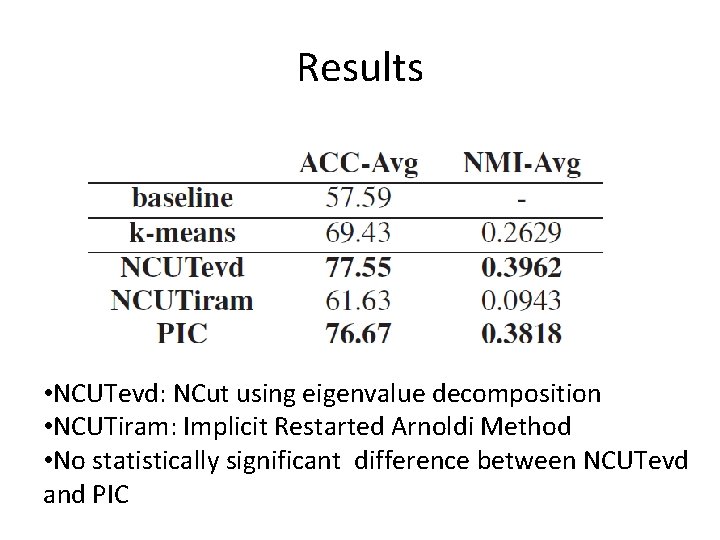
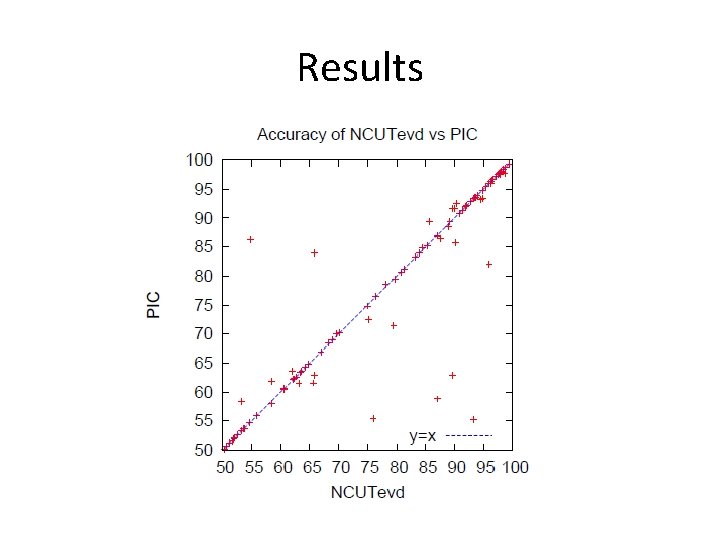
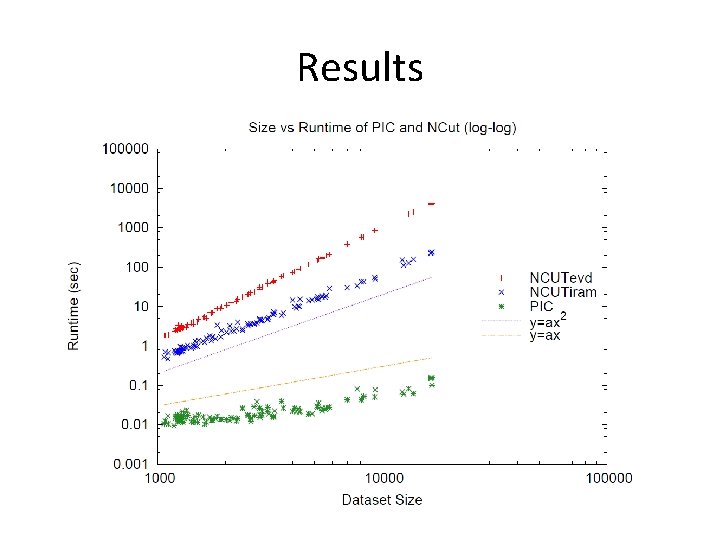
Results • NCUTevd: NCut using eigenvalue decomposition • NCUTiram: Implicit Restarted Arnoldi Method • No statistically significant difference between NCUTevd and PIC
Results
Results
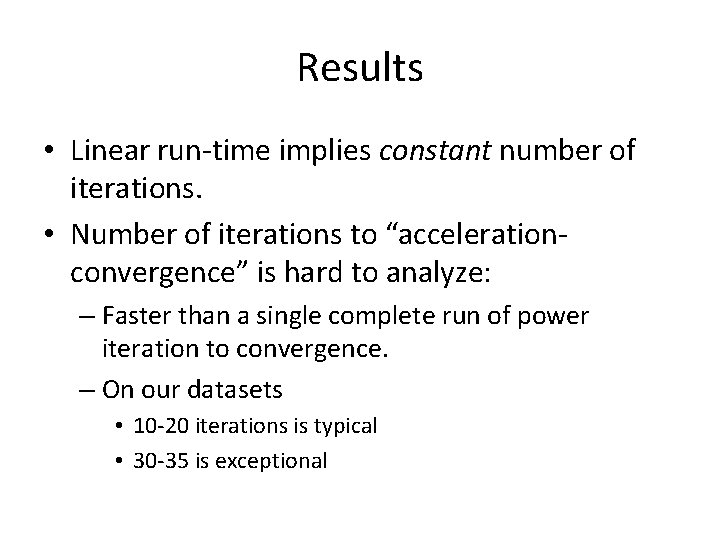
Results • Linear run-time implies constant number of iterations. • Number of iterations to “accelerationconvergence” is hard to analyze: – Faster than a single complete run of power iteration to convergence. – On our datasets • 10 -20 iterations is typical • 30 -35 is exceptional
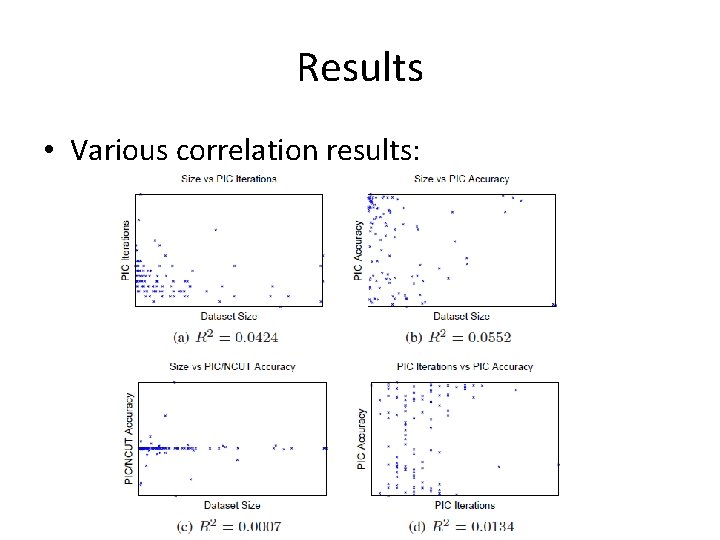
Results • Various correlation results: